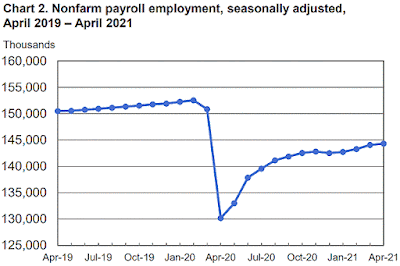
Employment Situation Report for April 2021
The Employment Situation Report for April 2021 was released by The Department of Labor's Bureau of Labor Statistics this morning:
Nonfarm Payrolls (month-to-month change)
Predicted: +900,000
Actual: +266,000
U-3 Unemployment Rate (Headline)
Actual: 6.1%
Previous Month: 6.0%
12 Months Previous: 14.8%
U-6 Unemployment Rate*
Actual: 10.4%
Previous Month: 10.7%
12 Months Previous: 22.9%
Average Hourly Earnings (month-to-month change)
Predicted: +0.3%
Actual: +0.792% (+$0.20)
Average Hourly Earnings (year-on-year change)
Predicted: +5.0%
Actual: +1.153% (+$0.29)
Average Weekly Earnings (month-to-month change)
Actual: +0.792% (+$6.88)
Average Weekly Earnings (year-on-year change)
Actual: +3.87% (+$32.62)
Civilian Labor Force Participation Rate: 61.7%
Previous Month: 61.5%
12 Months Previous: 60.2%
Average Workweek
Predicted: 34.9 hours
Actual: 35.0 hours
Economist, academics, central bankers and investors pay very close attention to the monthly Employment Situation report as it offers penetrating insight as to the current and near-future state of the overall U.S. economy. If a) Americans are earning more money and b) the economy is creating new jobs, this typically translates to more money being pumped into the economy (and vice versa.)
The "predicted" figure is what economists were expecting, while the "actual" is the true or real figure.
===================
From Today's Report:
* = The U-6 Unemployment Rate is defined as:
===================
===================
Predicted: +900,000
Actual: +266,000
U-3 Unemployment Rate (Headline)
Actual: 6.1%
Previous Month: 6.0%
12 Months Previous: 14.8%
U-6 Unemployment Rate*
Actual: 10.4%
Previous Month: 10.7%
12 Months Previous: 22.9%
Average Hourly Earnings (month-to-month change)
Predicted: +0.3%
Actual: +0.792% (+$0.20)
Average Hourly Earnings (year-on-year change)
Predicted: +5.0%
Actual: +1.153% (+$0.29)
Average Weekly Earnings (month-to-month change)
Actual: +0.792% (+$6.88)
Average Weekly Earnings (year-on-year change)
Actual: +3.87% (+$32.62)
Civilian Labor Force Participation Rate: 61.7%
Previous Month: 61.5%
12 Months Previous: 60.2%
Average Workweek
Predicted: 34.9 hours
Actual: 35.0 hours
Economist, academics, central bankers and investors pay very close attention to the monthly Employment Situation report as it offers penetrating insight as to the current and near-future state of the overall U.S. economy. If a) Americans are earning more money and b) the economy is creating new jobs, this typically translates to more money being pumped into the economy (and vice versa.)
The "predicted" figure is what economists were expecting, while the "actual" is the true or real figure.
===================
From Today's Report:
"...The change in total nonfarm payroll employment for February was revised up by 68,000, from +468,000 to +536,000, and the change for March was revised down by 146,000, from +916,000 to +770,000. With these revisions, employment in February and March combined is 78,000 lower than previously reported. (Monthly revisions result from additional reports received from businesses and government agencies since the last published estimates and from the recalculation of seasonal factors.)..."
===================
===================
* = The U-6 Unemployment Rate is defined as:
"Total unemployed, plus all persons marginally attached to the labor force, plus total employed part time for economic reasons, as a percent of the civilian labor force plus all persons marginally attached to the labor force."
===================
===================
Labels: Coronavirus, COVID-19, COVID19, employment, employment_situation, hard_data, jobs, labor, new_economy, Pandemic, wages
|
--> www.FedPrimeRate.com Privacy Policy <--
CLICK HERE to JUMP to the TOP of THIS PAGE > SITEMAP < |


0 Comments:
Post a Comment
<< Home