.comment-link {margin-left:.6em;}

Economy

Economic Data (USA)

Saturday, March 09, 2024

Employment Situation Report for February 2024

Employment Situation Report for February 2024 was released by The Department of Labor's Bureau of Labor Statistics this morning:

Nonfarm Payrolls (month-to-month change)
Actual: +275,000
Previous Month (Revised): 229,000
One Year Previous: 287,000

U-3 Unemployment Rate (Headline)
Actual: 3.9%
Previous Month: 3.7%
12 Months Previous: 3.6%

U-6 Unemployment Rate*
Actual: 7.3%
Previous Month: 7.2%
12 Months Previous: 6.8%

Average Hourly Earnings (month-to-month change)
Predicted: +0.4%
Actual: +0.145% (+$0.05)

Average Hourly Earnings (year-on-year change) 
Predicted: +4.3%
Actual: +4.28% (+$1.42)

Average Weekly Earnings (month-to-month change)
Actual: +0.44% (+$5.17)


Average Weekly Earnings (year-on-year change)
Actual: +3.68% (+$42.07)

Civilian Labor Force Participation Rate: 62.5%
Previous Month: 62.5%
12 Months Previous: 62.5%

Average Workweek
Predicted: 34.3 hours
Actual: 34.3 hours

Economist, academics, central bankers and investors pay very close attention to the monthly Employment Situation report as it offers penetrating insight as to the current and near-future state of the overall U.S. economy. If a) Americans are earning more money and b) the economy is creating new jobs, this typically translates to more money being pumped into the economy (and vice versa.)

The "predicted" figure is what economists were expecting, while the "actual" is the true or real figure.

===================

CHART: Month-to-Month Change In Nonfarm Payroll Employment - February 2022 thru February 2024

CHART: Month-to-Month Change
In Nonfarm Payroll Employment
February 2022 thru February 2024

   ===================

 * =  The U-6 Unemployment Rate is defined as:

"Total unemployed, plus all persons marginally attached to the labor force, plus total employed part time for economic reasons, as a percent of the civilian labor force plus all persons marginally attached to the labor force."

===================


=================== 

Labels: , , , , , , , , , , , , , , , , , ,


--> www.FedPrimeRate.com Privacy Policy <--

>  SITEMAP  <

Saturday, February 03, 2024

Employment Situation Report for January 2024

Employment Situation Report for January 2024 was released by The Department of Labor's Bureau of Labor Statistics this morning:

Nonfarm Payrolls (month-to-month change)
Actual: +353,000
Previous Month (Revised): 333,000
One Year Previous: 482,000

U-3 Unemployment Rate (Headline)
Actual: 3.7%
Previous Month: 3.7%
12 Months Previous: 3.4%

U-6 Unemployment Rate*
Actual: 7.2%
Previous Month: 7.1%
12 Months Previous: 6.7%

Average Hourly Earnings (month-to-month change)
Predicted: +0.4%
Actual: +0.553% (+$0.19)

Average Hourly Earnings (year-on-year change)
Predicted: +4.3%
Actual: +4.48% (+$1.48)

Average Weekly Earnings (month-to-month change)
Actual: -0.03% (-$0.39)


Average Weekly Earnings (year-on-year change)
Actual: +2.97% (+$33.94)

Civilian Labor Force Participation Rate: 62.5%
Previous Month: 62.5%
12 Months Previous: 62.4%

Average Workweek
Predicted: 34.4 hours
Actual: 34.1 hours

Economist, academics, central bankers and investors pay very close attention to the monthly Employment Situation report as it offers penetrating insight as to the current and near-future state of the overall U.S. economy. If a) Americans are earning more money and b) the economy is creating new jobs, this typically translates to more money being pumped into the economy (and vice versa.)

The "predicted" figure is what economists were expecting, while the "actual" is the true or real figure.

===================

CHART: Unemployment Rate - January 2024 UPDATE

CHART: Unemployment Rate
 January 2024 UPDATE

   ===================

 * =  The U-6 Unemployment Rate is defined as:

"Total unemployed, plus all persons marginally attached to the labor force, plus total employed part time for economic reasons, as a percent of the civilian labor force plus all persons marginally attached to the labor force."

===================


===================  

Labels: , , , , , , , , , , , , , , , , , ,


--> www.FedPrimeRate.com Privacy Policy <--

>  SITEMAP  <

Saturday, November 04, 2023

Employment Situation Report for October 2023

Employment Situation Report for October 2023 was released by The Department of Labor's Bureau of Labor Statistics this morning:

Nonfarm Payrolls (month-to-month change)
Actual: +150,000
Previous Month (Revised): 297,000
One Year Previous: 324,000

U-3 Unemployment Rate (Headline)
Actual: 3.9%
Previous Month: 3.8%
12 Months Previous: 3.7%

U-6 Unemployment Rate*
Actual: 7.2%
Previous Month: 7.0%
12 Months Previous: 6.7%

Average Hourly Earnings (month-to-month change)
Predicted: +0.4%
Actual: +0.206% (+$0.07)

Average Hourly Earnings (year-on-year change)
Predicted: +4.4%
Actual: +4.103% (+$1.34)

Average Weekly Earnings (month-to-month change)
Actual: -0.085% (-$0.99)


Average Weekly Earnings (year-on-year change)
Actual: +3.2% (+$36.16)

Civilian Labor Force Participation Rate: 62.7%
Previous Month: 62.8%
12 Months Previous: 62.2%

Average Workweek
Predicted: 34.3 hours
Actual: 34.3 hours

Economist, academics, central bankers and investors pay very close attention to the monthly Employment Situation report as it offers penetrating insight as to the current and near-future state of the overall U.S. economy. If a) Americans are earning more money and b) the economy is creating new jobs, this typically translates to more money being pumped into the economy (and vice versa.)

The "predicted" figure is what economists were expecting, while the "actual" is the true or real figure.

===================

CHART: Month-to-Month Change In Nonfarm Employment - October 2023 UPDATE
CHART: Month-to-Month Change
In Nonfarm Employment
October 2023 UPDATE
   ===================

 * =  The U-6 Unemployment Rate is defined as:

"Total unemployed, plus all persons marginally attached to the labor force, plus total employed part time for economic reasons, as a percent of the civilian labor force plus all persons marginally attached to the labor force."

===================


=================== 

Labels: , , , , , , , , , , , , , , , , , ,


--> www.FedPrimeRate.com Privacy Policy <--

>  SITEMAP  <

Wednesday, October 11, 2023

Employment Situation Report for September 2023

Employment Situation Report for September 2023 was released by The Department of Labor's Bureau of Labor Statistics this morning:

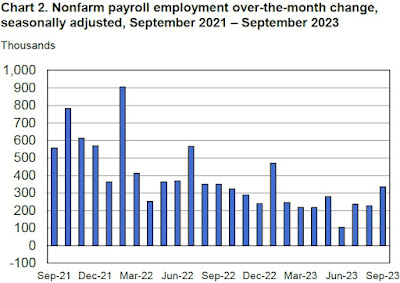
Nonfarm Payrolls (month-to-month change)
Actual: +336,000
Previous Month (Revised): 227,000
One Year Previous: 350,000

U-3 Unemployment Rate (Headline)
Actual: 3.8%
Previous Month: 3.8%
12 Months Previous: 3.5%

U-6 Unemployment Rate*
Actual: 7.0%
Previous Month: 7.1%
12 Months Previous: 6.7%

Average Hourly Earnings (month-to-month change)
Predicted: +0.4%
Actual: +0.207% (+$0.07)

Average Hourly Earnings (year-on-year change)
Predicted: +4.4%
Actual: +4.15% (+$1.35)

Average Weekly Earnings (month-to-month change)
Actual: +0.207% (+$2.41)


Average Weekly Earnings (year-on-year change)
Actual: +3.55% (+$39.93)

Civilian Labor Force Participation Rate: 62.8%
Previous Month: 62.8%
12 Months Previous: 62.3%

Average Workweek
Predicted: 34.4 hours
Actual: 34.4 hours

Economist, academics, central bankers and investors pay very close attention to the monthly Employment Situation report as it offers penetrating insight as to the current and near-future state of the overall U.S. economy. If a) Americans are earning more money and b) the economy is creating new jobs, this typically translates to more money being pumped into the economy (and vice versa.)

The "predicted" figure is what economists were expecting, while the "actual" is the true or real figure.

===================

CHART: Month-to-Month Change In Nonfarm Employment - September 2023 UPDATE
CHART: Month-to-Month Change
In Nonfarm Employment
September 2023 UPDATE

   ===================

 * =  The U-6 Unemployment Rate is defined as:

"Total unemployed, plus all persons marginally attached to the labor force, plus total employed part time for economic reasons, as a percent of the civilian labor force plus all persons marginally attached to the labor force."

===================


=================== 


Labels: , , , , , , , , , , , , , , , , , ,


--> www.FedPrimeRate.com Privacy Policy <--

>  SITEMAP  <

Friday, September 01, 2023

Employment Situation Report for August 2023

Employment Situation Report for August 2023 was released by The Department of Labor's Bureau of Labor Statistics this morning:

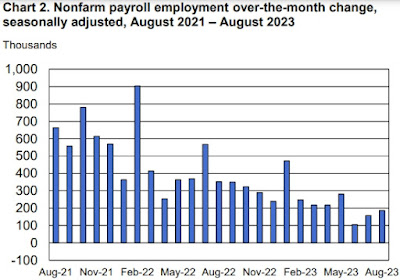
Nonfarm Payrolls (month-to-month change)
Actual: +187,000
Previous Month (Revised): 157,000
One Year Previous: 352,000

U-3 Unemployment Rate (Headline)
Actual: 3.8%
Previous Month: 3.5%
12 Months Previous: 3.7%

U-6 Unemployment Rate*
Actual: 7.1%
Previous Month: 6.7%
12 Months Previous: 7.0%

Average Hourly Earnings (month-to-month change)
Predicted: +0.4%
Actual: +0.237% (+$0.08)

Average Hourly Earnings (year-on-year change)
Predicted: +4.4%
Actual: +4.29% (+$1.39)

Average Weekly Earnings (month-to-month change)
Actual: +0.53% (+$6.13)


Average Weekly Earnings (year-on-year change)
Actual: +3.98% (+$44.57)

Civilian Labor Force Participation Rate: 62.8%
Previous Month: 62.6%
12 Months Previous: 62.3%

Average Workweek
Predicted: 34.4 hours
Actual: 34.4 hours

Economist, academics, central bankers and investors pay very close attention to the monthly Employment Situation report as it offers penetrating insight as to the current and near-future state of the overall U.S. economy. If a) Americans are earning more money and b) the economy is creating new jobs, this typically translates to more money being pumped into the economy (and vice versa.)

The "predicted" figure is what economists were expecting, while the "actual" is the true or real figure.

===================

CHART: Month-to-Month Change In Nonfarm Employment - August 2023 Update
CHART: Month-to-Month Change
In Nonfarm Employment
August 2023 Update


   ===================

 * =  The U-6 Unemployment Rate is defined as:

"Total unemployed, plus all persons marginally attached to the labor force, plus total employed part time for economic reasons, as a percent of the civilian labor force plus all persons marginally attached to the labor force."

===================


=================== 

Labels: , , , , , , , , , , , , , , , , , ,


--> www.FedPrimeRate.com Privacy Policy <--

>  SITEMAP  <

Friday, August 04, 2023

Employment Situation Report for July 2023

Employment Situation Report for July 2023 was released by The Department of Labor's Bureau of Labor Statistics this morning:

Nonfarm Payrolls (month-to-month change)
Actual: +187,000
Previous Month (Revised): 185,000
One Year Previous: 568,000

U-3 Unemployment Rate (Headline)
Actual: 3.5%
Previous Month: 3.6%
12 Months Previous: 3.5%

U-6 Unemployment Rate*
Actual: 6.7%
Previous Month: 6.9%
12 Months Previous: 6.8%

Average Hourly Earnings (month-to-month change)
Predicted: +0.4%
Actual: +0.417% (+$0.14)

Average Hourly Earnings (year-on-year change)
Predicted: +4.4%
Actual: +4.361% (+$1.41)

Average Weekly Earnings (month-to-month change)
Actual: +0.125% (+$1.44)


Average Weekly Earnings (year-on-year change)
Actual: +3.46% (+$38.66)

Civilian Labor Force Participation Rate: 62.6%
Previous Month: 62.6%
12 Months Previous: 62.1%

Average Workweek
Predicted: 34.4 hours
Actual: 34.3 hours

Economist, academics, central bankers and investors pay very close attention to the monthly Employment Situation report as it offers penetrating insight as to the current and near-future state of the overall U.S. economy. If a) Americans are earning more money and b) the economy is creating new jobs, this typically translates to more money being pumped into the economy (and vice versa.)

The "predicted" figure is what economists were expecting, while the "actual" is the true or real figure.

===================

CHART: Month-to-Month Change In Nonfarm Employment - July 2023 Update
CHART: Month-to-Month Change
In Nonfarm Employment
July 2023 Update


   ===================

 * =  The U-6 Unemployment Rate is defined as:

"Total unemployed, plus all persons marginally attached to the labor force, plus total employed part time for economic reasons, as a percent of the civilian labor force plus all persons marginally attached to the labor force."

===================


=================== 

Labels: , , , , , , , , , , , , , , , , , ,


--> www.FedPrimeRate.com Privacy Policy <--

>  SITEMAP  <

Friday, July 07, 2023

Employment Situation Report for June 2023

Employment Situation Report for June 2023 was released by The Department of Labor's Bureau of Labor Statistics this morning:

Nonfarm Payrolls (month-to-month change)
Actual: +209,000
Previous Month (Revised): 306,000
One Year Previous: 370,000

U-3 Unemployment Rate (Headline)
Actual: 3.6%
Previous Month: 3.7%
12 Months Previous: 3.6%

U-6 Unemployment Rate*
Actual: 6.9%
Previous Month: 6.7%
12 Months Previous: 6.7%

Average Hourly Earnings (month-to-month change)
Predicted: +0.3%
Actual: +0.36% (+$0.12)

Average Hourly Earnings (year-on-year change)
Predicted: +3.5%
Actual: +4.35% (+$1.40)

Average Weekly Earnings (month-to-month change)
Actual: +0.65% (+$7.47)


Average Weekly Earnings (year-on-year change)
Actual: +3.75% (+$41.72)

Civilian Labor Force Participation Rate: 62.6%
Previous Month: 62.6%
12 Months Previous: 62.2%

Average Workweek
Predicted: 34.4 hours
Actual: 34.4 hours

Economist, academics, central bankers and investors pay very close attention to the monthly Employment Situation report as it offers penetrating insight as to the current and near-future state of the overall U.S. economy. If a) Americans are earning more money and b) the economy is creating new jobs, this typically translates to more money being pumped into the economy (and vice versa.)

The "predicted" figure is what economists were expecting, while the "actual" is the true or real figure.


===================

CHART: U-3 (Official) Unemployment Rate - June 2023 Update
CHART: U-3 (Official) Unemployment Rate
June 2023 Update


   ===================

 * =  The U-6 Unemployment Rate is defined as:

"Total unemployed, plus all persons marginally attached to the labor force, plus total employed part time for economic reasons, as a percent of the civilian labor force plus all persons marginally attached to the labor force."

===================


=================== 

Labels: , , , , , , , , , , , , , , , , , ,


--> www.FedPrimeRate.com Privacy Policy <--

>  SITEMAP  <

Friday, June 02, 2023

Employment Situation Report for May 2023

Employment Situation Report for May 2023 was released by The Department of Labor's Bureau of Labor Statistics this morning:

Nonfarm Payrolls (month-to-month change)
Actual: +339,000
Previous Month (Revised): 294,000
One Year Previous: 364,000

U-3 Unemployment Rate (Headline)
Actual: 3.7%
Previous Month: 3.4%
12 Months Previous: 3.6%

U-6 Unemployment Rate*
Actual: 6.7%
Previous Month: 6.6%
12 Months Previous: 7.1%

Average Hourly Earnings (month-to-month change)
Predicted: +0.3%
Actual: +0.33% (+$0.11)

Average Hourly Earnings (year-on-year change)
Predicted: +3.5%
Actual: +4.304% (+$1.38)

Average Weekly Earnings (month-to-month change)
Actual: +0.038% (+$0.44)


Average Weekly Earnings (year-on-year change)
Actual: +3.4% (+$37.71)

Civilian Labor Force Participation Rate: 62.6%
Previous Month: 62.6%
12 Months Previous: 62.3%

Average Workweek
Predicted: 34.4 hours
Actual: 34.3 hours

Economist, academics, central bankers and investors pay very close attention to the monthly Employment Situation report as it offers penetrating insight as to the current and near-future state of the overall U.S. economy. If a) Americans are earning more money and b) the economy is creating new jobs, this typically translates to more money being pumped into the economy (and vice versa.)

The "predicted" figure is what economists were expecting, while the "actual" is the true or real figure.


===================

CHART: U-3 (Official) Unemployment Rate - May 2023 Update

CHART: U-3 (Official) Unemployment Rate
May 2023 Update


   ===================

 * =  The U-6 Unemployment Rate is defined as:

"Total unemployed, plus all persons marginally attached to the labor force, plus total employed part time for economic reasons, as a percent of the civilian labor force plus all persons marginally attached to the labor force."

===================


=================== 


Labels: , , , , , , , , , , , , , , , ,


--> www.FedPrimeRate.com Privacy Policy <--

>  SITEMAP  <

Friday, May 05, 2023

Employment Situation Report for April 2023

Employment Situation Report for April 2023 was released by The Department of Labor's Bureau of Labor Statistics this morning:

Nonfarm Payrolls (month-to-month change)
Actual: +253,000
Previous Month (Revised): 165,000
One Year Previous: 254,000

U-3 Unemployment Rate (Headline)
Actual: 3.4%
Previous Month: 3.5%
12 Months Previous: 3.6%

U-6 Unemployment Rate*
Actual: 6.6%
Previous Month: 6.7%
12 Months Previous: 7.0%

Average Hourly Earnings (month-to-month change)
Predicted: +0.3%
Actual: +0.482% (+$0.16)

Average Hourly Earnings (year-on-year change)
Predicted: +3.5%
Actual: +4.45% (+$1.42)

Average Weekly Earnings (month-to-month change)
Actual: +0.482% (+$5.50)


Average Weekly Earnings (year-on-year change)
Actual: +3.842% (+$42.46)

Civilian Labor Force Participation Rate: 62.6%
Previous Month: 62.6%
12 Months Previous: 62.2%

Average Workweek
Predicted: 34.4 hours
Actual: 34.4 hours

Economist, academics, central bankers and investors pay very close attention to the monthly Employment Situation report as it offers penetrating insight as to the current and near-future state of the overall U.S. economy. If a) Americans are earning more money and b) the economy is creating new jobs, this typically translates to more money being pumped into the economy (and vice versa.)

The "predicted" figure is what economists were expecting, while the "actual" is the true or real figure.


===================

CHART: U-3 Unemployment Rate - April 2023 Update
CHART: U-3 Unemployment Rate
April 2023 Update


   ===================

 * =  The U-6 Unemployment Rate is defined as:

"Total unemployed, plus all persons marginally attached to the labor force, plus total employed part time for economic reasons, as a percent of the civilian labor force plus all persons marginally attached to the labor force."

===================


=================== 

Labels: , , , , , , , , , , , , , , , ,


--> www.FedPrimeRate.com Privacy Policy <--

>  SITEMAP  <

Friday, November 04, 2022

Employment Situation Report for October 2022

Employment Situation Report for October 2022 was released by The Department of Labor's Bureau of Labor Statistics this morning:

Nonfarm Payrolls (month-to-month change)
Actual: +261,000
Previous Month (Revised): 315,000
One Year Previous: 677,000

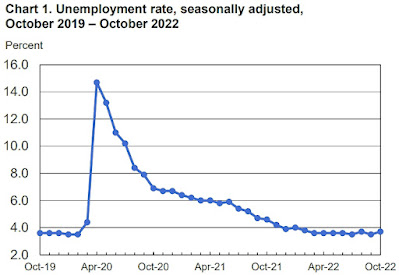
U-3 Unemployment Rate (Headline)
Actual: 3.7%
Previous Month: 3.5%
12 Months Previous: 4.6%

U-6 Unemployment Rate*
Actual: 6.8%
Previous Month: 6.7%
12 Months Previous: 8.2%

Average Hourly Earnings (month-to-month change)
Predicted: +0.3%
Actual: +0.37% (+$0.12)

Average Hourly Earnings (year-on-year change)
Predicted: +3.5%
Actual: +4.73% (+$1.47)

Average Weekly Earnings (month-to-month change)
Actual: +0.37% (+$4.14)


Average Weekly Earnings (year-on-year change)
Actual: +3.82% (+$41.38)

Civilian Labor Force Participation Rate: 62.2%
Previous Month: 62.3%
12 Months Previous: 61.7%

Average Workweek
Predicted: 34.5 hours
Actual: 34.5 hours

Economist, academics, central bankers and investors pay very close attention to the monthly Employment Situation report as it offers penetrating insight as to the current and near-future state of the overall U.S. economy. If a) Americans are earning more money and b) the economy is creating new jobs, this typically translates to more money being pumped into the economy (and vice versa.)

The "predicted" figure is what economists were expecting, while the "actual" is the true or real figure.


===================
 

CHART: U-3 Unemployment Rate October 2022 Update

CHART: U-3 Unemployment Rate
October 2022 Update


   ===================

 * =  The U-6 Unemployment Rate is defined as:

"Total unemployed, plus all persons marginally attached to the labor force, plus total employed part time for economic reasons, as a percent of the civilian labor force plus all persons marginally attached to the labor force."

===================


=================== 


Labels: , , , , , , , , , , , , , , , , , , ,


--> www.FedPrimeRate.com Privacy Policy <--

>  SITEMAP  <

Friday, October 07, 2022

Employment Situation Report for September 2022

The Employment Situation Report for September 2022 was released by The Department of Labor's Bureau of Labor Statistics this morning:

Nonfarm Payrolls (month-to-month change)
Actual: +263,000
Previous Month (Revised): 315,000
One Year Previous: 424,000

U-3 Unemployment Rate (Headline)
Actual: 3.5%
Previous Month: 3.7%
12 Months Previous: 4.7%

U-6 Unemployment Rate*
Actual: 6.7%
Previous Month: 7.0%
12 Months Previous: 8.5%

Average Hourly Earnings (month-to-month change)
Predicted: +0.3%
Actual: +0.31% (+$0.10)

Average Hourly Earnings (year-on-year change)
Predicted: +3.5%
Actual: +4.98% (+$1.54)

Average Weekly Earnings (month-to-month change)
Actual: +0.31% (+$3.45)


Average Weekly Earnings (year-on-year change)
Actual: +4.075% (+$43.85)

Civilian Labor Force Participation Rate: 62.3%
Previous Month: 62.4%
12 Months Previous: 61.7%

Average Workweek
Predicted: 34.5 hours
Actual: 34.5 hours

Economist, academics, central bankers and investors pay very close attention to the monthly Employment Situation report as it offers penetrating insight as to the current and near-future state of the overall U.S. economy. If a) Americans are earning more money and b) the economy is creating new jobs, this typically translates to more money being pumped into the economy (and vice versa.)

The "predicted" figure is what economists were expecting, while the "actual" is the true or real figure.


===================
 

CHART: Nonfarm Payroll Employment - September 2022 Update

CHART: Nonfarm Payroll Employment
September 2022 Update


   ===================

 * =  The U-6 Unemployment Rate is defined as:

"Total unemployed, plus all persons marginally attached to the labor force, plus total employed part time for economic reasons, as a percent of the civilian labor force plus all persons marginally attached to the labor force."

===================


=================== 

Labels: , , , , , , , , , , , , , , , , , , ,


--> www.FedPrimeRate.com Privacy Policy <--

>  SITEMAP  <

Friday, June 03, 2022

Employment Situation Report for May 2022

The Employment Situation Report for May 2022 was released by The Department of Labor's Bureau of Labor Statistics this morning:

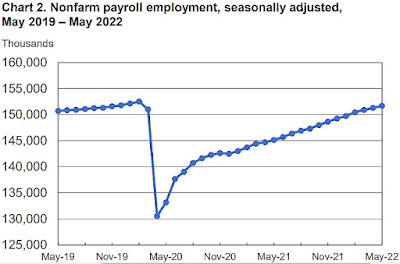
Nonfarm Payrolls (month-to-month change)
Actual: +390,000
Previous Month (Revised): 436,000
One Year Previous: 447,000

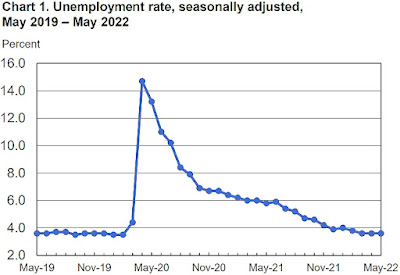
U-3 Unemployment Rate (Headline)
Actual: 3.6%
Previous Month: 3.6%
12 Months Previous: 5.8%

U-6 Unemployment Rate*
Actual: 7.1%
Previous Month: 7.0%
12 Months Previous: 10.1%

Average Hourly Earnings (month-to-month change)
Predicted: +0.3%
Actual: +0.314% (+$0.10)

Average Hourly Earnings (year-on-year change)
Predicted: +3.5%
Actual: +5.237% (+$1.59)

Average Weekly Earnings (month-to-month change)
Actual: +0.314% (+$3.46)


Average Weekly Earnings (year-on-year change)
Actual: +4.333% (+$45.91)

Civilian Labor Force Participation Rate: 62.3%
Previous Month: 62.2%
12 Months Previous: 61.6%

Average Workweek
Predicted: 34.6 hours
Actual: 34.6 hours

Economist, academics, central bankers and investors pay very close attention to the monthly Employment Situation report as it offers penetrating insight as to the current and near-future state of the overall U.S. economy. If a) Americans are earning more money and b) the economy is creating new jobs, this typically translates to more money being pumped into the economy (and vice versa.)

The "predicted" figure is what economists were expecting, while the "actual" is the true or real figure.

===================

From Today's Report:

"...In May, 7.4 percent of employed persons teleworked because of the  coronavirus pandemic, down from 7.7 percent in the prior month. These data refer to employed persons who teleworked or worked at home for pay at some point in the 4 weeks preceding the survey specifically because of the pandemic.

In May, 1.8 million persons reported that they had been unable to work because their employer closed or lost business due to the pandemic -- that is, they did not work at all or worked fewer hours at some point in the 4 weeks preceding the survey due to the pandemic. This measure is little changed from the previous month. Among those who reported in May that they were unable to work because of pandemic-related closures or lost business, 19.9 percent received at least some pay from their employer for the hours not worked, also little different from the prior month.

Among those not in the labor force in May, 455,000 persons were prevented from looking for work due to the pandemic, down from 586,000 in the prior month.
.."
===================
 

CHART: Nonfarm Payroll Employment - May 2022 Update

CHART: Nonfarm Payroll Employment
May 2022 Update

===================
 

CHART: U-3 (Headline) Unemployment Rate - May 2022 Update

CHART: U-3 (Headline) Unemployment Rate
May 2022 Update

 
   ===================

 * =  The U-6 Unemployment Rate is defined as:

"Total unemployed, plus all persons marginally attached to the labor force, plus total employed part time for economic reasons, as a percent of the civilian labor force plus all persons marginally attached to the labor force."

===================


===================


Labels: , , , , , , , , , , , , , , , , , , ,


--> www.FedPrimeRate.com Privacy Policy <--

>  SITEMAP  <

Friday, May 06, 2022

Employment Situation Report for April 2022

The Employment Situation Report for April 2022 was released by The Department of Labor's Bureau of Labor Statistics this morning:

Nonfarm Payrolls (month-to-month change)
Actual: +428,000
Previous Month (Revised): 428,000
One Year Previous: 263,000

U-3 Unemployment Rate (Headline)
Actual: 3.6%
Previous Month: 3.6%
12 Months Previous: 6.0%

U-6 Unemployment Rate*
Actual: 7.0%
Previous Month: 6.9%
12 Months Previous: 10.3%

Average Hourly Earnings (month-to-month change)
Predicted: +0.5%
Actual: +0.315% (+$0.10)

Average Hourly Earnings (year-on-year change)
Predicted: +3.5%
Actual: +5.464% (+$1.65)

Average Weekly Earnings (month-to-month change)
Actual: +0.315% (+$3.46)


Average Weekly Earnings (year-on-year change)
Actual: +4.56% (+$48.03)

Civilian Labor Force Participation Rate: 62.2%
Previous Month: 62.4%
12 Months Previous: 61.7%

Average Workweek
Predicted: 34.7 hours
Actual: 34.6 hours

Economist, academics, central bankers and investors pay very close attention to the monthly Employment Situation report as it offers penetrating insight as to the current and near-future state of the overall U.S. economy. If a) Americans are earning more money and b) the economy is creating new jobs, this typically translates to more money being pumped into the economy (and vice versa.)

The "predicted" figure is what economists were expecting, while the "actual" is the true or real figure.

===================

From Today's Report:

"...In April, 7.7% of employed persons teleworked because of the coronavirus pandemic, down from 10% in the prior month. These data refer to employed persons who teleworked or worked at home for pay at some point in the 4 weeks preceding the survey specifically because of the pandemic.

In April, 1.7 million persons reported that they had been unable to work because their employer closed or lost business due to the pandemic -- that is, they did not work at all or worked fewer hours at some point in the 4 weeks preceding the survey due to the pandemic. This measure is down from 2.5 million in the previous month. Among those who reported in April that they were unable to work because of pandemic-related closures or lost business, 19% received at least some pay from their employer for the hours not worked, little different from the prior month.

Among those not in the labor force in April, 586,000 persons were prevented from looking for work due to the pandemic, down from 874,000 in the prior month. (To be counted as unemployed, by definition, individuals must be either actively looking for work or on temporary layoff.)

Total nonfarm payroll employment rose by 428,000 in April. Job gains were widespread, with the largest gains occurring in leisure and hospitality, in
manufacturing, and in transportation and warehousing. However, nonfarm employment is down by 1.2 million, or 0.8%, from its pre-pandemic level in February 2020.

The change in total nonfarm payroll
employment for February was revised down by 36,000, from +750,000 to +714,000, and the change for March was revised down by 3,000, from +431,000 to +428,000. With these revisions, employment in February and March combined is 39,000 lower than previously reported..."
===================
 

CHART: Nonfarm Payroll Employment - April 2022 Update

CHART: Nonfarm Payroll Employment
April 2022 Update


===================
 
 
CHART: U-3 (Headline) Unemployment Rate - April 2022 Update

CHART: U-3 (Headline) Unemployment Rate
April 2022 Update

 
   ===================

 * =  The U-6 Unemployment Rate is defined as:

"Total unemployed, plus all persons marginally attached to the labor force, plus total employed part time for economic reasons, as a percent of the civilian labor force plus all persons marginally attached to the labor force."

===================


===================


Labels: , , , , , , , , , , , , , , , , , , ,


--> www.FedPrimeRate.com Privacy Policy <--

>  SITEMAP  <

bing

bing


SCAMS!

FedPrimeRate.com
Entire Website © 2024 FedPrimeRate.comSM


This website is neither affiliated nor associated with The United States Federal Reserve
in any way. Information in this website is provided for educational purposes only. The owners
of this website make no warranties with respect to any and all content contained within this
website. Consult a financial professional before making important decisions related to any
investment or loan product, including, but not limited to, business loans, personal loans,
education loans, first or second mortgages, credit cards, car loans or any type of insurance.