Consumer Price Index (CPI) for July 2019
Earlier this morning, the Labor Department's Bureau of Labor Statistics released the Consumer Price Index (CPI) for July 2019:
=========================================
Predicted: +0.2%
Actual: +0.3%
=========================================
Below is the CPI when food and energy are removed, also known as core CPI:
Predicted: +0.2%
Actual: +0.3%
=========================================
The above, yellow-highlighted figures represent the seasonally adjusted, month-to-month change in prices for a specific group of goods and services that consumers buy, and is, therefore, a very important part of the overall inflation picture for the country.
The "predicted" figure is what economists were expecting, while the "actual" is the true or real figure.
General categories that constitute the CPI are:
=========================================
From Today's Report:
=========================================
=========================================
=========================================
=========================================
Predicted: +0.2%
Actual: +0.3%
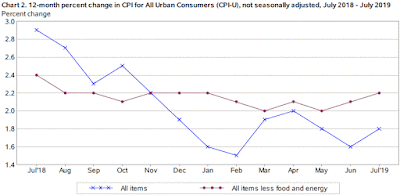
- Change From 12 Months Previous: +1.8%
=========================================
Below is the CPI when food and energy are removed, also known as core CPI:
Predicted: +0.2%
Actual: +0.3%
- Change From 12 Months Previous: +2.2%
=========================================
The above, yellow-highlighted figures represent the seasonally adjusted, month-to-month change in prices for a specific group of goods and services that consumers buy, and is, therefore, a very important part of the overall inflation picture for the country.
The "predicted" figure is what economists were expecting, while the "actual" is the true or real figure.
General categories that constitute the CPI are:
- Healthcare
- Housing
- Clothing
- Communications
- Education
- Transportation
- Food and Beverages
- Recreation
- Miscellaneous Goods and Services (grooming expenses, etc.)
=========================================
From Today's Report:
"...Increases in the indexes for gasoline and shelter were the major factors in the seasonally adjusted all items monthly increase. The energy index rose in July as the gasoline and electricity indexes increased, though the natural gas index declined. The index for food was unchanged for the second month in a row, as a decline in the food at home index was offset by an increase in the food away from home index.
The index for all items less food and energy rose 0.3 in July, the same increase as in June. The July rise was broad-based, with increases in the indexes for shelter, medical care, airline fares, household furnishings and operations, apparel, and personal care all contributing to the increase. The index for new vehicles was one of the few to decline in July..."
=========================================
=========================================
Labels: consumer_price_index, consumers, cpi, disinflation, hard_data, inflation
|
--> www.FedPrimeRate.com Privacy Policy <--
CLICK HERE to JUMP to the TOP of THIS PAGE > SITEMAP < |


0 Comments:
Post a Comment
<< Home