Industrial Production + Manufacturing + Capacity Utilization During November 2021
The Industrial Production, Manufacturing and Capacity Utilization numbers for November 2021 were released by the Federal Reserve this morning:
Industrial Production:
Predicted: +1.0%
Actual: +0.5%
Manufacturing:
Predicted: +1.0%
Actual: +0.7%
The yellow-highlighted percentages represent the month-to-month change in manufacturing, and physical output from mining operations, utility plants and factories for the entire United States.
Capacity Utilization Rate:
Predicted: 77.0%
Actual: 76.8%
The Capacity Utilization Rate represents the use of available resources at mining operations, utility plants and factories for the entire United States last month.
The "predicted" figures are what economists were expecting, while the "actual" is the true or real figure.
From Today's Report:
"...Industrial production rose 0.5 percent in November. The indexes for both manufacturing and mining increased 0.7 percent, while the index for utilities decreased 0.8 percent.
At 102.3 percent of its 2017 average, total industrial production in November was 5.3 percent above its year-earlier level and at its highest reading since September 2019. Capacity utilization for the industrial sector increased 0.3 percentage point to 76.8 percent; even so, it was 2.8 percentage points below its long-run (1972–2020) average. ..."
===============
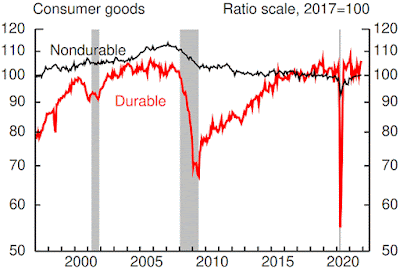
CHART: Industrial Production - Consumer Goods
Labels: capacity_utilization_rate, Coronavirus, COVID-19, COVID19, hard_data, industrial_production, manufacturing, Pandemic
|
--> www.FedPrimeRate.com Privacy Policy <--
CLICK HERE to JUMP to the TOP of THIS PAGE > SITEMAP < |


0 Comments:
Post a Comment
<< Home