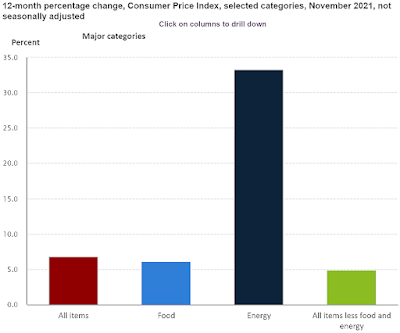
Consumer Price Index (CPI) for November 2021
Earlier this morning, the Labor Department's Bureau of Labor Statistics released the Consumer Price Index (CPI) for November 2021:
=========================================
The above, yellow-highlighted figures represent the seasonally unadjusted, month-to-month change in prices for a specific group of goods and services that consumers buy, and is, therefore, a very important part of the overall inflation picture for the country.
The "predicted" figure is what economists were expecting, while the "actual" is the true or real figure.
General categories that constitute the CPI are:
=========================================
CPI During November 2021: 277.948
=========================================
Predicted: +1.0%
Actual: +0.491% (+1.359 points)
- Change From 12 Months Previous: +6.809% (+17.719 points)
=========================================
The above, yellow-highlighted figures represent the seasonally unadjusted, month-to-month change in prices for a specific group of goods and services that consumers buy, and is, therefore, a very important part of the overall inflation picture for the country.
The "predicted" figure is what economists were expecting, while the "actual" is the true or real figure.
General categories that constitute the CPI are:
- Healthcare
- Housing
- Clothing
- Communications
- Education
- Transportation
- Food and Beverages
- Recreation
- Miscellaneous Goods and Services (grooming expenses, etc.)
=========================================
=========================================
CPI During November 2020: 260.229
=========================================
=========================================
Labels: consumer_price_index, consumers, Coronavirus, COVID-19, COVID19, cpi, disinflation, hard_data, inflation, Pandemic
|
--> www.FedPrimeRate.com Privacy Policy <--
CLICK HERE to JUMP to the TOP of THIS PAGE > SITEMAP < |


0 Comments:
Post a Comment
<< Home