.comment-link {margin-left:.6em;}

Economy

Economic Data (USA)

Saturday, March 16, 2024

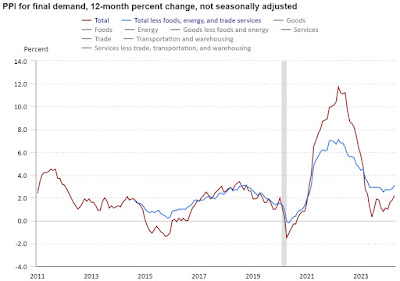
Producer Price Index - Final Demand (PPI-FD) February 2024

The Producer Price Index - Final Demand (PPI-FD) for February 2024 was released this morning:

Previous Month: +0.3%
Actual: +0.6%

Change from 12 months previous:  +1.6%

=============

Below is the PPI-FD when food, energy and trade services are removed:

Previous Month: +0.6%
Actual: +0.4%

Change from 12 months previous:  +2.8%

=============

The above, yellow-highlighted percentages represent the month-to-month change in prices received by domestic producers of goods and services, for goods, services and construction in the United States, for final demand.

Final Demand = personal consumption (consumers), exports, government purchases and capital investment.

The PPI-FD is released by the Labor Department's Bureau of Labor Statistics.

The "predicted" figure is what economists were expecting, while the "actual" is the true or real figure.


 ==============

CHART: Producer Price Index   Final Demand (PPI-FD) 12-Month Percent Change - February 2024 Update
CHART: Producer Price Index
  Final Demand (PPI-FD)
12-Month Percent Change
February 2024 Update

Labels: , , , , , , , , ,


--> www.FedPrimeRate.com Privacy Policy <--

>  SITEMAP  <

Saturday, February 17, 2024

Producer Price Index - Final Demand (PPI-FD) for January 2024

The Producer Price Index - Final Demand (PPI-FD) for January 2024 was released this morning:

Previous Month: -0.1%
Actual: +0.3%

Change from 12 months previous:  +0.9%

=============

Below is the PPI-FD when food, energy and trade services are removed:

Previous Month: +0.2%
Actual: +0.6%

Change from 12 months previous:  +2.6%

=============

The above, yellow-highlighted percentages represent the month-to-month change in prices received by domestic producers of goods and services, for goods, services and construction in the United States, for final demand.

Final Demand = personal consumption (consumers), exports, government purchases and capital investment.

The PPI-FD is released by the Labor Department's Bureau of Labor Statistics.

The "predicted" figure is what economists were expecting, while the "actual" is the true or real figure.


 ==============

CHART: Producer Price Index   Final Demand (PPI-FD) 12-Month Percent Change - January 2024 Update

CHART: Producer Price Index
  Final Demand (PPI-FD)
12-Month Percent Change
January 2024 Update

Labels: , , , , , , , , ,


--> www.FedPrimeRate.com Privacy Policy <--

>  SITEMAP  <

Friday, April 28, 2023

Employment Cost Index for Q1, 2023

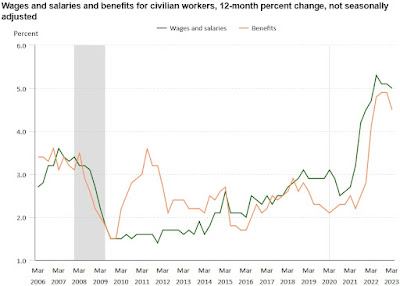
Employment Cost Index (ECI) for the first quarter of 2023 was released by The Labor Department's Bureau of Labor Statistics this morning:

Predicted: +1.1%
Actual: +1.2%


  • Reading from previous quarter: +1.1%
     
  • Change from 12 months previous (Y/Y): +4.8%


The yellow-highlighter figure represents the seasonally adjusted, quarter-to-quarter change for the ECI, which is the Labor Department's broadest measure of employee-compensation costs, and includes wages, salaries and benefits.

==================

  • Wages and Salaries: +1.2%

  • Change from 12 months previous (Y/Y): +5.0% 

==================

  • Benefits: +1.2%

  • Change from 12 months previous (Y/Y): +4.5% 

==================


From the Labor Department website:


"...The Employment Cost Index (ECI) measures the change in the cost of labor, free from the influence of employment shifts among occupations and industries..."

==================


CHART: Wages and Salaries and Benefits for Civilian Workers 12 Month Percent Change Not Seasonally Adjusted - First Quarter, 2023 UPDATE
CHART: Wages and Salaries and Benefits
for Civilian Workers
12 Month Percent Change
Not Seasonally Adjusted
 First Quarter, 2023 UPDATE

==================


==================

Labels: , , , , , , , , , , ,


--> www.FedPrimeRate.com Privacy Policy <--

>  SITEMAP  <

Thursday, April 27, 2023

Gross Domestic Product (GDP): First Estimate for Q1, 2023

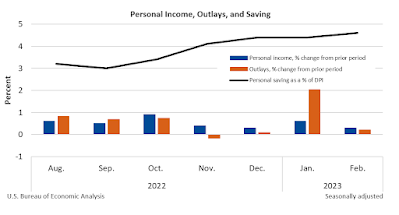
Earlier this morning, the Commerce Department's Bureau of Economic Analysis (BEA) released its first estimate for U.S. Real Gross Domestic Product (GDP) for the first quarter of 2023:

============

Predicted: 1.5%

  • Actual: +1.1%

The yellow-highlighted percentage represents the first estimate of the quarter-to-quarter change for Real Gross Domestic Product for the entire United States.

============
 
 
============

The GDP is a very broad measure of economic activity for the entire United States, covering all sectors of the economy. The Commerce Department defines real GDP as, "the output of goods and services produced by labor and property located in the United States."

============

CHART: Personal Income + Outlays + Saving - Q1 2023 UPDATE
CHART: Personal Income
+ Outlays + Saving - Q1 2023 UPDATE

Labels: , , , , , , , , , , , ,


--> www.FedPrimeRate.com Privacy Policy <--

>  SITEMAP  <

Friday, April 14, 2023

Producer Price Index - Final Demand (PPI-FD) for March 2023

The Producer Price Index - Final Demand (PPI-FD) for March 2023 was released this morning:

Previous Month: -0.1%
Actual: -0.5%

Change from 12 months previous:  +2.7%

=============

Below is the PPI-FD when food, energy and trade services are removed:

Previous Month: +0.2%
Actual: +0.1%

Change from 12 months previous:  +3.6%

=============

The above, yellow-highlighted percentages represent the month-to-month change in prices received by domestic producers of goods and services, for goods, services and construction in the United States, for final demand.

Final Demand = personal consumption (consumers), exports, government purchases and capital investment.

The PPI-FD is released by the Labor Department's Bureau of Labor Statistics.

The "predicted" figure is what economists were expecting, while the "actual" is the true or real figure.


 ==============

 CHART: Producer Price Index - Final Demand (PPI-FD) - March 2023 Update

CHART: Producer Price Index
 Final Demand (PPI-FD)
 March 2023 Update

==============

Labels: , , , , , , , , , , ,


--> www.FedPrimeRate.com Privacy Policy <--

>  SITEMAP  <

Tuesday, December 20, 2022

Housing Starts During November 2022

The U.S. Commerce Department this morning released its Housing Starts report for November 2022:

---------------------------------------------------

Housing Starts:
Predicted: 1,500,000
Actual: 1,427,000

Change From Previous Month: -0.49% (-7,000 New Units)

  • Change From One Year Previous: -16.35% (-279,000 New Units)

---------------------------------------------------

Building Permits:
Predicted: 1,400,000
Actual: 1,342,000

Change From Previous Month: -11.24% (-170,000 New Permits)

  • Change From One Year Previous: -22.38%  (-387,000 New Permits)

----------------------------------------------------

Housing Starts: The top, yellow-highlighted figure is a measure of initial construction of single and multi-family residential units in the United States for the indicated month. Seasonally adjusted annual rate. The "predicted" figure is what economists were expecting, while the "actual" is the true or real figure.

If you're wondering about the demand for new homes in the United States, or about the American residential construction industry in general, then you should pay attention to the monthly Housing Starts report. This report also offers insight into specific types of consumer spending: when housing starts are up, demand for the stuff that a consumer would purchase for a new home (large appliances, consumer electronics, furniture, etc.) tends to also rise -- and vice versa.


=================

CHART: Housing Starts + Building Permits + Completions November 2022 Update
CHART: Housing Starts
+ Building Permits
+ Completions
November 2022 Update


=================


================


Labels: , , , , , , , , , ,


--> www.FedPrimeRate.com Privacy Policy <--

>  SITEMAP  <

Friday, December 16, 2022

Consumer Price Index (CPI) for November 2022

Earlier this morning, the Labor Department's Bureau of Labor Statistics released the Consumer Price Index (CPI) for  November 2022:


=========================================

CPI During November 2022: 297.711

=========================================


Predicted: FLAT
Actual: -0.1% (-0.301 points)

  • Change From 12 Months Previous: +7.11% (+19.763 points)

=========================================

The above, yellow-highlighted figures represent month-to-month change (not seasonally adjusted) in prices for a specific group of goods and services that consumers buy, and is, therefore, a very important part of the overall inflation picture for the country.

The "predicted" figure is what economists were expecting, while the "actual" is the true or real figure.

General categories that constitute the CPI are:

  • Healthcare
  • Housing
  • Clothing
  • Communications
  • Education
  • Transportation
  • Food and Beverages
  • Recreation
  • Miscellaneous Goods and Services (grooming expenses, etc.)

=========================================

CPI During November 2021: 277.948

=========================================


=========================================


Labels: , , , , , , , , , , ,


--> www.FedPrimeRate.com Privacy Policy <--

>  SITEMAP  <

Thursday, December 01, 2022

PCE Price Index + Personal Income + Consumer Spending Report for October 2022

The Commerce Department's Bureau of Economic Analysis (BEA) released its report on The PCE Price Index, Consumer Spending and Personal Income for October 2022:

=============

Consumer Spending (Personal Consumption Expenditures)

Predicted: +0.8

  • Actual: +0.8%
  • Actual (2012 Chained* Dollars): +0.5%
=============

Personal Income

Predicted: +0.5
  • Actual: +0.7%
=============

  • Disposable Personal Income, Current Dollars: +0.7%
  • Disposable Personal Income (2012 Chained* Dollars): +0.4%

=============

The above highlighted percentages represent the month-to-month change in Consumer Spending (aka Personal Consumption Expenditures), Personal Income and Disposable Personal Income for the entire United States.

=============

Personal Consumption Expenditures (PCE) Price Index
Predicted: +0.3%
Actual: +0.3% 

  • Change from 12 months previous: +6.0%
=====================

Core PCE Price Index
( = PCE Price Index minus food and energy)
Predicted: 0.5%
Actual: +0.2%

  • Change from 12 months previous: +5.0%
=====================

The yellow-highlighted percentages represent the month-to-month change in the prices associated with domestic personal consumption.  The PCE Price Index is different from the Consumer Price Index (CPI) in that it is a very broad measure of the prices associated with domestic products and services, while the CPI measures a more limited fixed basket of goods and services.

The broad nature of the PCE Price Index is key to why it is the Federal Reserve's preferred measure of inflation.  The Federal Open Market Committee (FOMC) pays very close attention to it.

=====================

The "predicted" figures are what economists were expecting, while the "actual" figures are the true or real figure.


=====================

 =====================

*Chained dollars is a method of adjusting real dollar amounts for inflation over time, so as to allow comparison of figures from different years. The Commerce Department introduced the chained-dollar measure in 1996. Chained dollars generally reflect dollar figures computed with 2012 as the base year.


Labels: , , , , , , , , , , , , ,


--> www.FedPrimeRate.com Privacy Policy <--

>  SITEMAP  <

Job Openings and Labor Turnover Survey (JOLTS) for October 2022

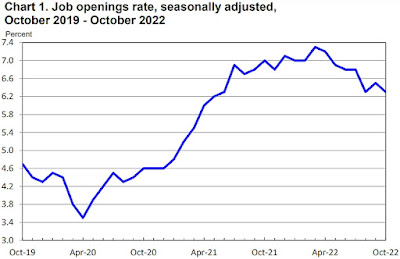
Job Openings and Labor Turnover Survey (JOLTS*) for October 2022 was released by the Labor Department this morning:

=============

Job Openings

Predicted: 10,500,000
  • Actual:    10,334,000
-------------------------
  • Previous Month (revised): 10,687,000

  • One Year Previous: 11,094,000

  • Change from one year previous: -6.85% (-760,000)


=============


Hires: 6,012,000

-----------

Quits: 4,026,000


-----------

Layoffs + Discharges: 1,387,000 


-----------

Total Separations §: 5,683,000


=============


§ = Here's How The Labor Department Defines Total Separations:


"Total separations includes quits, layoffs and discharges, and other separations. Total separations is referred to as turnover. Quits are generally voluntary separations initiated by the employee. Therefore, the quits rate can serve as a measure of workers’ willingness or ability to leave jobs. Layoffs and discharges are involuntary separations initiated by the employer. Other separations includes separations due to retirement, death, disability, and transfers to other locations of the same firm."


=============


CHART: Job Openings Rate - October 2022 UPDATE

CHART: Job Openings Rate
October 2022 UPDATE

  =============


============= 

Labels: , , , , , , , , , , , , , ,


--> www.FedPrimeRate.com Privacy Policy <--

>  SITEMAP  <

Wednesday, November 30, 2022

Crude Oil Inventories Report for Week of November 25, 2022

Crude Oil Inventories


The U.S. Crude Oil Inventories report for the week that ended on November 25, 2022 was released this morning:

-- Change from Last Week: -12,600,000 Barrels

-- Change from A Year Ago (Y/Y): -14,000,000 Barrels

-- Current U.S. Crude Oil Stocks: 419,100,000 Barrels

Diminishing crude oil inventories often translate to higher crude oil and fuel prices (and vice versa), but not always.

The report is produced by the U.S. Energy Information Administration (EIA).

Labels: , , , , , , , , , ,


--> www.FedPrimeRate.com Privacy Policy <--

>  SITEMAP  <

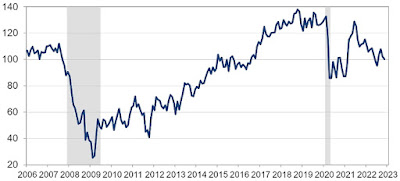
Consumer Confidence Index (CCI) for November 2022

Consumer Confidence Index® (CCI) for this month (November 2022) was released by The Conference Board® this morning:

================

Predicted: 100.0
  • Actual: 100.2

================

Previous Month (revised): 102.2

  • Change from Previous Month: -1.96% (-2.0 points)
================

The "predicted" figure is what economists were expecting, while the "actual" is the true or real figure.

From Today's Report:

"...'Consumer confidence declined again in November, most likely prompted by the recent rise in gas prices,' said Lynn Franco, Senior Director of Economic Indicators at The Conference Board. 'The Present Situation Index moderated further and continues to suggest the economy has lost momentum as the year winds down. Consumers’ expectations regarding the short-term outlook remained gloomy. Indeed, the Expectations Index is below a reading of 80, which suggests the likelihood of a recession remains elevated.'

'Inflation expectations increased to their highest level since July, with both gas and food prices as the main culprits. Intentions to purchase homes, automobiles, and big-ticket appliances all cooled. The combination of inflation and interest rate hikes will continue to pose challenges to confidence and economic growth into early 2023.'..."

Every month, The Conference Board sends a questionnaire to 5,000 U.S. households. Survey participants are polled about their feelings regarding the U.S. economy, current and future, and about their own fiscal circumstances. On average, 3,500 participants complete and return the 5-question survey.

  • The baseline "100" score for the CCI is associated with 1985 survey data.


When consumers feel good about the economy, they tend to do more spending, and vice versa.

Based in New York City, The Conference Board is a private, not-for-profit organization with a mission to, "create and disseminate knowledge about management and the marketplace to help businesses strengthen their performance and better serve society."

The CCI is usually released on the last Tuesday of the month.


================ 

 
CHART: Consumer Confidence Index (CCI) November 2022 Update
CHART: Consumer Confidence Index (CCI)
November 2022 Update

================

================


Labels: , , , , , , , , , , , ,


--> www.FedPrimeRate.com Privacy Policy <--

>  SITEMAP  <

Monday, November 28, 2022

Consumer Sentiment: Final Results for November 2022

The University of Michigan's Index of Consumer Sentiment (ICS) - Final Results for November 2022 was released today:

Predicted: 57.0
  • Actual: 56.8
=========

  • Change from Previous Month: -5.18% (-3.1 points)

  • Change from 12 Months Previous: -15.73% (-10.6 points)

=========

  • Final ICS Reading for October 2022: 59.9

  • Final ICS Reading for November 2021: 67.4

=========

From Today's Report:

"...Consumer sentiment fell 5% below October, offsetting about one-third of the gains posted since the historic low in June. Along with the ongoing impact of inflation, consumer attitudes have also been weighed down by rising borrowing costs, declining asset values, and weakening labor market expectations. Buying conditions for durables, which had markedly improved last month, decreased most sharply in November, falling back 19% to its September level on the basis of high interest rates and continued high prices Long-term business conditions declined a more modest 6%, while short-term business conditions and personal finances were essentially unchanged.

Inflation expectations were also little changed from October. The median expected year-ahead inflation rate was 4.9%, down slightly from 5.0% last month. Long run inflation expectations, currently at 3.0%, have remained in the narrow (albeit elevated) 2.9-3.1% range for 15 of the last 16 months. Uncertainty over these expectations remained at an elevated level, indicating that the general stability of these expectations may not necessarily endure..."
 =========


The ICS is derived from the following five survey questions:


  1. "We are interested in how people are getting along financially these days. Would you say that you (and your family living there) are better off or worse off financially than you were a year ago?"


  2. "Now looking ahead, do you think that a year from now you (and your family living there) will be better off financially, or worse off, or just about the same as now?"


  3. "Now turning to business conditions in the country as a whole, do you think that during the next twelve months we'll have good times financially, or bad times, or what?"


  4. "Looking ahead, which would you say is more likely: that in the country as a whole we'll have continuous good times during the next five years or so, or that we will have periods of widespread unemployment or depression, or what?"


  5. "About the big things people buy for their homes, such as furniture, a refrigerator, stove, television, and things like that. Generally speaking, do you think now is a good or bad time for people to buy major household items?"

=========


=========

The ICS uses a 1966 baseline, i.e. for 1966, the ICS = 100. So any number that is below the 1966 baseline of 100 means that the folks who were polled recently aren't as optimistic about the U.S. economy as those polled back in 1966.

The ICS is similar to the Consumer Confidence Index in that they both measure consumer attitudes and offer valuable insight into consumer spending.

=========

The "predicted" figure is what economists were expecting, while the "actual" is the true or real figure.

=========


=========


Labels: , , , , , , ,


--> www.FedPrimeRate.com Privacy Policy <--

>  SITEMAP  <

Wednesday, November 23, 2022

Crude Oil Inventories Report for Week of November 18, 2022

Crude Oil Inventories


The U.S. Crude Oil Inventories report for the week that ended on November 18, 2022 was released this morning:

-- Change from Last Week: -3,700,000 Barrels

-- Change from A Year Ago (Y/Y): -2,400,000 Barrels

-- Current U.S. Crude Oil Stocks: 431,700,000 Barrels

Diminishing crude oil inventories often translate to higher crude oil and fuel prices (and vice versa), but not always.

The report is produced by the U.S. Energy Information Administration (EIA).


Labels: , , , , , , , , , ,


--> www.FedPrimeRate.com Privacy Policy <--

>  SITEMAP  <

Thursday, November 17, 2022

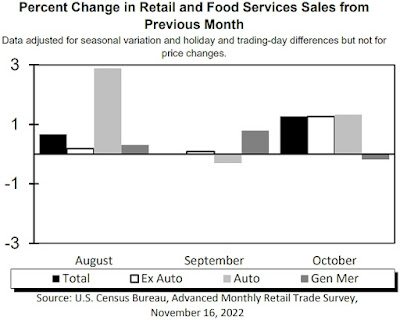
U.S. Retail And Food Services Sales Report for October 2022

The Commerce Department this morning released advance estimates of U.S. Retail and Food Services Sales for October 2022:

Predicted: +1.0%
  • Actual:  +1.272%(+$8,724,000)

The yellow-highlighted percentage above represents the month-to-month change in total sales receipts for retailers that sell durable and non-durable goods, and retailers that provide food and beverage services.

=================

  • Estimated Retail Sales During October 2022: $694,518,000,000
  • Change From 12 Months Previous: +8.27% (+$53,059,000,000)

=================
 

U.S. Retail And Food Services Sales Report for October 2022
Retail Sales for October 2022

=================

=================

Labels: , , , , , , , , , , ,


--> www.FedPrimeRate.com Privacy Policy <--

>  SITEMAP  <

Tuesday, November 15, 2022

Producer Price Index - Final Demand (PPI-FD) for October 2022

The Producer Price Index - Final Demand (PPI-FD) for October 2022 was released this morning:

Predicted: +0.4%
Actual: +0.2%

Change from 12 months previous:  +8.0%

=============

Below is the PPI-FD when food, energy and trade services are removed:

Predicted: +0.3%
Actual: +0.2%

Change from 12 months previous:  +5.4%

=============

The above, yellow-highlighted percentages represent the month-to-month change in prices received by domestic producers of goods and services, for goods, services and construction in the United States, for final demand.

Final Demand = personal consumption (consumers), exports, government purchases and capital investment.

The PPI-FD is released by the Labor Department's Bureau of Labor Statistics.

The "predicted" figure is what economists were expecting, while the "actual" is the true or real figure.


==============

Labels: , , , , , , , , , , ,


--> www.FedPrimeRate.com Privacy Policy <--

>  SITEMAP  <

Friday, November 11, 2022

Consumer Sentiment: Preliminary Results for November 2022

The University of Michigan's Index of Consumer Sentiment (ICS) - Preliminary Results for November 2022 was released today:

Predicted: 60.0
  • Actual: 54.7
=========

  • Change from Previous Month: -8.68% (-5.2 points)

  • Change from 12 Months Previous: -18.84% (-12.7 points)

=========

  • Final ICS Reading for October 2022: 59.9

  • Final ICS Reading for November 2021: 67.4

=========

From Today's Report:

"...Consumer sentiment fell about 9% below October, erasing about half of the gains that had been recorded since the historic low in June. All components of the index declined from last month, but buying conditions for durables, which had markedly improved last month, decreased most sharply in November, falling back 21% on the basis of high interest rates as well as continued high prices. Overall, declines in sentiment were observed across the distribution of age, education, income, geography, and political affiliation, showing that the recent improvements in sentiment were tentative. Instability in sentiment is likely to continue, a reflection of uncertainty over both global factors and the eventual outcomes of the election.

Inflation expectations are little changed. The median expected year-ahead inflation rate was 5.1%, up from 5.0% last month. Long run inflation expectations, currently at 3.0%, have remained in the narrow (albeit elevated) 2.9-3.1% range for 15 of the last 16 months..."

=========

CHART: High Interest Rate Reasons for Poor Buying Conditions and Interest Rates

CHART: High Interest Rate Reasons for
Poor Buying Conditions and Interest Rates
 
 =========


The ICS is derived from the following five survey questions:


  1. "We are interested in how people are getting along financially these days. Would you say that you (and your family living there) are better off or worse off financially than you were a year ago?"


  2. "Now looking ahead, do you think that a year from now you (and your family living there) will be better off financially, or worse off, or just about the same as now?"


  3. "Now turning to business conditions in the country as a whole, do you think that during the next twelve months we'll have good times financially, or bad times, or what?"


  4. "Looking ahead, which would you say is more likely: that in the country as a whole we'll have continuous good times during the next five years or so, or that we will have periods of widespread unemployment or depression, or what?"


  5. "About the big things people buy for their homes, such as furniture, a refrigerator, stove, television, and things like that. Generally speaking, do you think now is a good or bad time for people to buy major household items?"

=========


=========

The ICS uses a 1966 baseline, i.e. for 1966, the ICS = 100. So any number that is below the 1966 baseline of 100 means that the folks who were polled recently aren't as optimistic about the U.S. economy as those polled back in 1966.

The ICS is similar to the Consumer Confidence Index in that they both measure consumer attitudes and offer valuable insight into consumer spending.

=========

The "predicted" figure is what economists were expecting, while the "actual" is the true or real figure.

=========


=========


Labels: , , , , , , ,


--> www.FedPrimeRate.com Privacy Policy <--

>  SITEMAP  <

Consumer Price Index (CPI) for October 2022

Earlier this morning, the Labor Department's Bureau of Labor Statistics released the Consumer Price Index (CPI) for October 2022:


=========================================

CPI During October 2022: 298.012

=========================================


Predicted: +0.6%
Actual: +0.406% (+1.204 points)

  • Change From 12 Months Previous: +7.745% (+21.423 points)

=========================================

The above, yellow-highlighted figures represent month-to-month change (not seasonally adjusted) in prices for a specific group of goods and services that consumers buy, and is, therefore, a very important part of the overall inflation picture for the country.

The "predicted" figure is what economists were expecting, while the "actual" is the true or real figure.

General categories that constitute the CPI are:

  • Healthcare
  • Housing
  • Clothing
  • Communications
  • Education
  • Transportation
  • Food and Beverages
  • Recreation
  • Miscellaneous Goods and Services (grooming expenses, etc.)

=========================================

CPI During October 2021: 276.589

=========================================


=========================================


Labels: , , , , , , , , , , ,


--> www.FedPrimeRate.com Privacy Policy <--

>  SITEMAP  <

Thursday, November 10, 2022

New Unemployment Insurance Claims for The Week of November 5, 2022

Jobless Claims
Jobless Claims

Earlier today, the Labor Department released its weekly report on New Jobless Insurance Claims for the week that ended on November 5, 2022:

====================

Predicted: 230,000

  • Actual: 225,000
====================

The yellow-highlighted figure represents the number of first-time claims for unemployment benefits for the entire United States. The "predicted" figure is what economists were expecting, while the "actual" is the true or real figure.

  • Previous Week (revised): 218,000
  • 4-Week Moving Average: 218,750

====================

From Today's Report

"...The highest insured unemployment rates in the week ending October 22 were in Puerto Rico (1.9), California (1.8), New Jersey (1.8), Alaska (1.6), New York (1.3), Massachusetts (1.2), Rhode Island (1.2), Nevada (1.1), and Oregon (1.1).

The largest increases in initial claims for the week ending October 29 were in California (+1,989), Oregon (+1,541), Washington (+693), Illinois (+457), and Minnesota (+456), while the largest decreases were in Florida (-1,534), Kentucky (-1,007), North Carolina (-659), Arkansas (-517), and South Carolina (-471)..."


====================


====================


Labels: , , , , , , , , , , ,


--> www.FedPrimeRate.com Privacy Policy <--

>  SITEMAP  <

Wednesday, November 09, 2022

Crude Oil Inventories Report for Week of November 4, 2022

Crude Oil Inventories


The U.S. Crude Oil Inventories report for the week that ended on November 4, 2022 was released this morning:

-- Change from Last Week: +3,900,000 Barrels

-- Change from A Year Ago (Y/Y): +5,700,000 Barrels

-- Current U.S. Crude Oil Stocks: 440,800,000 Barrels

Diminishing crude oil inventories often translate to higher crude oil and fuel prices (and vice versa), but not always.

The report is produced by the U.S. Energy Information Administration (EIA).

Labels: , , , , , , , , , ,


--> www.FedPrimeRate.com Privacy Policy <--

>  SITEMAP  <

Friday, November 04, 2022

Employment Situation Report for October 2022

Employment Situation Report for October 2022 was released by The Department of Labor's Bureau of Labor Statistics this morning:

Nonfarm Payrolls (month-to-month change)
Actual: +261,000
Previous Month (Revised): 315,000
One Year Previous: 677,000

U-3 Unemployment Rate (Headline)
Actual: 3.7%
Previous Month: 3.5%
12 Months Previous: 4.6%

U-6 Unemployment Rate*
Actual: 6.8%
Previous Month: 6.7%
12 Months Previous: 8.2%

Average Hourly Earnings (month-to-month change)
Predicted: +0.3%
Actual: +0.37% (+$0.12)

Average Hourly Earnings (year-on-year change)
Predicted: +3.5%
Actual: +4.73% (+$1.47)

Average Weekly Earnings (month-to-month change)
Actual: +0.37% (+$4.14)


Average Weekly Earnings (year-on-year change)
Actual: +3.82% (+$41.38)

Civilian Labor Force Participation Rate: 62.2%
Previous Month: 62.3%
12 Months Previous: 61.7%

Average Workweek
Predicted: 34.5 hours
Actual: 34.5 hours

Economist, academics, central bankers and investors pay very close attention to the monthly Employment Situation report as it offers penetrating insight as to the current and near-future state of the overall U.S. economy. If a) Americans are earning more money and b) the economy is creating new jobs, this typically translates to more money being pumped into the economy (and vice versa.)

The "predicted" figure is what economists were expecting, while the "actual" is the true or real figure.


===================
 

CHART: U-3 Unemployment Rate October 2022 Update

CHART: U-3 Unemployment Rate
October 2022 Update


   ===================

 * =  The U-6 Unemployment Rate is defined as:

"Total unemployed, plus all persons marginally attached to the labor force, plus total employed part time for economic reasons, as a percent of the civilian labor force plus all persons marginally attached to the labor force."

===================


=================== 


Labels: , , , , , , , , , , , , , , , , , , ,


--> www.FedPrimeRate.com Privacy Policy <--

>  SITEMAP  <

bing

bing

www.FedPrimeRate.com
Entire Website © 2024 FedPrimeRate.comSM


This website is neither affiliated nor associated with The United States Federal Reserve
in any way. Information in this website is provided for educational purposes only. The owners
of this website make no warranties with respect to any and all content contained within this
website. Consult a financial professional before making important decisions related to any
investment or loan product, including, but not limited to, business loans, personal loans,
education loans, first or second mortgages, credit cards, car loans or any type of insurance.