.comment-link {margin-left:.6em;}

Economy

Economic Data (USA)

Friday, April 05, 2024

Employment Situation Report for March 2024

Employment Situation Report for March 2024 was released by The Department of Labor's Bureau of Labor Statistics this morning:

Nonfarm Payrolls (month-to-month change)
Actual: +303,000
Previous Month (Revised): 270,000
One Year Previous: 146,000

U-3 Unemployment Rate (Headline)
Actual: 3.8%
Previous Month: 3.9%
12 Months Previous: 3.5%

U-6 Unemployment Rate*
Actual: 7.3%
Previous Month: 7.3%
12 Months Previous: 6.7%

Average Hourly Earnings (month-to-month change)
Predicted: +0.4%
Actual: +0.35% (+$0.12)

Average Hourly Earnings (year-on-year change)
Predicted: +4.1%
Actual: +4.14% (+$1.38)

Average Weekly Earnings (month-to-month change)
Actual: +0.64% (+$7.59)


Average Weekly Earnings (year-on-year change)
Actual: +4.14% (+$47.48)

Civilian Labor Force Participation Rate: 62.7%
Previous Month: 62.5%
12 Months Previous: 62.6%

Average Workweek
Predicted: 34.4 hours
Actual: 34.4 hours

Economist, academics, central bankers and investors pay very close attention to the monthly Employment Situation report as it offers penetrating insight as to the current and near-future state of the overall U.S. economy. If a) Americans are earning more money and b) the economy is creating new jobs, this typically translates to more money being pumped into the economy (and vice versa.)

The "predicted" figure is what economists were expecting, while the "actual" is the true or real figure.

===================
 
CHART: Persons Not In The Labor Force Who Want A Job, Seasonally Adjusted - March 2004 thru March 2024

CHART: Persons NOT In The Labor Force
Who Want A Job, Seasonally Adjusted
March 2004 thru March 2024

   ===================

 * =  The U-6 Unemployment Rate is defined as:

"Total unemployed, plus all persons marginally attached to the labor force, plus total employed part time for economic reasons, as a percent of the civilian labor force plus all persons marginally attached to the labor force."

===================


=================== 

Labels: , , , , , , , , , , , , , , , , , , ,


--> www.FedPrimeRate.com Privacy Policy <--

>  SITEMAP  <

Saturday, March 09, 2024

Employment Situation Report for February 2024

Employment Situation Report for February 2024 was released by The Department of Labor's Bureau of Labor Statistics this morning:

Nonfarm Payrolls (month-to-month change)
Actual: +275,000
Previous Month (Revised): 229,000
One Year Previous: 287,000

U-3 Unemployment Rate (Headline)
Actual: 3.9%
Previous Month: 3.7%
12 Months Previous: 3.6%

U-6 Unemployment Rate*
Actual: 7.3%
Previous Month: 7.2%
12 Months Previous: 6.8%

Average Hourly Earnings (month-to-month change)
Predicted: +0.4%
Actual: +0.145% (+$0.05)

Average Hourly Earnings (year-on-year change) 
Predicted: +4.3%
Actual: +4.28% (+$1.42)

Average Weekly Earnings (month-to-month change)
Actual: +0.44% (+$5.17)


Average Weekly Earnings (year-on-year change)
Actual: +3.68% (+$42.07)

Civilian Labor Force Participation Rate: 62.5%
Previous Month: 62.5%
12 Months Previous: 62.5%

Average Workweek
Predicted: 34.3 hours
Actual: 34.3 hours

Economist, academics, central bankers and investors pay very close attention to the monthly Employment Situation report as it offers penetrating insight as to the current and near-future state of the overall U.S. economy. If a) Americans are earning more money and b) the economy is creating new jobs, this typically translates to more money being pumped into the economy (and vice versa.)

The "predicted" figure is what economists were expecting, while the "actual" is the true or real figure.

===================

CHART: Month-to-Month Change In Nonfarm Payroll Employment - February 2022 thru February 2024

CHART: Month-to-Month Change
In Nonfarm Payroll Employment
February 2022 thru February 2024

   ===================

 * =  The U-6 Unemployment Rate is defined as:

"Total unemployed, plus all persons marginally attached to the labor force, plus total employed part time for economic reasons, as a percent of the civilian labor force plus all persons marginally attached to the labor force."

===================


=================== 


Labels: , , , , , , , , , , , , , , , , , , ,


--> www.FedPrimeRate.com Privacy Policy <--

>  SITEMAP  <

Saturday, February 03, 2024

Employment Situation Report for January 2024

Employment Situation Report for January 2024 was released by The Department of Labor's Bureau of Labor Statistics this morning:

Nonfarm Payrolls (month-to-month change)
Actual: +353,000
Previous Month (Revised): 333,000
One Year Previous: 482,000

U-3 Unemployment Rate (Headline)
Actual: 3.7%
Previous Month: 3.7%
12 Months Previous: 3.4%

U-6 Unemployment Rate*
Actual: 7.2%
Previous Month: 7.1%
12 Months Previous: 6.7%

Average Hourly Earnings (month-to-month change)
Predicted: +0.4%
Actual: +0.553% (+$0.19)

Average Hourly Earnings (year-on-year change)
Predicted: +4.3%
Actual: +4.48% (+$1.48)

Average Weekly Earnings (month-to-month change)
Actual: -0.03% (-$0.39)


Average Weekly Earnings (year-on-year change)
Actual: +2.97% (+$33.94)

Civilian Labor Force Participation Rate: 62.5%
Previous Month: 62.5%
12 Months Previous: 62.4%

Average Workweek
Predicted: 34.4 hours
Actual: 34.1 hours

Economist, academics, central bankers and investors pay very close attention to the monthly Employment Situation report as it offers penetrating insight as to the current and near-future state of the overall U.S. economy. If a) Americans are earning more money and b) the economy is creating new jobs, this typically translates to more money being pumped into the economy (and vice versa.)

The "predicted" figure is what economists were expecting, while the "actual" is the true or real figure.

===================

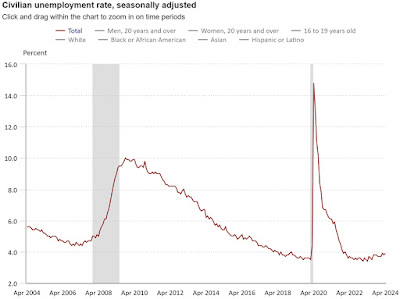
CHART: Unemployment Rate - January 2024 UPDATE

CHART: Unemployment Rate
 January 2024 UPDATE

   ===================

 * =  The U-6 Unemployment Rate is defined as:

"Total unemployed, plus all persons marginally attached to the labor force, plus total employed part time for economic reasons, as a percent of the civilian labor force plus all persons marginally attached to the labor force."

===================


===================  

Labels: , , , , , , , , , , , , , , , , , ,


--> www.FedPrimeRate.com Privacy Policy <--

>  SITEMAP  <

Saturday, November 04, 2023

Employment Situation Report for October 2023

Employment Situation Report for October 2023 was released by The Department of Labor's Bureau of Labor Statistics this morning:

Nonfarm Payrolls (month-to-month change)
Actual: +150,000
Previous Month (Revised): 297,000
One Year Previous: 324,000

U-3 Unemployment Rate (Headline)
Actual: 3.9%
Previous Month: 3.8%
12 Months Previous: 3.7%

U-6 Unemployment Rate*
Actual: 7.2%
Previous Month: 7.0%
12 Months Previous: 6.7%

Average Hourly Earnings (month-to-month change)
Predicted: +0.4%
Actual: +0.206% (+$0.07)

Average Hourly Earnings (year-on-year change)
Predicted: +4.4%
Actual: +4.103% (+$1.34)

Average Weekly Earnings (month-to-month change)
Actual: -0.085% (-$0.99)


Average Weekly Earnings (year-on-year change)
Actual: +3.2% (+$36.16)

Civilian Labor Force Participation Rate: 62.7%
Previous Month: 62.8%
12 Months Previous: 62.2%

Average Workweek
Predicted: 34.3 hours
Actual: 34.3 hours

Economist, academics, central bankers and investors pay very close attention to the monthly Employment Situation report as it offers penetrating insight as to the current and near-future state of the overall U.S. economy. If a) Americans are earning more money and b) the economy is creating new jobs, this typically translates to more money being pumped into the economy (and vice versa.)

The "predicted" figure is what economists were expecting, while the "actual" is the true or real figure.

===================

CHART: Month-to-Month Change In Nonfarm Employment - October 2023 UPDATE
CHART: Month-to-Month Change
In Nonfarm Employment
October 2023 UPDATE
   ===================

 * =  The U-6 Unemployment Rate is defined as:

"Total unemployed, plus all persons marginally attached to the labor force, plus total employed part time for economic reasons, as a percent of the civilian labor force plus all persons marginally attached to the labor force."

===================


=================== 

Labels: , , , , , , , , , , , , , , , , , ,


--> www.FedPrimeRate.com Privacy Policy <--

>  SITEMAP  <

Wednesday, October 11, 2023

Employment Situation Report for September 2023

Employment Situation Report for September 2023 was released by The Department of Labor's Bureau of Labor Statistics this morning:

Nonfarm Payrolls (month-to-month change)
Actual: +336,000
Previous Month (Revised): 227,000
One Year Previous: 350,000

U-3 Unemployment Rate (Headline)
Actual: 3.8%
Previous Month: 3.8%
12 Months Previous: 3.5%

U-6 Unemployment Rate*
Actual: 7.0%
Previous Month: 7.1%
12 Months Previous: 6.7%

Average Hourly Earnings (month-to-month change)
Predicted: +0.4%
Actual: +0.207% (+$0.07)

Average Hourly Earnings (year-on-year change)
Predicted: +4.4%
Actual: +4.15% (+$1.35)

Average Weekly Earnings (month-to-month change)
Actual: +0.207% (+$2.41)


Average Weekly Earnings (year-on-year change)
Actual: +3.55% (+$39.93)

Civilian Labor Force Participation Rate: 62.8%
Previous Month: 62.8%
12 Months Previous: 62.3%

Average Workweek
Predicted: 34.4 hours
Actual: 34.4 hours

Economist, academics, central bankers and investors pay very close attention to the monthly Employment Situation report as it offers penetrating insight as to the current and near-future state of the overall U.S. economy. If a) Americans are earning more money and b) the economy is creating new jobs, this typically translates to more money being pumped into the economy (and vice versa.)

The "predicted" figure is what economists were expecting, while the "actual" is the true or real figure.

===================

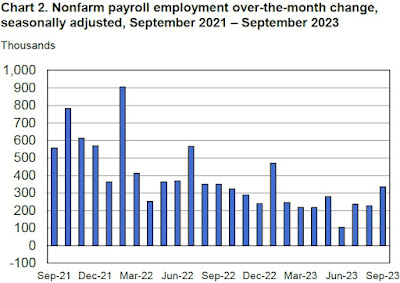
CHART: Month-to-Month Change In Nonfarm Employment - September 2023 UPDATE
CHART: Month-to-Month Change
In Nonfarm Employment
September 2023 UPDATE

   ===================

 * =  The U-6 Unemployment Rate is defined as:

"Total unemployed, plus all persons marginally attached to the labor force, plus total employed part time for economic reasons, as a percent of the civilian labor force plus all persons marginally attached to the labor force."

===================


=================== 


Labels: , , , , , , , , , , , , , , , , , ,


--> www.FedPrimeRate.com Privacy Policy <--

>  SITEMAP  <

Friday, September 01, 2023

Employment Situation Report for August 2023

Employment Situation Report for August 2023 was released by The Department of Labor's Bureau of Labor Statistics this morning:

Nonfarm Payrolls (month-to-month change)
Actual: +187,000
Previous Month (Revised): 157,000
One Year Previous: 352,000

U-3 Unemployment Rate (Headline)
Actual: 3.8%
Previous Month: 3.5%
12 Months Previous: 3.7%

U-6 Unemployment Rate*
Actual: 7.1%
Previous Month: 6.7%
12 Months Previous: 7.0%

Average Hourly Earnings (month-to-month change)
Predicted: +0.4%
Actual: +0.237% (+$0.08)

Average Hourly Earnings (year-on-year change)
Predicted: +4.4%
Actual: +4.29% (+$1.39)

Average Weekly Earnings (month-to-month change)
Actual: +0.53% (+$6.13)


Average Weekly Earnings (year-on-year change)
Actual: +3.98% (+$44.57)

Civilian Labor Force Participation Rate: 62.8%
Previous Month: 62.6%
12 Months Previous: 62.3%

Average Workweek
Predicted: 34.4 hours
Actual: 34.4 hours

Economist, academics, central bankers and investors pay very close attention to the monthly Employment Situation report as it offers penetrating insight as to the current and near-future state of the overall U.S. economy. If a) Americans are earning more money and b) the economy is creating new jobs, this typically translates to more money being pumped into the economy (and vice versa.)

The "predicted" figure is what economists were expecting, while the "actual" is the true or real figure.

===================

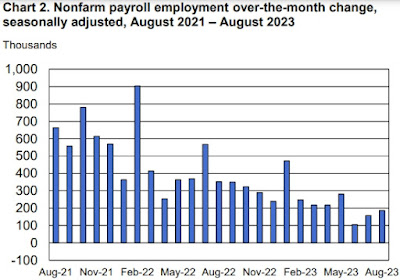
CHART: Month-to-Month Change In Nonfarm Employment - August 2023 Update
CHART: Month-to-Month Change
In Nonfarm Employment
August 2023 Update


   ===================

 * =  The U-6 Unemployment Rate is defined as:

"Total unemployed, plus all persons marginally attached to the labor force, plus total employed part time for economic reasons, as a percent of the civilian labor force plus all persons marginally attached to the labor force."

===================


=================== 

Labels: , , , , , , , , , , , , , , , , , ,


--> www.FedPrimeRate.com Privacy Policy <--

>  SITEMAP  <

Tuesday, August 22, 2023

Existing Home Sales During July 2023

The Existing Home Sales report for July 2023 was released by The National Association of Realtors® (NAR®) this morning:

======================

Previous Month: 4,160,000

  • Actual: 4,070,000
======================

  •  Change from Previous Month: -2.16% (-9,000 homes)

  •  Change from A Year Ago: -16.6% (-81,000 homes)
==========

Inventory: 1,110,000 (3.3 months supply.)

==========

The yellow-highlighted, "actual" figure above represents the preliminary, seasonally adjusted annualized sales count of existing homes, co-ops and condominiums for the indicated month. The "predicted" figure is what economists were expecting, while the "actual" is the true or real figure.

------------------------------------------------------

  • Median Price: $406,700

  • Price Change from A Year Ago: +1.93% (+$7,000)


------------------------------------------------------ 

==========


==========

From Today's Report:

"...'Two factors are driving current sales activity – inventory availability and mortgage rates,' said NAR Chief Economist Lawrence Yun. 'Unfortunately, both have been unfavorable to buyers.'

'Most homeowners continue to enjoy large wealth gains from recent years with little concern about home price declines,' Yun said. 'However, many renters are concerned as they’re facing growing affordability challenges because of high interest rates.'

According to Freddie Mac, the 30-year fixed-rate mortgage averaged 7.09% as of August 17. That’s up from 6.96% the prior week and 5.13% one year ago.
.."

==================


==================

INFOGRAPHIC: Existing Home Sales - July 2023 UPDATE

INFOGRAPHIC: Existing Home Sales
July 2023 UPDATE


==================


==================

Labels: , , , , , , , , ,


--> www.FedPrimeRate.com Privacy Policy <--

>  SITEMAP  <

Friday, August 04, 2023

Employment Situation Report for July 2023

Employment Situation Report for July 2023 was released by The Department of Labor's Bureau of Labor Statistics this morning:

Nonfarm Payrolls (month-to-month change)
Actual: +187,000
Previous Month (Revised): 185,000
One Year Previous: 568,000

U-3 Unemployment Rate (Headline)
Actual: 3.5%
Previous Month: 3.6%
12 Months Previous: 3.5%

U-6 Unemployment Rate*
Actual: 6.7%
Previous Month: 6.9%
12 Months Previous: 6.8%

Average Hourly Earnings (month-to-month change)
Predicted: +0.4%
Actual: +0.417% (+$0.14)

Average Hourly Earnings (year-on-year change)
Predicted: +4.4%
Actual: +4.361% (+$1.41)

Average Weekly Earnings (month-to-month change)
Actual: +0.125% (+$1.44)


Average Weekly Earnings (year-on-year change)
Actual: +3.46% (+$38.66)

Civilian Labor Force Participation Rate: 62.6%
Previous Month: 62.6%
12 Months Previous: 62.1%

Average Workweek
Predicted: 34.4 hours
Actual: 34.3 hours

Economist, academics, central bankers and investors pay very close attention to the monthly Employment Situation report as it offers penetrating insight as to the current and near-future state of the overall U.S. economy. If a) Americans are earning more money and b) the economy is creating new jobs, this typically translates to more money being pumped into the economy (and vice versa.)

The "predicted" figure is what economists were expecting, while the "actual" is the true or real figure.

===================

CHART: Month-to-Month Change In Nonfarm Employment - July 2023 Update
CHART: Month-to-Month Change
In Nonfarm Employment
July 2023 Update


   ===================

 * =  The U-6 Unemployment Rate is defined as:

"Total unemployed, plus all persons marginally attached to the labor force, plus total employed part time for economic reasons, as a percent of the civilian labor force plus all persons marginally attached to the labor force."

===================


=================== 

Labels: , , , , , , , , , , , , , , , , , ,


--> www.FedPrimeRate.com Privacy Policy <--

>  SITEMAP  <

Tuesday, July 11, 2023

NFIB Small Business Optimism Index for June 2023

The National Federation of Independent Business® (NFIB®) released its Small Business Optimism Index for June 2023:

=========

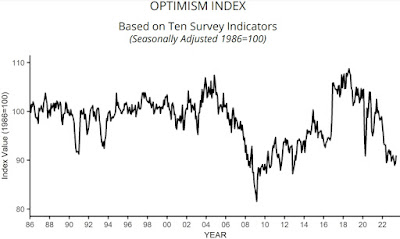
Predicted: 90.0
Actual: 91.0

  • Change from Previous Month: +1.79% (+1.6 points.)
  • Change from 12 Months Previous: +1.68% (+1.5 points.)


=========

CHART: NFIB Small Business Optimism Index - June 2023 Update

CHART: NFIB Small Business Optimism Index
June 2023 Update 

=========
 

From Today's Report:

"...'Halfway through the year, small business owners remain very pessimistic about future business conditions and their sales prospects, said NFIB Chief Economist Bill Dunkelberg. 'Inflation and labor shortages continue to be great challenges for small businesses. Owners are still raising selling prices at an inflationary level to try to pass on higher inventory, labor, and energy costs.'...'

Key Findings Include:

    -- Forty-two percent of owners reported job openings that were hard to fill, down two points from May but remaining historically very high.


    -- Small business owners expecting better business conditions over the next six months improved 10 points from May to a net negative 40%, 21 percentage points better than last June’s reading of a net negative 61%.

    -- The net percent of owners who expect real sales to be higher improved seven points from May to a net negative 14%.
.."

=========

  • The baseline "100" score is associated with 1986 survey data.
=========

The previous month's Small Business Optimism Index was 89.4.

=========

 
=========

Labels: , , , , , , , , , ,


--> www.FedPrimeRate.com Privacy Policy <--

>  SITEMAP  <

Friday, July 07, 2023

Employment Situation Report for June 2023

Employment Situation Report for June 2023 was released by The Department of Labor's Bureau of Labor Statistics this morning:

Nonfarm Payrolls (month-to-month change)
Actual: +209,000
Previous Month (Revised): 306,000
One Year Previous: 370,000

U-3 Unemployment Rate (Headline)
Actual: 3.6%
Previous Month: 3.7%
12 Months Previous: 3.6%

U-6 Unemployment Rate*
Actual: 6.9%
Previous Month: 6.7%
12 Months Previous: 6.7%

Average Hourly Earnings (month-to-month change)
Predicted: +0.3%
Actual: +0.36% (+$0.12)

Average Hourly Earnings (year-on-year change)
Predicted: +3.5%
Actual: +4.35% (+$1.40)

Average Weekly Earnings (month-to-month change)
Actual: +0.65% (+$7.47)


Average Weekly Earnings (year-on-year change)
Actual: +3.75% (+$41.72)

Civilian Labor Force Participation Rate: 62.6%
Previous Month: 62.6%
12 Months Previous: 62.2%

Average Workweek
Predicted: 34.4 hours
Actual: 34.4 hours

Economist, academics, central bankers and investors pay very close attention to the monthly Employment Situation report as it offers penetrating insight as to the current and near-future state of the overall U.S. economy. If a) Americans are earning more money and b) the economy is creating new jobs, this typically translates to more money being pumped into the economy (and vice versa.)

The "predicted" figure is what economists were expecting, while the "actual" is the true or real figure.


===================

CHART: U-3 (Official) Unemployment Rate - June 2023 Update
CHART: U-3 (Official) Unemployment Rate
June 2023 Update


   ===================

 * =  The U-6 Unemployment Rate is defined as:

"Total unemployed, plus all persons marginally attached to the labor force, plus total employed part time for economic reasons, as a percent of the civilian labor force plus all persons marginally attached to the labor force."

===================


=================== 

Labels: , , , , , , , , , , , , , , , , , ,


--> www.FedPrimeRate.com Privacy Policy <--

>  SITEMAP  <

Friday, June 02, 2023

Employment Situation Report for May 2023

Employment Situation Report for May 2023 was released by The Department of Labor's Bureau of Labor Statistics this morning:

Nonfarm Payrolls (month-to-month change)
Actual: +339,000
Previous Month (Revised): 294,000
One Year Previous: 364,000

U-3 Unemployment Rate (Headline)
Actual: 3.7%
Previous Month: 3.4%
12 Months Previous: 3.6%

U-6 Unemployment Rate*
Actual: 6.7%
Previous Month: 6.6%
12 Months Previous: 7.1%

Average Hourly Earnings (month-to-month change)
Predicted: +0.3%
Actual: +0.33% (+$0.11)

Average Hourly Earnings (year-on-year change)
Predicted: +3.5%
Actual: +4.304% (+$1.38)

Average Weekly Earnings (month-to-month change)
Actual: +0.038% (+$0.44)


Average Weekly Earnings (year-on-year change)
Actual: +3.4% (+$37.71)

Civilian Labor Force Participation Rate: 62.6%
Previous Month: 62.6%
12 Months Previous: 62.3%

Average Workweek
Predicted: 34.4 hours
Actual: 34.3 hours

Economist, academics, central bankers and investors pay very close attention to the monthly Employment Situation report as it offers penetrating insight as to the current and near-future state of the overall U.S. economy. If a) Americans are earning more money and b) the economy is creating new jobs, this typically translates to more money being pumped into the economy (and vice versa.)

The "predicted" figure is what economists were expecting, while the "actual" is the true or real figure.


===================

CHART: U-3 (Official) Unemployment Rate - May 2023 Update

CHART: U-3 (Official) Unemployment Rate
May 2023 Update


   ===================

 * =  The U-6 Unemployment Rate is defined as:

"Total unemployed, plus all persons marginally attached to the labor force, plus total employed part time for economic reasons, as a percent of the civilian labor force plus all persons marginally attached to the labor force."

===================


=================== 


Labels: , , , , , , , , , , , , , , , ,


--> www.FedPrimeRate.com Privacy Policy <--

>  SITEMAP  <

Friday, May 05, 2023

Employment Situation Report for April 2023

Employment Situation Report for April 2023 was released by The Department of Labor's Bureau of Labor Statistics this morning:

Nonfarm Payrolls (month-to-month change)
Actual: +253,000
Previous Month (Revised): 165,000
One Year Previous: 254,000

U-3 Unemployment Rate (Headline)
Actual: 3.4%
Previous Month: 3.5%
12 Months Previous: 3.6%

U-6 Unemployment Rate*
Actual: 6.6%
Previous Month: 6.7%
12 Months Previous: 7.0%

Average Hourly Earnings (month-to-month change)
Predicted: +0.3%
Actual: +0.482% (+$0.16)

Average Hourly Earnings (year-on-year change)
Predicted: +3.5%
Actual: +4.45% (+$1.42)

Average Weekly Earnings (month-to-month change)
Actual: +0.482% (+$5.50)


Average Weekly Earnings (year-on-year change)
Actual: +3.842% (+$42.46)

Civilian Labor Force Participation Rate: 62.6%
Previous Month: 62.6%
12 Months Previous: 62.2%

Average Workweek
Predicted: 34.4 hours
Actual: 34.4 hours

Economist, academics, central bankers and investors pay very close attention to the monthly Employment Situation report as it offers penetrating insight as to the current and near-future state of the overall U.S. economy. If a) Americans are earning more money and b) the economy is creating new jobs, this typically translates to more money being pumped into the economy (and vice versa.)

The "predicted" figure is what economists were expecting, while the "actual" is the true or real figure.


===================

CHART: U-3 Unemployment Rate - April 2023 Update
CHART: U-3 Unemployment Rate
April 2023 Update


   ===================

 * =  The U-6 Unemployment Rate is defined as:

"Total unemployed, plus all persons marginally attached to the labor force, plus total employed part time for economic reasons, as a percent of the civilian labor force plus all persons marginally attached to the labor force."

===================


=================== 

Labels: , , , , , , , , , , , , , , , ,


--> www.FedPrimeRate.com Privacy Policy <--

>  SITEMAP  <

Friday, April 14, 2023

Producer Price Index - Final Demand (PPI-FD) for March 2023

The Producer Price Index - Final Demand (PPI-FD) for March 2023 was released this morning:

Previous Month: -0.1%
Actual: -0.5%

Change from 12 months previous:  +2.7%

=============

Below is the PPI-FD when food, energy and trade services are removed:

Previous Month: +0.2%
Actual: +0.1%

Change from 12 months previous:  +3.6%

=============

The above, yellow-highlighted percentages represent the month-to-month change in prices received by domestic producers of goods and services, for goods, services and construction in the United States, for final demand.

Final Demand = personal consumption (consumers), exports, government purchases and capital investment.

The PPI-FD is released by the Labor Department's Bureau of Labor Statistics.

The "predicted" figure is what economists were expecting, while the "actual" is the true or real figure.


 ==============

 CHART: Producer Price Index - Final Demand (PPI-FD) - March 2023 Update

CHART: Producer Price Index
 Final Demand (PPI-FD)
 March 2023 Update

==============

Labels: , , , , , , , , , , ,


--> www.FedPrimeRate.com Privacy Policy <--

>  SITEMAP  <

Friday, March 31, 2023

PCE Price Index + Personal Income + Consumer Spending Report for February 2023

The Commerce Department's Bureau of Economic Analysis (BEA) released its report on The PCE Price Index, Consumer Spending and Personal Income for February 2023:

=============

Consumer Spending (Personal Consumption Expenditures)

Predicted: +0.2%
  • Actual: +0.2%
  • Actual (2012 Chained* Dollars): -0.1%
=============

Personal Income

Predicted: +0.3
  • Actual: +0.3%
=============

  • Disposable Personal Income, Current Dollars: +0.5%
  • Disposable Personal Income (2012 Chained* Dollars): +0.2%

=============

The above highlighted percentages represent the month-to-month change in Consumer Spending (aka Personal Consumption Expenditures), Personal Income and Disposable Personal Income for the entire United States.

=============

Personal Consumption Expenditures (PCE) Price Index
Predicted: +0.3%
Actual: +0.3% 

  • Change from 12 months previous: +5.0%
=====================

Core PCE Price Index
( = PCE Price Index minus food and energy)
Predicted: 0.3%
Actual: +0.3%

  • Change from 12 months previous: +4.6%
=====================

The yellow-highlighted percentages represent the month-to-month change in the prices associated with domestic personal consumption.  The PCE Price Index is different from the Consumer Price Index (CPI) in that it is a very broad measure of the prices associated with domestic products and services, while the CPI measures a more limited fixed basket of goods and services.

The broad nature of the PCE Price Index is key to why it is the Federal Reserve's preferred measure of inflation.  The Federal Open Market Committee (FOMC) pays very close attention to it.

=====================

The "predicted" figures are what economists were expecting, while the "actual" figures are the true or real figure.


=====================

 =====================

*Chained dollars is a method of adjusting real dollar amounts for inflation over time, so as to allow comparison of figures from different years. The Commerce Department introduced the chained-dollar measure in 1996. Chained dollars generally reflect dollar figures computed with 2012 as the base year.


Labels: , , , , , , , , , , ,


--> www.FedPrimeRate.com Privacy Policy <--

>  SITEMAP  <

Friday, January 27, 2023

PCE Price Index + Personal Income + Consumer Spending Report for December 2022

The Commerce Department's Bureau of Economic Analysis (BEA) released its report on The PCE Price Index, Consumer Spending and Personal Income for December 2022:

=============

Consumer Spending (Personal Consumption Expenditures)

Predicted: FLAT

  • Actual: -0.2%
  • Actual (2012 Chained* Dollars): -0.3%
=============

Personal Income

Predicted: +0.2
  • Actual: +0.2%
=============

  • Disposable Personal Income, Current Dollars: +0.3%
  • Disposable Personal Income (2012 Chained* Dollars): +0.2%

=============

The above highlighted percentages represent the month-to-month change in Consumer Spending (aka Personal Consumption Expenditures), Personal Income and Disposable Personal Income for the entire United States.

=============

Personal Consumption Expenditures (PCE) Price Index
Predicted: +0.1%
Actual: +0.1% 

  • Change from 12 months previous: +5.0%
=====================

Core PCE Price Index
( = PCE Price Index minus food and energy)
Predicted: 0.3%
Actual: +0.3%

  • Change from 12 months previous: +4.4%
=====================

The yellow-highlighted percentages represent the month-to-month change in the prices associated with domestic personal consumption.  The PCE Price Index is different from the Consumer Price Index (CPI) in that it is a very broad measure of the prices associated with domestic products and services, while the CPI measures a more limited fixed basket of goods and services.

The broad nature of the PCE Price Index is key to why it is the Federal Reserve's preferred measure of inflation.  The Federal Open Market Committee (FOMC) pays very close attention to it.

=====================

The "predicted" figures are what economists were expecting, while the "actual" figures are the true or real figure.


=====================

 =====================

*Chained dollars is a method of adjusting real dollar amounts for inflation over time, so as to allow comparison of figures from different years. The Commerce Department introduced the chained-dollar measure in 1996. Chained dollars generally reflect dollar figures computed with 2012 as the base year.


Labels: , , , , , , , , , , ,


--> www.FedPrimeRate.com Privacy Policy <--

>  SITEMAP  <

bing

bing

www.FedPrimeRate.com
Entire Website © 2024 FedPrimeRate.comSM


This website is neither affiliated nor associated with The United States Federal Reserve
in any way. Information in this website is provided for educational purposes only. The owners
of this website make no warranties with respect to any and all content contained within this
website. Consult a financial professional before making important decisions related to any
investment or loan product, including, but not limited to, business loans, personal loans,
education loans, first or second mortgages, credit cards, car loans or any type of insurance.