Consumer Sentiment: Preliminary Results for March 2022
The University of Michigan's Index of Consumer Sentiment (ICS) - Preliminary Results for March 2022 was released today:
Predicted: 70.0
=========
=========
From today's report:
Predicted: 70.0
- Actual: 59.7
- Change from Previous Month: -4.936% (-3.1 points)
- Change from 12 Months Previous: -29.682% (-25.2 points)
=========
- Final ICS Reading for February 2022: 62.8
- Final ICS Reading for March 2021: 84.9
=========
From today's report:
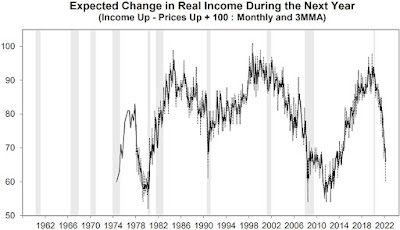
"...Consumer Sentiment continued to decline due to falling inflation-adjusted incomes, recently accelerated by rising fuel prices as a result of the Russian invasion of Ukraine. The year-ahead expected inflation rate rose to its highest level since 1981, and expected gas prices posted their largest monthly upward surge in decades. Personal finances were expected to worsen in the year ahead by the largest proportion since the surveys started in the mid-1940s. Consumers held very negative prospects for the economy, with the sole exception of the job market. Consumers were slightly more likely to anticipate declines rather than increases in the national unemployment rate. This underlying strength in jobs comes at the cost of pushing inflation even higher due to unrelenting pressures on aggregate demand and supply lines. The persistent strength in demand was a critical factor that shaped the last inflationary age from 1965 to 1982, with stagflation peaking only near its end. Current expectations are consistent with heightened pressures on wages to meet the continued growth in demand. Like the game of musical chairs, everyone continues racing around the circle of rising prices and higher wages. Although everyone knows the game will end, everyone still wants to obtain the highest income possible before they exit. The game is moderated by fiscal and monetary policies, which now favor increased federal spending and full employment over price stability, enabling ever more rounds of the game.
The greatest source of uncertainty is undoubtedly inflation and the potential impact of the Russian invasion of Ukraine. In the March survey, 24% of all respondents spontaneously mentioned the Ukraine invasion in response to questions about the economic outlook. The impact of this recognition was associated with a drop of 13.2 Index points in the Index of Consumer Expectations across all households. The difference was much larger for those who held higher inflation expectations: the difference was 33.5 Index-points on the Expectations Index for those who expected under 5% compared with over 5%..."
=========
=========
The ICS uses a 1966 baseline, i.e. for 1966, the ICS = 100. So any number that is below the 1966 baseline of 100 means that the folks who were polled recently aren't as optimistic about the U.S. economy as those polled back in 1966.
The ICS is similar to the Consumer Confidence Index in that they both measure consumer attitudes and offer valuable insight into consumer spending.
=========
The "predicted" figure is what economists were expecting, while the "actual" is the true or real figure.
=========
The ICS is derived from the following five survey questions:
- "We are interested in how people are getting along financially these
days. Would you say that you (and your family living there) are
better off or worse off financially than you were a year ago?"
- "Now looking ahead, do you think that a year from now you (and your
family living there) will be better off financially, or worse off, or
just about the same as now?"
- "Now turning to business conditions in the country as a whole, do
you think that during the next twelve months we'll have good times
financially, or bad times, or what?"
- "Looking ahead, which would you say is more likely: that in the
country as a whole we'll have continuous good times during the next five
years or so, or that we will have periods of widespread unemployment or depression, or what?"
- "About the big things people buy for their homes, such as furniture,
a refrigerator, stove, television, and things like that. Generally
speaking, do you think now is a good or bad time for people to buy major
household items?"
- Click here for more on how the ICS is calculated.
=========
The ICS uses a 1966 baseline, i.e. for 1966, the ICS = 100. So any number that is below the 1966 baseline of 100 means that the folks who were polled recently aren't as optimistic about the U.S. economy as those polled back in 1966.
The ICS is similar to the Consumer Confidence Index in that they both measure consumer attitudes and offer valuable insight into consumer spending.
=========
The "predicted" figure is what economists were expecting, while the "actual" is the true or real figure.
=========
=========
Labels: consumer_sentiment, consumers, Coronavirus, COVID-19, COVID19, Pandemic, soft_data
|
--> www.FedPrimeRate.com Privacy Policy <--
CLICK HERE to JUMP to the TOP of THIS PAGE > SITEMAP < |


0 Comments:
Post a Comment
<< Home