.comment-link {margin-left:.6em;}

Economy

Economic Data (USA)

Friday, December 27, 2024

Consumer Sentiment: Final Results for December 2024

The University of Michigan's Index of Consumer Sentiment (ICS) Final Results for December 2024 was released today:

Predicted: 75.0
  • Actual: 74.0
=========

  • Change from Previous Month: +3.06% (+2.2 points)

  • Change from 12 Months Previous: +6.17% (+4.3 points)

=========

  • Final ICS Reading for November 2024: 71.8

  • Final ICS Reading for December 2023: 69.7

=========

From Today's Report:

"...Consumer sentiment confirmed its early-month reading, rising for the fifth consecutive month and reaching its highest value since April 2024. Buying conditions exhibited a particularly strong 32% improvement, primarily due to a surge in consumers expecting future price increases for large purchases. The expectations index continued the post-election re-calibration that began last month, climbing for Republicans and declining for Democrats in December. Importantly, for Independents, expectations were essentially unchanged from the past month or so for personal finances, short-run business conditions, and long-run business conditions. Broadly speaking, consumers believe that the economy has improved considerably as inflation has slowed, but they do not feel that they are thriving; sentiment is currently about midway between the all-time low reached in June 2022 and pre-pandemic readings.

Year-ahead inflation expectations rose from 2.6% last month to 2.8% this month, the first month-over-month increase since May, but within the 2.3-3.0% range seen in the two years pre-pandemic. Long-run inflation expectations edged down from 3.2% last month to 3.0% this month, modestly elevated relative to the range of readings seen in the two years pre-pandemic.
.."
 =========
  
CHART: Consumer Sentiment: - Surge In Concerns that Prices of Major Purchases Will Rise
CHART: Consumer Sentiment - Surge In Concerns
that Prices of Major Purchases Will Rise
 
 =========


The ICS is derived from the following five survey questions:

  1. "We are interested in how people are getting along financially these days. Would you say that you (and your family living there) are better off or worse off financially than you were a year ago?"

  2. "Now looking ahead, do you think that a year from now you (and your family living there) will be better off financially, or worse off, or just about the same as now?"

  3. "Now turning to business conditions in the country as a whole, do you think that during the next twelve months we'll have good times financially, or bad times, or what?"

  4. "Looking ahead, which would you say is more likely: that in the country as a whole we'll have continuous good times during the next five years or so, or that we will have periods of widespread unemployment or depression, or what?"

  5. "About the big things people buy for their homes, such as furniture, a refrigerator, stove, television, and things like that. Generally speaking, do you think now is a good or bad time for people to buy major household items?"
=========


=========

The ICS uses a 1966 baseline, i.e. for 1966, the ICS = 100. So any number that is below the 1966 baseline of 100 means that the folks who were polled recently aren't as optimistic about the U.S. economy as those polled back in 1966.

The ICS is similar to the Consumer Confidence Index in that they both measure consumer attitudes and offer valuable insight into consumer spending.

=========

The "predicted" figure is what economists were expecting, while the "actual" is the true or real figure.

=========

=========

Labels: , , , , ,


--> www.FedPrimeRate.com Privacy Policy <--

>  SITEMAP  <

Saturday, February 17, 2024

Consumer Sentiment: Preliminary Results for February 2024

The University of Michigan's Index of Consumer Sentiment (ICS) - Preliminary Results for February 2024 was released today:

Predicted: 80.0
  • Actual: 79.6
=========

  • Change from Previous Month: +0.76% (+0.6 point)

  • Change from 12 Months Previous: +19.0% (+12.7 points)

=========

  • Final ICS Reading for January 2024: 79.0

  • Final ICS Reading for February 2023: 66.9

=========

From Today's Report:

"...Consumer sentiment was essentially unchanged from January, rising 0.6 index point this month and solidifying the large gains from the past two months. The fact that sentiment lost no ground this month suggests that consumers continue to feel more assured about the economy, confirming the considerable improvements in December and January across various aspects of the economy.

Consumers continued to express confidence that the slowdown in inflation and strength in labor markets would continue. Five-year expectations for business conditions rose 5% to its highest reading since December 2020. Sentiment is currently about 30% above November 2023 and about 6% below its historical average since monthly data collection began in 1978.

Year-ahead inflation inched up from 2.9 in January to 3.0% in February. For the second consecutive month, short-run
inflation expectations have fallen within the 2.3-3.0% range seen in the two years prior to the pandemic. Long-run inflation expectations remained at 2.9% for the third straight month, staying within the narrow 2.9-3.1% range for 28 of the last 31 months. Long-run inflation expectations were elevated relative to the 2.2-2.6% range seen in the two years pre-pandemic..."
 =========


The ICS is derived from the following five survey questions:

  1. "We are interested in how people are getting along financially these days. Would you say that you (and your family living there) are better off or worse off financially than you were a year ago?"

  2. "Now looking ahead, do you think that a year from now you (and your family living there) will be better off financially, or worse off, or just about the same as now?"

  3. "Now turning to business conditions in the country as a whole, do you think that during the next twelve months we'll have good times financially, or bad times, or what?"

  4. "Looking ahead, which would you say is more likely: that in the country as a whole we'll have continuous good times during the next five years or so, or that we will have periods of widespread unemployment or depression, or what?"

  5. "About the big things people buy for their homes, such as furniture, a refrigerator, stove, television, and things like that. Generally speaking, do you think now is a good or bad time for people to buy major household items?"
=========


=========

The ICS uses a 1966 baseline, i.e. for 1966, the ICS = 100. So any number that is below the 1966 baseline of 100 means that the folks who were polled recently aren't as optimistic about the U.S. economy as those polled back in 1966.

The ICS is similar to the Consumer Confidence Index in that they both measure consumer attitudes and offer valuable insight into consumer spending.

=========

The "predicted" figure is what economists were expecting, while the "actual" is the true or real figure.

=========


=========

Labels: , , ,


--> www.FedPrimeRate.com Privacy Policy <--

>  SITEMAP  <

Saturday, April 29, 2023

Consumer Sentiment: Final Results for April 2023

The University of Michigan's Index of Consumer Sentiment (ICS) - Final Results for April 2023 was released today:

Predicted: 64.0
  • Actual: 63.5
=========

  • Change from Previous Month: +2.42% (+1.5 points)

  • Change from 12 Months Previous: -2.61% (-1.7 points)

=========

  • Final ICS Reading for March 2023: 62.0

  • Final ICS Reading for April 2022: 65.2

=========

From Today's Report:

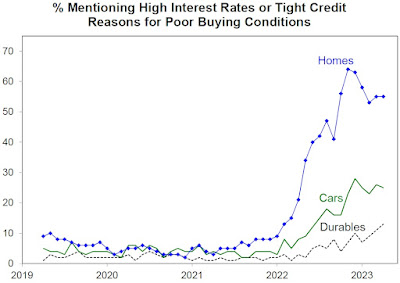
"...Consumer sentiment was little changed this month, inching up less than two index points from March. Buying conditions for durables improved 11% primarily on the basis of easing perceptions of unaffordability. Despite the increasingly negative news on business conditions heard by consumers, their short and long-run economic outlook improved modestly from last month. These improvements were balanced by worsening assessments of personal finances due to higher expenses, reflecting the ongoing pain stemming from continued high prices..."

=========

Percent Mentioning High Interest Rates or Tight Credit as Reasons for Poor Buying Conditions
CHART: Percent Mentioning High Interest Rates
or Tight Credit as Reasons
for Poor Buying Conditions
 
=========


The ICS is derived from the following five survey questions:


  1. "We are interested in how people are getting along financially these days. Would you say that you (and your family living there) are better off or worse off financially than you were a year ago?"


  2. "Now looking ahead, do you think that a year from now you (and your family living there) will be better off financially, or worse off, or just about the same as now?"


  3. "Now turning to business conditions in the country as a whole, do you think that during the next twelve months we'll have good times financially, or bad times, or what?"


  4. "Looking ahead, which would you say is more likely: that in the country as a whole we'll have continuous good times during the next five years or so, or that we will have periods of widespread unemployment or depression, or what?"


  5. "About the big things people buy for their homes, such as furniture, a refrigerator, stove, television, and things like that. Generally speaking, do you think now is a good or bad time for people to buy major household items?"

=========


=========

The ICS uses a 1966 baseline, i.e. for 1966, the ICS = 100. So any number that is below the 1966 baseline of 100 means that the folks who were polled recently aren't as optimistic about the U.S. economy as those polled back in 1966.

The ICS is similar to the Consumer Confidence Index in that they both measure consumer attitudes and offer valuable insight into consumer spending.

=========

The "predicted" figure is what economists were expecting, while the "actual" is the true or real figure.

=========


=========


Labels: , , , , , ,


--> www.FedPrimeRate.com Privacy Policy <--

>  SITEMAP  <

Monday, November 28, 2022

Consumer Sentiment: Final Results for November 2022

The University of Michigan's Index of Consumer Sentiment (ICS) - Final Results for November 2022 was released today:

Predicted: 57.0
  • Actual: 56.8
=========

  • Change from Previous Month: -5.18% (-3.1 points)

  • Change from 12 Months Previous: -15.73% (-10.6 points)

=========

  • Final ICS Reading for October 2022: 59.9

  • Final ICS Reading for November 2021: 67.4

=========

From Today's Report:

"...Consumer sentiment fell 5% below October, offsetting about one-third of the gains posted since the historic low in June. Along with the ongoing impact of inflation, consumer attitudes have also been weighed down by rising borrowing costs, declining asset values, and weakening labor market expectations. Buying conditions for durables, which had markedly improved last month, decreased most sharply in November, falling back 19% to its September level on the basis of high interest rates and continued high prices Long-term business conditions declined a more modest 6%, while short-term business conditions and personal finances were essentially unchanged.

Inflation expectations were also little changed from October. The median expected year-ahead inflation rate was 4.9%, down slightly from 5.0% last month. Long run inflation expectations, currently at 3.0%, have remained in the narrow (albeit elevated) 2.9-3.1% range for 15 of the last 16 months. Uncertainty over these expectations remained at an elevated level, indicating that the general stability of these expectations may not necessarily endure..."
 =========


The ICS is derived from the following five survey questions:


  1. "We are interested in how people are getting along financially these days. Would you say that you (and your family living there) are better off or worse off financially than you were a year ago?"


  2. "Now looking ahead, do you think that a year from now you (and your family living there) will be better off financially, or worse off, or just about the same as now?"


  3. "Now turning to business conditions in the country as a whole, do you think that during the next twelve months we'll have good times financially, or bad times, or what?"


  4. "Looking ahead, which would you say is more likely: that in the country as a whole we'll have continuous good times during the next five years or so, or that we will have periods of widespread unemployment or depression, or what?"


  5. "About the big things people buy for their homes, such as furniture, a refrigerator, stove, television, and things like that. Generally speaking, do you think now is a good or bad time for people to buy major household items?"

=========


=========

The ICS uses a 1966 baseline, i.e. for 1966, the ICS = 100. So any number that is below the 1966 baseline of 100 means that the folks who were polled recently aren't as optimistic about the U.S. economy as those polled back in 1966.

The ICS is similar to the Consumer Confidence Index in that they both measure consumer attitudes and offer valuable insight into consumer spending.

=========

The "predicted" figure is what economists were expecting, while the "actual" is the true or real figure.

=========


=========


Labels: , , , , , , ,


--> www.FedPrimeRate.com Privacy Policy <--

>  SITEMAP  <

Friday, November 11, 2022

Consumer Sentiment: Preliminary Results for November 2022

The University of Michigan's Index of Consumer Sentiment (ICS) - Preliminary Results for November 2022 was released today:

Predicted: 60.0
  • Actual: 54.7
=========

  • Change from Previous Month: -8.68% (-5.2 points)

  • Change from 12 Months Previous: -18.84% (-12.7 points)

=========

  • Final ICS Reading for October 2022: 59.9

  • Final ICS Reading for November 2021: 67.4

=========

From Today's Report:

"...Consumer sentiment fell about 9% below October, erasing about half of the gains that had been recorded since the historic low in June. All components of the index declined from last month, but buying conditions for durables, which had markedly improved last month, decreased most sharply in November, falling back 21% on the basis of high interest rates as well as continued high prices. Overall, declines in sentiment were observed across the distribution of age, education, income, geography, and political affiliation, showing that the recent improvements in sentiment were tentative. Instability in sentiment is likely to continue, a reflection of uncertainty over both global factors and the eventual outcomes of the election.

Inflation expectations are little changed. The median expected year-ahead inflation rate was 5.1%, up from 5.0% last month. Long run inflation expectations, currently at 3.0%, have remained in the narrow (albeit elevated) 2.9-3.1% range for 15 of the last 16 months..."

=========

CHART: High Interest Rate Reasons for Poor Buying Conditions and Interest Rates

CHART: High Interest Rate Reasons for
Poor Buying Conditions and Interest Rates
 
 =========


The ICS is derived from the following five survey questions:


  1. "We are interested in how people are getting along financially these days. Would you say that you (and your family living there) are better off or worse off financially than you were a year ago?"


  2. "Now looking ahead, do you think that a year from now you (and your family living there) will be better off financially, or worse off, or just about the same as now?"


  3. "Now turning to business conditions in the country as a whole, do you think that during the next twelve months we'll have good times financially, or bad times, or what?"


  4. "Looking ahead, which would you say is more likely: that in the country as a whole we'll have continuous good times during the next five years or so, or that we will have periods of widespread unemployment or depression, or what?"


  5. "About the big things people buy for their homes, such as furniture, a refrigerator, stove, television, and things like that. Generally speaking, do you think now is a good or bad time for people to buy major household items?"

=========


=========

The ICS uses a 1966 baseline, i.e. for 1966, the ICS = 100. So any number that is below the 1966 baseline of 100 means that the folks who were polled recently aren't as optimistic about the U.S. economy as those polled back in 1966.

The ICS is similar to the Consumer Confidence Index in that they both measure consumer attitudes and offer valuable insight into consumer spending.

=========

The "predicted" figure is what economists were expecting, while the "actual" is the true or real figure.

=========


=========


Labels: , , , , , , ,


--> www.FedPrimeRate.com Privacy Policy <--

>  SITEMAP  <

Friday, September 30, 2022

Consumer Sentiment: Final Results for September 2022

The University of Michigan's Index of Consumer Sentiment (ICS) - Final Results for September 2022 was released today:

Predicted: 59.0
  • Actual: 58.6
=========

  • Change from Previous Month: +0.687% (+ 0.4 point)
  • Change from 12 Months Previous: -19.505% (-14.2 points)

=========

  • Final ICS Reading for August 2022: 58.2

  • Final ICS Reading for September 2021: 72.8

=========

From today's report:

"...Consumer sentiment confirmed the preliminary reading earlier this month and was essentially unchanged from the month prior, at less than one index point above August. Buying conditions for durables and the one-year economic outlook continued lifting from the extremely low readings earlier in the summer, but these gains were largely offset by modest declines in the long run outlook for business conditions. As seen in the chart, sentiment for consumers across the income distribution has declined in a remarkably close fashion for the last 6 months, reflecting shared concerns over the impact of inflation, even among higher-income consumers who have historically generated the lion's share of spending.

The median expected year-ahead inflation rate declined to 4.7%, the lowest reading since last September. At 2.7%, median long run inflation expectations fell below the 2.9-3.1% range for the first time since July 2021. Inflation expectations are likely to remain relatively unstable in the months ahead, as consumer uncertainty over these expectations remained high and is unlikely to wane in the face of continued global pressures on inflation..."

 =====================


CHART: Index of Consumer Sentiment History - 3 Month Moving Average - September 2022 UPDATE

CHART: Index of Consumer Sentiment History
3 Month Moving Average
September 2022 UPDATE

 =====================


The ICS is derived from the following five survey questions:


  1. "We are interested in how people are getting along financially these days. Would you say that you (and your family living there) are better off or worse off financially than you were a year ago?"


  2. "Now looking ahead, do you think that a year from now you (and your family living there) will be better off financially, or worse off, or just about the same as now?"


  3. "Now turning to business conditions in the country as a whole, do you think that during the next twelve months we'll have good times financially, or bad times, or what?"


  4. "Looking ahead, which would you say is more likely: that in the country as a whole we'll have continuous good times during the next five years or so, or that we will have periods of widespread unemployment or depression, or what?"


  5. "About the big things people buy for their homes, such as furniture, a refrigerator, stove, television, and things like that. Generally speaking, do you think now is a good or bad time for people to buy major household items?"

=========


=========

The ICS uses a 1966 baseline, i.e. for 1966, the ICS = 100. So any number that is below the 1966 baseline of 100 means that the folks who were polled recently aren't as optimistic about the U.S. economy as those polled back in 1966.

The ICS is similar to the Consumer Confidence Index in that they both measure consumer attitudes and offer valuable insight into consumer spending.

=========

The "predicted" figure is what economists were expecting, while the "actual" is the true or real figure.

=========


=========


Labels: , , , , , ,


--> www.FedPrimeRate.com Privacy Policy <--

>  SITEMAP  <

Saturday, July 16, 2022

Consumer Sentiment: Preliminary Results for July 2022

The University of Michigan's Index of Consumer Sentiment (ICS) -  Preliminary Results for July 2022 was released today:

Predicted: 50.0
  • Actual: 51.1
=========

  • Change from Previous Month: +2.2% (+1.1 points)
  • Change from 12 Months Previous: -37.07% (-30.1 points)

=========

  • Final ICS Reading for June 2022: 50.0

  • Final ICS Reading for July 2021: 81.2

=========

From today's report:

"...Consumer sentiment was relatively unchanged, remaining near all-time lows. Current assessments of personal finances continued to deteriorate, reaching its lowest point since 2011. Buying conditions for durables adjusted upwards, owing both to consumers who cited easing supply constraints and those who believed that one should buy now to avoid future price increases, which would exacerbate inflation going forward. Even with the adjustment, buying conditions remained 26% lower than a year ago.

Consumers remained in agreement over the deleterious effect of prices on their personal finances. The share of consumers blaming inflation for eroding their living standards continued its rise to 49%, matching the all-time high reached during the Great Recession. These negative views endured in the face of the recent moderation in gas prices at the pump.

Inflation expectations have held steady or improved somewhat. The median expected year-ahead inflation rate was 5.2%, little changed from the past five months. Median long run expectations fell to 2.8%, just below the 2.9-3.1% range seen in the preceding 11 months. Inflation uncertainty continued to grow, with 26% of consumers expecting prices to stay the same or fall over the next 5 to 10 years, up from 11% a year ago.
.."

=========


CHART: Current Financial Situation Compared to A Year Ago (Monthly and Three Month Moving Average) - July 2022 PRELIMINARY UPDATE

CHART: Current Financial Situation Compared to A Year Ago
(Monthly and Three Month Moving Average)
July 2022 PRELIMINARY UPDATE


 =========


The ICS is derived from the following five survey questions:


  1. "We are interested in how people are getting along financially these days. Would you say that you (and your family living there) are better off or worse off financially than you were a year ago?"


  2. "Now looking ahead, do you think that a year from now you (and your family living there) will be better off financially, or worse off, or just about the same as now?"


  3. "Now turning to business conditions in the country as a whole, do you think that during the next twelve months we'll have good times financially, or bad times, or what?"


  4. "Looking ahead, which would you say is more likely: that in the country as a whole we'll have continuous good times during the next five years or so, or that we will have periods of widespread unemployment or depression, or what?"


  5. "About the big things people buy for their homes, such as furniture, a refrigerator, stove, television, and things like that. Generally speaking, do you think now is a good or bad time for people to buy major household items?"

=========


=========

The ICS uses a 1966 baseline, i.e. for 1966, the ICS = 100. So any number that is below the 1966 baseline of 100 means that the folks who were polled recently aren't as optimistic about the U.S. economy as those polled back in 1966.

The ICS is similar to the Consumer Confidence Index in that they both measure consumer attitudes and offer valuable insight into consumer spending.

=========

The "predicted" figure is what economists were expecting, while the "actual" is the true or real figure.

=========


=========


Labels: , , , , , , ,


--> www.FedPrimeRate.com Privacy Policy <--

>  SITEMAP  <

Friday, June 24, 2022

Consumer Sentiment: Final Results for June 2022

The University of Michigan's Index of Consumer Sentiment (ICS) - Final Results for June 2022 was released today:

Predicted: 51.0
  • Actual: 50.0
=========

  • Change from Previous Month: -14.38% (-8.4 points)
  • Change from 12 Months Previous: -41.52% (-35.5 points)

=========

  • Final ICS Reading for May 2022: 58.4

  • Final ICS Reading for June 2021: 85.5

=========

From today's report:

"...The final June reading confirmed the early-June decline in consumer sentiment, settling 0.2 Index points below the preliminary reading and 14.4% below May for the lowest reading on record. Consumers across income, age, education, geographic region, political affiliation, stockholding and homeownership status all posted large declines. About 79% of consumers expected bad times in the year ahead for business conditions, the highest since 2009. Inflation continued to be of paramount concern to consumers; 47% of consumers blamed inflation for eroding their living standards, just one point shy of the all-time high last reached during the Great Recession.

Since the preliminary reading, the Federal Reserve raised interest rates by 75 basis points, exceeding the 50 basis point hike that had been previously telegraphed. The final June reading of the median expected year-ahead inflation rate was 5.3%, little changed from mid-month or the preceding four months. In contrast, long run expectations receded from its mid-month reading of 3.3% and settled at 3.1%, back within the 2.9-3.1% range seen in the past 10 months. Consumers also expressed the highest level of uncertainty over long-run inflation since 1991, continuing a sharp increase that began in 2021..."

 =====================


CHART: Inflation Uncertainty As Estimated by the Range of the Middle 50% in Inflation Expectations

CHART: Inflation Uncertainty As Estimated
by the Range of the Middle 50%
in Inflation Expectations


 =====================


The ICS is derived from the following five survey questions:


  1. "We are interested in how people are getting along financially these days. Would you say that you (and your family living there) are better off or worse off financially than you were a year ago?"


  2. "Now looking ahead, do you think that a year from now you (and your family living there) will be better off financially, or worse off, or just about the same as now?"


  3. "Now turning to business conditions in the country as a whole, do you think that during the next twelve months we'll have good times financially, or bad times, or what?"


  4. "Looking ahead, which would you say is more likely: that in the country as a whole we'll have continuous good times during the next five years or so, or that we will have periods of widespread unemployment or depression, or what?"


  5. "About the big things people buy for their homes, such as furniture, a refrigerator, stove, television, and things like that. Generally speaking, do you think now is a good or bad time for people to buy major household items?"

=========


=========

The ICS uses a 1966 baseline, i.e. for 1966, the ICS = 100. So any number that is below the 1966 baseline of 100 means that the folks who were polled recently aren't as optimistic about the U.S. economy as those polled back in 1966.

The ICS is similar to the Consumer Confidence Index in that they both measure consumer attitudes and offer valuable insight into consumer spending.

=========

The "predicted" figure is what economists were expecting, while the "actual" is the true or real figure.

=========


=========


Labels: , , , , , ,


--> www.FedPrimeRate.com Privacy Policy <--

>  SITEMAP  <

Sunday, June 12, 2022

Consumer Sentiment: Preliminary Results for June 2022

The University of Michigan's Index of Consumer Sentiment (ICS) -  Preliminary Results for June 2022 was released today:

Predicted: 55.0
  • Actual: 50.2
=========

  • Change from Previous Month: -14.041% (-8.2 points)
  • Change from 12 Months Previous: -41.29% (-35.3 points)

=========

  • Final ICS Reading for May 2022: 58.4

  • Final ICS Reading for June 2021: 85.5

=========

From today's report:

"...Consumer sentiment declined by 14% from May, continuing a downward trend over the last year and reaching its lowest recorded value [50.2], comparable to the trough reached in the middle of the 1980 recession. All components of the sentiment index fell this month, with the steepest decline in the year-ahead outlook in business conditions, down 24% from May. Consumers' assessments of their personal financial situation worsened about 20%. Forty-six percent of consumers attributed their negative views to inflation, up from 38% in May; this share has only been exceeded once since 1981, during the Great Recession.

Overall, gas prices weighed heavily on consumers, which was no surprise given the 65 cent increase in national gas prices from last month (AAA). Half of all consumers spontaneously mentioned gas during their interviews, compared with 30% in May and only 13% a year ago. Consumers expect gas prices to continue to rise a median of 25 cents over the next year, more than double the May reading and the second highest since 2015.

In addition, a majority of consumers spontaneously mentioned supply shortages for the ninth consecutive month.
.."

=========


CHART: Consumer Sentiment Expected Change in Real Income During the Next Year June 2022 PRELIMINARY UPDATE
CHART: Consumer Sentiment
Expected Change in Real Income
During the Next Year
June 2022 PRELIMINARY UPDATE
 
 =========


The ICS is derived from the following five survey questions:


  1. "We are interested in how people are getting along financially these days. Would you say that you (and your family living there) are better off or worse off financially than you were a year ago?"


  2. "Now looking ahead, do you think that a year from now you (and your family living there) will be better off financially, or worse off, or just about the same as now?"


  3. "Now turning to business conditions in the country as a whole, do you think that during the next twelve months we'll have good times financially, or bad times, or what?"


  4. "Looking ahead, which would you say is more likely: that in the country as a whole we'll have continuous good times during the next five years or so, or that we will have periods of widespread unemployment or depression, or what?"


  5. "About the big things people buy for their homes, such as furniture, a refrigerator, stove, television, and things like that. Generally speaking, do you think now is a good or bad time for people to buy major household items?"

=========


=========

The ICS uses a 1966 baseline, i.e. for 1966, the ICS = 100. So any number that is below the 1966 baseline of 100 means that the folks who were polled recently aren't as optimistic about the U.S. economy as those polled back in 1966.

The ICS is similar to the Consumer Confidence Index in that they both measure consumer attitudes and offer valuable insight into consumer spending.

=========

The "predicted" figure is what economists were expecting, while the "actual" is the true or real figure.

=========


=========


Labels: , , , , , ,


--> www.FedPrimeRate.com Privacy Policy <--

>  SITEMAP  <

Saturday, May 28, 2022

Consumer Sentiment: Final Results for May 2022

The University of Michigan's Index of Consumer Sentiment (ICS) - Final Results for May 2022 was released today:

Predicted: 59.0
  • Actual: 58.4
=========

  • Change from Previous Month: -10.43% (-6.8 points)
  • Change from 12 Months Previous: -29.55% (-24.5 points)

=========

  • Final ICS Reading for April 2022: 65.2

  • Final ICS Reading for May 2021: 82.9

=========

From today's report:

"...The final May reading confirmed the early month decline in consumer sentiment, which fell 10.4% below April and reverted to virtually the same level of sentiment seen in March. This recent drop was largely driven by continued negative views on current buying conditions for houses and durables, as well as consumers’ future outlook for the economy, primarily due to concerns over inflation. At the same time, consumers expressed less pessimism over future prospects for their personal finances than over future business conditions.

Less than one quarter of consumers expected to be worse off financially a year from now.

Looking into the long term, a majority of consumers expected their financial situation to improve over the next five years; this share is essentially unchanged during 2022. A stable outlook for personal finances may currently support
consumer spending. Still, persistently negative views of the economy may come to dominate personal factors in influencing consumer behavior in the future..."

=========


CHART: Consumer Sentiment Monthly + 3-Month Moving Average - May 2022 FINAL

CHART: Consumer Sentiment
Monthly + 3-Month Moving Average
 May 2022 FINAL Reading

 =========


The ICS is derived from the following five survey questions:


  1. "We are interested in how people are getting along financially these days. Would you say that you (and your family living there) are better off or worse off financially than you were a year ago?"


  2. "Now looking ahead, do you think that a year from now you (and your family living there) will be better off financially, or worse off, or just about the same as now?"


  3. "Now turning to business conditions in the country as a whole, do you think that during the next twelve months we'll have good times financially, or bad times, or what?"


  4. "Looking ahead, which would you say is more likely: that in the country as a whole we'll have continuous good times during the next five years or so, or that we will have periods of widespread unemployment or depression, or what?"


  5. "About the big things people buy for their homes, such as furniture, a refrigerator, stove, television, and things like that. Generally speaking, do you think now is a good or bad time for people to buy major household items?"

=========


=========

The ICS uses a 1966 baseline, i.e. for 1966, the ICS = 100. So any number that is below the 1966 baseline of 100 means that the folks who were polled recently aren't as optimistic about the U.S. economy as those polled back in 1966.

The ICS is similar to the Consumer Confidence Index in that they both measure consumer attitudes and offer valuable insight into consumer spending.

=========

The "predicted" figure is what economists were expecting, while the "actual" is the true or real figure.

=========


=========


Labels: , , , , , ,


--> www.FedPrimeRate.com Privacy Policy <--

>  SITEMAP  <

Friday, May 13, 2022

Consumer Sentiment: Preliminary Results for May 2022

The University of Michigan's Index of Consumer Sentiment (ICS) -  Preliminary Results for May 2022 was released today:

Predicted: 61.0
  • Actual: 59.1
=========

  • Change from Previous Month: -9.36% (-6.1 points)
  • Change from 12 Months Previous: -28.71% (-23.8 points)

=========

  • Final ICS Reading for April 2022: 65.2

  • Final ICS Reading for May 2021: 82.9

=========

From today's report:

"...Consumer sentiment declined by 9.4% from April, reversing gains realized that month. These declines were broad based -- for current economic conditions as well as consumer expectations, and visible across income, age, education, geography, and political affiliation -- continuing the general downward trend in sentiment over the past year. Consumers' assessment of their current financial situation relative to a year ago is at its lowest reading since 2013, with 36% of consumers attributing their negative assessment to inflation. Buying conditions for durables reached its lowest reading since the question began appearing on the monthly surveys in 1978, again primarily due to high prices.

The median expected year-ahead
inflation rate was 5.4%, little changed over the last three months, and up from 4.6% in May 2021. The mean was considerably higher at 7.4%, reflecting substantial variation in price changes across types of goods and services, and in household spending patterns. At the same time, long term inflation expectations remain well-anchored with a median of 3.0%, settling within the 2.9 to 3.1% range seen over the last 10 months..."

=========


CHART: Consumer Sentiment - Monthly and 3-Month Moving Average - May 2022 PRELIMINARY

CHART: Consumer Sentiment
Monthly and 3-Month Moving Average
May 2022 PRELIMINARY

 
 =========


The ICS is derived from the following five survey questions:


  1. "We are interested in how people are getting along financially these days. Would you say that you (and your family living there) are better off or worse off financially than you were a year ago?"


  2. "Now looking ahead, do you think that a year from now you (and your family living there) will be better off financially, or worse off, or just about the same as now?"


  3. "Now turning to business conditions in the country as a whole, do you think that during the next twelve months we'll have good times financially, or bad times, or what?"


  4. "Looking ahead, which would you say is more likely: that in the country as a whole we'll have continuous good times during the next five years or so, or that we will have periods of widespread unemployment or depression, or what?"


  5. "About the big things people buy for their homes, such as furniture, a refrigerator, stove, television, and things like that. Generally speaking, do you think now is a good or bad time for people to buy major household items?"

=========


=========

The ICS uses a 1966 baseline, i.e. for 1966, the ICS = 100. So any number that is below the 1966 baseline of 100 means that the folks who were polled recently aren't as optimistic about the U.S. economy as those polled back in 1966.

The ICS is similar to the Consumer Confidence Index in that they both measure consumer attitudes and offer valuable insight into consumer spending.

=========

The "predicted" figure is what economists were expecting, while the "actual" is the true or real figure.

=========


=========


Labels: , , , , , ,


--> www.FedPrimeRate.com Privacy Policy <--

>  SITEMAP  <

Saturday, March 26, 2022

Consumer Sentiment: Final Results for March 2022

The University of Michigan's Index of Consumer Sentiment (ICS) - Final Results for March 2022 was released today:

Predicted: 60.0
  • Actual: 59.4
=========

  • Change from Previous Month: -5.414% (-3.4 points)
  • Change from 12 Months Previous: -30.035% (-25.5 points)

=========

  • Final ICS Reading for February 2022: 62.8

  • Final ICS Reading for March 2021: 84.9

=========

From today's report:

"...Consumer Sentiment remained largely unchanged in late March at the same diminished level recorded at mid month. Inflation has been the primary cause of rising pessimism, with an expected year-ahead inflation rate at 5.4%, the highest since November 1981. Inflation was mentioned throughout the survey, whether the questions referred to personal finances, prospects for the economy, or assessments of buying conditions. When asked to explain changes in their finances in their own words, more consumers mentioned reduced living standards due to rising inflation than any other time except during the two worst recessions in the past fifty years: from March 1979 to April 1981, and from May to October 2008. Moreover, 32% of all consumers expected their overall financial position to worsen in the year ahead, the highest recorded level since the surveys started in the mid-1940s. The combination of rising prices and less positive income expectations meant that half of all households anticipated declines in inflation-adjusted incomes in the year ahead. The sole area of the economy about which consumers were still optimistic was the strong job market. Consumers anticipated in March that during the year ahead it was more likely that the unemployment rate would post further declines than increases (30% versus 24%).

Strong job growth will continue to put upward pressures on wages, resulting in higher income and stronger job prospects. This strength will then act to expand consumer demand and ultimately lead to another cycle of price and wage increases. These factors represent the necessary (but not sufficient) conditions for the development of inflationary psychology as a self-fulfilling prophecy. Prevention of inflationary psychology is much less costly before it becomes ingrained in the economic behavior of consumers and firms. Confidence that economic policies will resolve the problem is essential. Unfortunately, half of all consumers unfavorably assessed current policies, more than three times the 16% who rated them favorably. Making the situation even more difficult, policy makers need to take account of two unusual sources of economic uncertainty, one rather minor (the new covid variant), and a major source of continued economic disruption (the Russian invasion of Ukraine).
.."

=========


CHART: Expected Change In Financial Situation In A Year

CHART: Expected Change In
Financial Situation In A Year

 =========


The ICS is derived from the following five survey questions:


  1. "We are interested in how people are getting along financially these days. Would you say that you (and your family living there) are better off or worse off financially than you were a year ago?"


  2. "Now looking ahead, do you think that a year from now you (and your family living there) will be better off financially, or worse off, or just about the same as now?"


  3. "Now turning to business conditions in the country as a whole, do you think that during the next twelve months we'll have good times financially, or bad times, or what?"


  4. "Looking ahead, which would you say is more likely: that in the country as a whole we'll have continuous good times during the next five years or so, or that we will have periods of widespread unemployment or depression, or what?"


  5. "About the big things people buy for their homes, such as furniture, a refrigerator, stove, television, and things like that. Generally speaking, do you think now is a good or bad time for people to buy major household items?"

=========


=========

The ICS uses a 1966 baseline, i.e. for 1966, the ICS = 100. So any number that is below the 1966 baseline of 100 means that the folks who were polled recently aren't as optimistic about the U.S. economy as those polled back in 1966.

The ICS is similar to the Consumer Confidence Index in that they both measure consumer attitudes and offer valuable insight into consumer spending.

=========

The "predicted" figure is what economists were expecting, while the "actual" is the true or real figure.

=========


=========


Labels: , , , , , ,


--> www.FedPrimeRate.com Privacy Policy <--

>  SITEMAP  <

Friday, March 11, 2022

Consumer Sentiment: Preliminary Results for March 2022

The University of Michigan's Index of Consumer Sentiment (ICS) -  Preliminary Results for March 2022 was released today:

Predicted: 70.0
  • Actual: 59.7
=========

  • Change from Previous Month: -4.936% (-3.1 points)
  • Change from 12 Months Previous: -29.682% (-25.2 points)

=========

  • Final ICS Reading for February 2022: 62.8

  • Final ICS Reading for March 2021: 84.9

=========

From today's report:

"...Consumer Sentiment continued to decline due to falling inflation-adjusted incomes, recently accelerated by rising fuel prices as a result of the Russian invasion of Ukraine. The year-ahead expected inflation rate rose to its highest level since 1981, and expected gas prices posted their largest monthly upward surge in decades. Personal finances were expected to worsen in the year ahead by the largest proportion since the surveys started in the mid-1940s. Consumers held very negative prospects for the economy, with the sole exception of the job market. Consumers were slightly more likely to anticipate declines rather than increases in the national unemployment rate. This underlying strength in jobs comes at the cost of pushing inflation even higher due to unrelenting pressures on aggregate demand and supply lines. The persistent strength in demand was a critical factor that shaped the last inflationary age from 1965 to 1982, with stagflation peaking only near its end. Current expectations are consistent with heightened pressures on wages to meet the continued growth in demand. Like the game of musical chairs, everyone continues racing around the circle of rising prices and higher wages. Although everyone knows the game will end, everyone still wants to obtain the highest income possible before they exit. The game is moderated by fiscal and monetary policies, which now favor increased federal spending and full employment over price stability, enabling ever more rounds of the game.

The greatest source of uncertainty is undoubtedly inflation and the potential impact of the Russian invasion of Ukraine. In the March survey, 24% of all respondents spontaneously mentioned the Ukraine invasion in response to questions about the economic outlook. The impact of this recognition was associated with a drop of 13.2 Index points in the Index of Consumer Expectations across all households. The difference was much larger for those who held higher inflation expectations: the difference was 33.5 Index-points on the Expectations Index for those who expected under 5% compared with over 5%.
.."

=========

 
Expected Change in Real Income During the Next Year

 Expected Change in Real Income
During the Next Year
 
 =========


The ICS is derived from the following five survey questions:


  1. "We are interested in how people are getting along financially these days. Would you say that you (and your family living there) are better off or worse off financially than you were a year ago?"


  2. "Now looking ahead, do you think that a year from now you (and your family living there) will be better off financially, or worse off, or just about the same as now?"


  3. "Now turning to business conditions in the country as a whole, do you think that during the next twelve months we'll have good times financially, or bad times, or what?"


  4. "Looking ahead, which would you say is more likely: that in the country as a whole we'll have continuous good times during the next five years or so, or that we will have periods of widespread unemployment or depression, or what?"


  5. "About the big things people buy for their homes, such as furniture, a refrigerator, stove, television, and things like that. Generally speaking, do you think now is a good or bad time for people to buy major household items?"

=========


=========

The ICS uses a 1966 baseline, i.e. for 1966, the ICS = 100. So any number that is below the 1966 baseline of 100 means that the folks who were polled recently aren't as optimistic about the U.S. economy as those polled back in 1966.

The ICS is similar to the Consumer Confidence Index in that they both measure consumer attitudes and offer valuable insight into consumer spending.

=========

The "predicted" figure is what economists were expecting, while the "actual" is the true or real figure.

=========


=========


Labels: , , , , , ,


--> www.FedPrimeRate.com Privacy Policy <--

>  SITEMAP  <

bing

bing


SCAMS!

FedPrimeRate.com
Entire Website © 1999 - 2025 FedPrimeRate.comSM


This website is neither affiliated nor associated with The United States Federal Reserve
in any way. Information in this website is provided for educational purposes only. The owners
of this website make no warranties with respect to any and all content contained within this
website. Consult a financial professional before making important decisions related to any
investment or loan product, including, but not limited to, business loans, personal loans,
education loans, first or second mortgages, credit cards, car loans or any type of insurance.