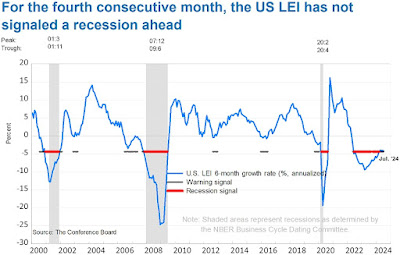
Leading Economic Index for July 2024
The Conference Board® released its Leading Economic Index® (LEI) for July 2024 this morning:
==============
Index for July 2024: 100.4 (The baseline 100 score is associated with 2016 data.)
==============
Predicted: -0.4%
==============
==============
The yellow-highlighted percentage is the month-to-month change for the index. The "predicted" figure is what economists were expecting, while the "actual" is the true or real figure.
The LEI is a composite of 10 of the nation's economic data releases that's put together by The Conference Board. Statistically, the components listed below have shown a significant increase or decrease before national economic upturns or downturns:
==============
==============
Index for July 2024: 100.4 (The baseline 100 score is associated with 2016 data.)
==============
Predicted: -0.4%
- Actual: -0.59% (-0.6 point M/M)
- Change from 12 Months Ago: -5.19% (-5.5 points)
==============
- LEI for June 2024: 101.0
- LEI for May 2024: 101.2
- LEI for April 2024: 101.7
- LEI for March 2024: 102.3
- LEI for February 2024: 102.6
- LEI for January 2024: 102.6
- LEI for December 2023: 103.1
- LEI for November 2023: 103.3
- LEI for October 2023: 103.8
- LEI for September 2023: 104.7
- LEI for August 2023: 105.5
- LEI for July 2023: 105.9
- LEI for June 2023: 106.1
- LEI for May 2023: 106.7
- LEI for April 2023: 107.4
- LEI for March 2023: 108.3
- LEI for February 2023: 109.6
- LEI for January 2023: 110.2
- LEI for December 2022: 110.7
- LEI for November 2022: 111.5
- LEI for October 2022: 112.5
- LEI for September 2022: 113.5
- LEI for August 2022: 116.4
- LEI for July 2022: 116.4
- LEI for June 2022: 117.1
- LEI for May 2022: 117.9
- LEI for April 2022: 118.7
- LEI for March 2022: 119.3
- LEI for February 2022: 119.4
- LEI for January 2022: 118.5
==============
The yellow-highlighted percentage is the month-to-month change for the index. The "predicted" figure is what economists were expecting, while the "actual" is the true or real figure.
The LEI is a composite of 10 of the nation's economic data releases that's put together by The Conference Board. Statistically, the components listed below have shown a significant increase or decrease before national economic upturns or downturns:
- The Standard + Poor's 500 Index
- Average weekly claims for unemployment insurance
- Building permits for new private housing
- The interest rate spread between the yield on the benchmark 10-Year Treasury Note and Federal Funds
- ISM® Index of New Orders
- Manufacturer's new orders for consumer goods or materials
- Manufacturers' new orders, non-defense capital goods excluding aircraft orders
- Average weekly manufacturing hours
- Average consumer expectations for business conditions
- Leading Credit Index™
==============
==============
From Today's Report:
"...'The LEI continues to fall on a month-over-month basis, but the six-month annual growth rate no longer signals recession ahead,' said Justyna Zabinska-La Monica, Senior Manager, Business Cycle Indicators, at The Conference Board. 'In July, weakness was widespread among non-financial components. A sharp deterioration in new orders, persistently weak consumer expectations of business conditions, and softer building permits and hours worked in manufacturing drove the decline, together with the still-negative yield spread. These data continue to suggest headwinds in economic growth going forward."
Labels: consumer, consumers, disinflation, Economy, hard_data, inflation, Inflation_Expectations, Leading_Economic_Index, leading_economic_indicators, Recession, Recession_Risk, Recession_Signals, Recession_Warning
|
--> www.FedPrimeRate.com Privacy Policy <--
CLICK HERE to JUMP to the TOP of THIS PAGE > SITEMAP < |


0 Comments:
Post a Comment
<< Home