Consumer Confidence Index (CCI) for March 2025
================
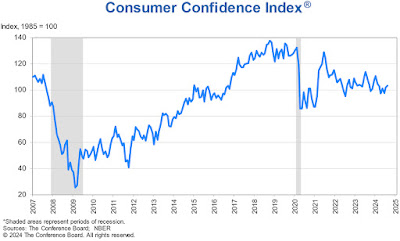
Predicted: 95.0
- Actual: 92.9
================
Previous Month (revised): 100.1
- Change from Previous Month: -7.19% (-7.2 points)
The "predicted" figure is what economists were expecting, while the "actual" is the true or real figure.
From Today's Report:
"...'Consumer confidence declined for a fourth consecutive month in March, falling below the relatively narrow range that had prevailed since 2022,' said Stephanie Guichard, Senior Economist, Global Indicators at The Conference Board. 'Of the Index’s five components, only consumers’ assessment of present labor market conditions improved, albeit slightly. Views of current business conditions weakened to close to neutral. Consumers’ expectations were especially gloomy, with pessimism about future business conditions deepening and confidence about future employment prospects falling to a 12-year low. Meanwhile, consumers’ optimism about future income -- which had held up quite strongly in the past few months -- largely vanished, suggesting worries about the economy and labor market have started to spread into consumers’ assessments of their personal situations.'================
Guichard added: 'Likely in response to recent market volatility, consumers turned negative about the stock market for the first time since the end of 2023. In March, only 37.4% expected stock prices to rise over the year ahead -- down nearly 10 percentage points from February and 20 percentage points from the high reached in November 2024. On the flip side, 44.5% expected stock prices to decline (up 11 ppts from February and over 22 ppts more than November 2024). Meanwhile, average 12-month inflation expectations rose again -- from 5.8% in February to 6.2% in March -- as consumers remained concerned about high prices for key household staples like eggs and the impact of tariffs.'..."
Every month, The Conference Board sends a questionnaire to 5,000 U.S.
households. Survey participants are polled about their feelings
regarding the U.S. economy, current and future, and about their own
fiscal circumstances. On average, 3,500 participants complete and return
the 5-question survey.
- The baseline "100" score for the CCI is associated with 1985 survey data.
When consumers feel good about the economy, they tend to do more spending, and vice versa.
Based in New York City, The Conference Board is a private,
not-for-profit organization with a mission to, "create and disseminate
knowledge about management and the marketplace to help businesses
strengthen their performance and better serve society."
The CCI is usually released on the last Tuesday of the month.
================
========================================
=========================================
Labels: cci, Conference_Board, consumer_confidence, consumer_spending, consumers, FedPrimeRate, FedPrimeRate.com, inflation, Inflation_Expectations, Recession, Recession_Expectations, Spending, The_Conference_Board, Trade
|
--> www.FedPrimeRate.com Privacy Policy <--
CLICK HERE to JUMP to the TOP of THIS PAGE > SITEMAP < |


