.comment-link {margin-left:.6em;}

Economy

Economic Data (USA)

Tuesday, August 27, 2024

Durable Goods Orders During July 2024

The Durable Goods Orders report for July 2024 was released by the Commerce Department this morning:

================

Predicted: +5.0%

  • Actual: $289,645,000,000 (+$26,074,000,000 [+9.89%])

================
CHART: Durable Goods Orders - JULY 2024 UPDATE
CHART: Durable Goods Orders
JULY 2024 UPDATE

================

The yellow-highlighted figures represent the dollar amount of new orders for durable or hard goods for immediate or future delivery from U.S. manufacturers, along with both the dollar and month-to-month percentage change.

Examples of durable goods: cars, airplanes, computers, furniture -- items that are built to last at least three years.

================

================

Labels: , , , , , , , ,


--> www.FedPrimeRate.com Privacy Policy <--

>  SITEMAP  <

Wednesday, April 27, 2022

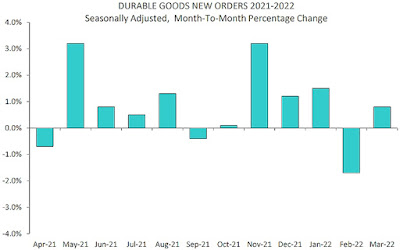
Durable Goods Orders During March 2022

The Durable Goods Orders report for March 2022 was released by the Commerce Department this morning:

================

Predicted: +1.1%

  • Actual: $272,718,000,000 (+$2,295,000,000 [+0.842%])

================

 CHART: Durable Goods Orders - March 2022 Update


CHART: Durable Goods Orders
March 2022 Update

================

From Today's Report:

"...Excluding transportation, new orders increased 1.1 percent. Excluding defense, new orders increased 1.2 percent. Computers and electronic products, up two of the last three months, led the increase, $0.7 billion or 2.6 percent to $26.3 billion..."

================

The yellow-highlighted figures represent the dollar amount of new orders for durable or hard goods for immediate or future delivery from U.S. manufacturers, along with both the dollar and month-to-month percentage change.

Examples of durable goods: cars, airplanes, computers, furniture -- items that are built to last at least three years.

================


 ================

Labels: , , , , , ,


--> www.FedPrimeRate.com Privacy Policy <--

>  SITEMAP  <

Tuesday, July 27, 2021

Durable Goods Orders During June 2021

The Durable Goods Orders report for June 2021 was released by the Commerce Department this morning:

================

Predicted: +1.5%

  • Actual: $257,627,000,000 (+$2,111,000,000 [+0.826%])

================

CHART: Durable Goods Orders - June 2021 Update

CHART: Durable Goods Orders - June 2021 Update

================

The yellow-highlighted figures represent the dollar amount of new orders for durable or hard goods for immediate or future delivery from U.S. manufacturers, along with both the dollar and month-to-month percentage change.

Examples of durable goods: cars, airplanes, computers, furniture -- items that are built to last at least three years.

================


 ================

Labels: , , , , , ,


--> www.FedPrimeRate.com Privacy Policy <--

>  SITEMAP  <

Friday, June 25, 2021

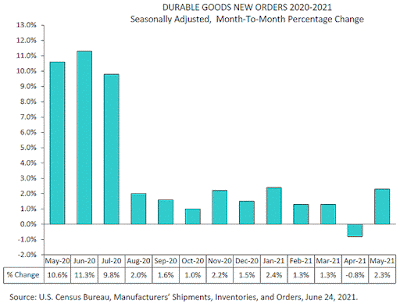
Durable Goods Orders During May 2021

The Durable Goods Orders report for May 2021 was released by the Commerce Department this morning:

================

Predicted: +2.5%

  • Actual: $253,323,000,000 (+$5,748,000,000 [+2.322%])

================

CHART: Durable Goods Orders - May 2021 Update

CHART: Durable Goods Orders - May 2021 Update

================

The yellow-highlighted figures represent the dollar amount of new orders for durable or hard goods for immediate or future delivery from U.S. manufacturers, along with both the dollar and month-to-month percentage change.

Examples of durable goods: cars, airplanes, computers, furniture -- items that are built to last at least three years.

================


 ================


Labels: , , , , , ,


--> www.FedPrimeRate.com Privacy Policy <--

>  SITEMAP  <

Wednesday, August 26, 2020

Durable Goods Orders During July 2020

The Durable Goods Orders report for July 2020 was released by the Commerce Department this morning:

================

Predicted: +5.0%

  • Actual: $230,672,000,000 (+$23,216,000,000 [+11.191%])

================

  • June 2020 (revised): $207,456,000,000 (+$14,851,000,000 [+7.711%])
 
================

CHART: Durable Goods Orders - July 2020 Update
================

The yellow-highlighted figures represent the dollar amount of new orders for durable or hard goods for immediate or future delivery from U.S. manufacturers, along with both the dollar and month-to-month percentage change.

Examples of durable goods: cars, airplanes, computers, furniture -- items that are built to last at least three years.

================


 ================

Labels: , , , , , ,


--> www.FedPrimeRate.com Privacy Policy <--

>  SITEMAP  <

Monday, July 27, 2020

Durable Goods Orders During June 2020

The Durable Goods Orders report for June 2020 was released by the Commerce Department this morning:

================

Predicted: +8.0%

  • Actual: $206,873,000,000 (+$14,011,000,000 [+7.265%])

================

  • May 2020 (revised): $192,862,000,000 (+$25,360,000,000 [+15.1401%])
 
================

CHART: Durable Goods Orders - June 2020 Update

================

The yellow-highlighted figures represent the dollar amount of new orders for durable or hard goods for immediate or future delivery from U.S. manufacturers, along with both the dollar and month-to-month percentage change.

Examples of durable goods: cars, airplanes, computers, furniture -- items that are built to last at least three years.


================

From Today's Report:

"...Statement Regarding COVID-19 Impact: Due to recent events surrounding COVID-19, many businesses are operating on a limited capacity or have ceased operations completely. The Census Bureau has monitored response and data quality and determined estimates in this release meet publication standards. For more information on the compilation of this month's reports, see <COVID-19 FAQs>..."

================


 ================

Labels: , , , , , ,


--> www.FedPrimeRate.com Privacy Policy <--

>  SITEMAP  <

Thursday, May 28, 2020

Durable Goods Orders During April 2020

The Durable Goods Orders report for April 2020 was released by the Commerce Department this morning:

================

Predicted: -18.0%
  • Actual: $169,966,000,000 (-$35,379,000,000 [-17.229%])

================

  • March 2020 (revised): $205,345,000,000 (-$40,850,000,000 [-16.593%])
 
================
Chart: Durable Goods Orders - April 2020 Update

================

The yellow-highlighted figures represent the dollar amount of new orders for durable or hard goods for immediate or future delivery from U.S. manufacturers, along with both the dollar and month-to-month percentage change.

Examples of durable goods: cars, airplanes, computers, furniture -- items that are built to last at least three years.

================


 ================

Labels: , , , , ,


--> www.FedPrimeRate.com Privacy Policy <--

>  SITEMAP  <

Friday, April 24, 2020

Durable Goods Orders During March 2020

The Durable Goods Orders report for March 2020 was released by the Commerce Department this morning:

================

Predicted: -11.7%
  • Actual: $213,184,000,000 (-$35,983,000,000 [-14.441%)

================

  • February 2020 (revised): $249,167,000,000 (+$2,609,000,000 [+1.058%])
 
================


Chart: Durable Goods Orders - March 2020 Update

================

The yellow-highlighted figures represent the dollar amount of new orders for durable or hard goods for immediate or future delivery from U.S. manufacturers, along with both the dollar and month-to-month percentage change.

Examples of durable goods: cars, airplanes, computers, furniture -- items that are built to last at least three years.

================


 ================


Labels: , , , , ,


--> www.FedPrimeRate.com Privacy Policy <--

>  SITEMAP  <

Wednesday, March 25, 2020

Durable Goods Orders During February 2020

The Durable Goods Orders report for February 2020 was released by the Commerce Department this morning:

================

Predicted: -0.7%
  • Actual: $249,409,000,000 (+$2,868,000,000 [+1.163%])

================

  • January 2020 (revised): $246,541,000,000 (+$166,000,000 [+0.067%])
 
================


Chart: Durable Goods Orders - February 2020 Update


================

The yellow-highlighted figures represent the dollar amount of new orders for durable or hard goods for immediate or future delivery from U.S. manufacturers, along with both the dollar and month-to-month percentage change.

Examples of durable goods: cars, airplanes, computers, furniture -- items that are built to last at least three years.

================


 ================

Labels: , ,


--> www.FedPrimeRate.com Privacy Policy <--

>  SITEMAP  <

Thursday, October 24, 2019

Durable Goods Orders During September 2019

The Durable Goods Orders report for September 2019 was released by the Commerce Department this morning:

================

Predicted: -0.7%
  • Actual: $248,164,000,000 (-$2,837,000,000 [-1.13%])

================

  • August 2019 (revised): $251,001,000,000 (+$673,000,000 [+0.269%])
 
================

Chart: Durable Goods Orders - September 2019 Update

================

The yellow-highlighted figures represent the dollar amount of new orders for durable or hard goods for immediate or future delivery from U.S. manufacturers, along with both the dollar and month-to-month percentage change.

Examples of durable goods: cars, airplanes, computers, furniture -- items that are built to last at least three years.

================


 ================

Labels: , ,


--> www.FedPrimeRate.com Privacy Policy <--

>  SITEMAP  <

Monday, August 26, 2019

Durable Goods Orders During July 2019

The Durable Goods Orders report for July 2019 was released by the Commerce Department this morning:

Predicted: +1.2%
Actual: $250,380,000,000 (+$5,031,000,000 [+2.051%])

================

  • June 2019: $245,349,000,000 (+$4,426,000,000 [+1.837%])
 
================

Chart: Durable Goods Orders - July 2019 Update

================

The yellow-highlighted figures represent the dollar amount of new orders for durable or hard goods for immediate or future delivery from U.S. manufacturers, along with both the dollar and month-to-month percentage change.

Examples of durable goods: cars, airplanes, computers, furniture -- items that are built to last at least three years.


Labels: , ,


--> www.FedPrimeRate.com Privacy Policy <--

>  SITEMAP  <

Friday, August 24, 2018

Durable Goods Orders During July 2018

The Durable Goods Orders report for July 2018 was released by the Commerce Department this morning:

Predicted: -0.8%
Actual: $246,852,000,000 (-$4,253,000,000 [-1.694%])

================

  • June 2018: $251,105,000,000 (+$1,731,000,000 [+0.694%])
 
================


Durable Goods Orders - July 2018 Update

================

The yellow-highlighted figures represent the dollar amount of new orders for durable or hard goods for immediate or future delivery from U.S. manufacturers, along with both the dollar and month-to-month percentage change.

Examples of durable goods: cars, airplanes, computers, furniture -- items that are built to last at least three years.


Labels: , ,


--> www.FedPrimeRate.com Privacy Policy <--

>  SITEMAP  <

Thursday, July 26, 2018

Durable Goods Orders During June 2018

The Durable Goods Orders report for June 2018 was released by the Commerce Department this morning:

Predicted: +3.2%
Actual: $251,884,000,000 (+$2,482,000,000 [+0.995%])

================

  • May 2018: $249,402,000,000 (-$700,000,000 [-0.283%])
 
================

Durable Goods Orders - June 2018 Update

================

The yellow-highlighted figures represent the dollar amount of new orders for durable or hard goods for immediate or future delivery from U.S. manufacturers, along with both the dollar and month-to-month percentage change.

Examples of durable goods: cars, airplanes, computers, furniture -- items that are built to last at least three years.


Labels: , ,


--> www.FedPrimeRate.com Privacy Policy <--

>  SITEMAP  <

Wednesday, June 27, 2018

Durable Goods Orders During May 2018

The Durable Goods Orders report for May 2018 was released by the Commerce Department this morning:

Predicted: -0.6%
Actual: -0.56%

================


================

The yellow-highlighted figure represents the month-to-month change in new orders for durable or hard goods for immediate or future delivery from U.S. manufacturers. Examples of durable goods: cars, airplanes, computers, furniture -- items that are built to last at least three years.

The "predicted" figure is what economists were expecting, while the "actual" is the true or real figure. The Durable Goods Orders report is produced by the Commerce Department.


Labels: , ,


--> www.FedPrimeRate.com Privacy Policy <--

>  SITEMAP  <

Friday, May 25, 2018

Durable Goods Orders During April 2018

The Durable Goods Orders report for April 2018 was released by the Commerce Department this morning:

Predicted: -1.2%
Actual: -1.655%

================

  • Previous month (revised): +2.698%

  • Change from 12 months previous: +7.724%
================

Durable Goods Orders - April 2018
================

The yellow-highlighted figure represents the month-to-month change in new orders for durable or hard goods for immediate or future delivery from U.S. manufacturers. Examples of durable goods: cars, airplanes, computers, furniture -- items that are built to last at least three years.

The "predicted" figure is what economists were expecting, while the "actual" is the true or real figure. The Durable Goods Orders report is produced by the Commerce Department.


Labels: , ,


--> www.FedPrimeRate.com Privacy Policy <--

>  SITEMAP  <

Friday, March 23, 2018

Durable Goods Orders During February 2018

The Durable Goods Orders report for February 2018 was released by the Commerce Department this morning:

Predicted: +1.7%
Actual: +3.1%

================

  • Previous month (revised): -3.5%

  • Change from 12 months previous: +8.9%
================

Durable Goods Orders - February 2018

================

The yellow-highlighted figure represents the month-to-month change in new orders for durable or hard goods for immediate or future delivery from U.S. manufacturers. Examples of durable goods: cars, airplanes, computers, furniture -- items that are built to last at least three years.

The "predicted" figure is what economists were expecting, while the "actual" is the true or real figure. The Durable Goods Orders report is produced by the Commerce Department.


Labels: , ,


--> www.FedPrimeRate.com Privacy Policy <--

>  SITEMAP  <

Friday, January 26, 2018

Durable Goods Orders During December 2017

The Durable Goods Orders report for December 2017 was released by the Commerce Department this morning:

Predicted: +0.6%
Actual: +2.9%

================

  • Previous month (revised): +1.7%

  • Change from 12 months previous: +11.5%
================

Durable Goods Orders - December 2017

================

The yellow-highlighted figure represents the month-to-month change in orders for durable or hard goods for immediate or future delivery from U.S. manufacturers. Examples of durable goods: cars, airplanes, computers, furniture -- items that are built to last at least three years.

The "predicted" figure is what economists were expecting, while the "actual" is the true or real figure. The Durable Goods Orders report is produced by the Commerce Department.


Labels: , ,


--> www.FedPrimeRate.com Privacy Policy <--

>  SITEMAP  <

Friday, December 22, 2017

Durable Goods Orders During November 2017

The Durable Goods Orders report for November 2017 was released by the Commerce Department this morning:

Predicted: +2.0%
Actual: +1.3%

================

  • Previous month (revised): -0.4%

  • Change from 12 months previous: +8.2%
================

Durable Goods Orders - November 2017

================

The yellow-highlighted figure represents the month-to-month change in orders for durable or hard goods for immediate or future delivery from U.S. manufacturers. Examples of durable goods: cars, airplanes, computers, furniture -- items that are built to last at least three years.

The "predicted" figure is what economists were expecting, while the "actual" is the true or real figure. The Durable Goods Orders report is produced by the Commerce Department.

Click here to view the full Commerce Department report (PDF).


Labels: , ,


--> www.FedPrimeRate.com Privacy Policy <--

>  SITEMAP  <

Wednesday, October 25, 2017

Durable Goods Orders During September 2017

The Durable Goods Orders report for September 2017 was released by the Commerce Department this morning:

Predicted: +1.0%
Actual: +2.2%

================

  • Previous month (revised): +2.0%

  • Change from 12 months previous: +8.3%
================

The yellow-highlighted figure represents the month-to-month change in orders for durable or hard goods for immediate or future delivery from U.S. manufacturers. Examples of durable goods: cars, airplanes, computers, furniture -- items that are built to last at least three years.

The "predicted" figure is what economists were expecting, while the "actual" is the true or real figure. The Durable Goods Orders report is produced by the Commerce Department.

Click here to view the full Commerce Department report (PDF).


Labels: , ,


--> www.FedPrimeRate.com Privacy Policy <--

>  SITEMAP  <

Wednesday, September 27, 2017

Durable Goods Orders During August 2017

The Durable Goods Orders report for August 2017 was released by the Commerce Department this morning:

Predicted: +1.5%
Actual: +1.7%

================

  • Previous month: -6.8%

  • Change from 12 months previous: +5.1%
================

The yellow-highlighted figure represents the month-to-month change in orders for durable or hard goods for immediate or future delivery from U.S. manufacturers. Examples of durable goods: cars, airplanes, computers, furniture -- items that are built to last at least three years.

The "predicted" figure is what economists were expecting, while the "actual" is the true or real figure. The Durable Goods Orders report is produced by the Commerce Department.

Click here to view the full Commerce Department report (PDF).


Labels: , ,


--> www.FedPrimeRate.com Privacy Policy <--

>  SITEMAP  <

bing

bing


SCAMS!

FedPrimeRate.com
Entire Website © 2024 FedPrimeRate.comSM


This website is neither affiliated nor associated with The United States Federal Reserve
in any way. Information in this website is provided for educational purposes only. The owners
of this website make no warranties with respect to any and all content contained within this
website. Consult a financial professional before making important decisions related to any
investment or loan product, including, but not limited to, business loans, personal loans,
education loans, first or second mortgages, credit cards, car loans or any type of insurance.