.comment-link {margin-left:.6em;}

Economy

Economic Data (USA)

Saturday, April 29, 2023

Consumer Sentiment: Final Results for April 2023

The University of Michigan's Index of Consumer Sentiment (ICS) - Final Results for April 2023 was released today:

Predicted: 64.0
  • Actual: 63.5
=========

  • Change from Previous Month: +2.42% (+1.5 points)

  • Change from 12 Months Previous: -2.61% (-1.7 points)

=========

  • Final ICS Reading for March 2023: 62.0

  • Final ICS Reading for April 2022: 65.2

=========

From Today's Report:

"...Consumer sentiment was little changed this month, inching up less than two index points from March. Buying conditions for durables improved 11% primarily on the basis of easing perceptions of unaffordability. Despite the increasingly negative news on business conditions heard by consumers, their short and long-run economic outlook improved modestly from last month. These improvements were balanced by worsening assessments of personal finances due to higher expenses, reflecting the ongoing pain stemming from continued high prices..."

=========

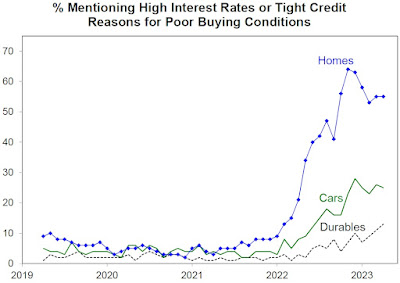
Percent Mentioning High Interest Rates or Tight Credit as Reasons for Poor Buying Conditions
CHART: Percent Mentioning High Interest Rates
or Tight Credit as Reasons
for Poor Buying Conditions
 
=========


The ICS is derived from the following five survey questions:


  1. "We are interested in how people are getting along financially these days. Would you say that you (and your family living there) are better off or worse off financially than you were a year ago?"


  2. "Now looking ahead, do you think that a year from now you (and your family living there) will be better off financially, or worse off, or just about the same as now?"


  3. "Now turning to business conditions in the country as a whole, do you think that during the next twelve months we'll have good times financially, or bad times, or what?"


  4. "Looking ahead, which would you say is more likely: that in the country as a whole we'll have continuous good times during the next five years or so, or that we will have periods of widespread unemployment or depression, or what?"


  5. "About the big things people buy for their homes, such as furniture, a refrigerator, stove, television, and things like that. Generally speaking, do you think now is a good or bad time for people to buy major household items?"

=========


=========

The ICS uses a 1966 baseline, i.e. for 1966, the ICS = 100. So any number that is below the 1966 baseline of 100 means that the folks who were polled recently aren't as optimistic about the U.S. economy as those polled back in 1966.

The ICS is similar to the Consumer Confidence Index in that they both measure consumer attitudes and offer valuable insight into consumer spending.

=========

The "predicted" figure is what economists were expecting, while the "actual" is the true or real figure.

=========


=========


Labels: , , , , , ,


--> www.FedPrimeRate.com Privacy Policy <--

>  SITEMAP  <

Friday, April 28, 2023

Employment Cost Index for Q1, 2023

Employment Cost Index (ECI) for the first quarter of 2023 was released by The Labor Department's Bureau of Labor Statistics this morning:

Predicted: +1.1%
Actual: +1.2%


  • Reading from previous quarter: +1.1%
     
  • Change from 12 months previous (Y/Y): +4.8%


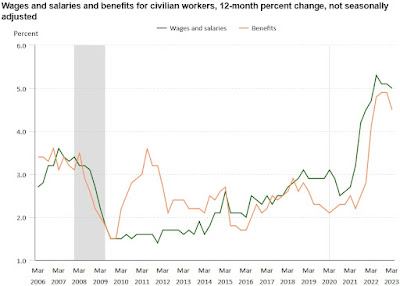
The yellow-highlighter figure represents the seasonally adjusted, quarter-to-quarter change for the ECI, which is the Labor Department's broadest measure of employee-compensation costs, and includes wages, salaries and benefits.

==================

  • Wages and Salaries: +1.2%

  • Change from 12 months previous (Y/Y): +5.0% 

==================

  • Benefits: +1.2%

  • Change from 12 months previous (Y/Y): +4.5% 

==================


From the Labor Department website:


"...The Employment Cost Index (ECI) measures the change in the cost of labor, free from the influence of employment shifts among occupations and industries..."

==================


CHART: Wages and Salaries and Benefits for Civilian Workers 12 Month Percent Change Not Seasonally Adjusted - First Quarter, 2023 UPDATE
CHART: Wages and Salaries and Benefits
for Civilian Workers
12 Month Percent Change
Not Seasonally Adjusted
 First Quarter, 2023 UPDATE

==================


==================

Labels: , , , , , , , , , , ,


--> www.FedPrimeRate.com Privacy Policy <--

>  SITEMAP  <

PCE Price Index + Personal Income + Consumer Spending Report for March 2023

The Commerce Department's Bureau of Economic Analysis (BEA) released its report on The PCE Price Index, Consumer Spending and Personal Income for March 2023:

=============

Consumer Spending (Personal Consumption Expenditures)

Predicted: FLAT
  • Actual: FLAT
  • Actual: (2012 Chained* Dollars): FLAT
=============

Personal Income

Predicted: +0.3
  • Actual: +0.3%
=============

  • Disposable Personal Income, Current Dollars: +0.4%
  • Disposable Personal Income (2012 Chained* Dollars): +0.3%

=============

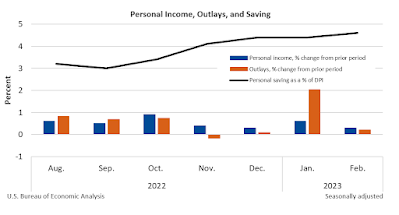
The above highlighted percentages represent the month-to-month change in Consumer Spending (aka Personal Consumption Expenditures), Personal Income and Disposable Personal Income for the entire United States.

=============

Personal Consumption Expenditures (PCE) Price Index
Predicted: +0.2%
Actual: +0.1% 

  • Change from 12 months previous: +4.2%
=====================

Core PCE Price Index
( = PCE Price Index minus food and energy)
Predicted: 0.3%
Actual: +0.3%

  • Change from 12 months previous: +4.6%
=====================

The yellow-highlighted percentages represent the month-to-month change in the prices associated with domestic personal consumption.  The PCE Price Index is different from the Consumer Price Index (CPI) in that it is a very broad measure of the prices associated with domestic products and services, while the CPI measures a more limited fixed basket of goods and services.

The broad nature of the PCE Price Index is key to why it is the Federal Reserve's preferred measure of inflation.  The Federal Open Market Committee (FOMC) pays very close attention to it.

=====================

The "predicted" figures are what economists were expecting, while the "actual" figures are the true or real figure.


=====================

 =====================

*Chained dollars is a method of adjusting real dollar amounts for inflation over time, so as to allow comparison of figures from different years. The Commerce Department introduced the chained-dollar measure in 1996. Chained dollars generally reflect dollar figures computed with 2012 as the base year.

Labels: , , , , , , , , , , ,


--> www.FedPrimeRate.com Privacy Policy <--

>  SITEMAP  <

Thursday, April 27, 2023

New Unemployment Insurance Claims for The Week of April 22, 2023

Jobless Claims
Jobless Claims

Earlier today, the Labor Department released its weekly report on New Jobless Insurance Claims for the week that ended on April 22, 2023:

====================

Predicted: 245,000

  • Actual: 230,000
====================

The yellow-highlighted figure represents the number of first-time claims for unemployment benefits for the entire United States. The "predicted" figure is what economists were expecting, while the "actual" is the true or real figure.

  • Previous Week (revised): 246,000
  • 4-Week Moving Average: 236,000

====================

Labels: , , , , , , ,


--> www.FedPrimeRate.com Privacy Policy <--

>  SITEMAP  <

Gross Domestic Product (GDP): First Estimate for Q1, 2023

Earlier this morning, the Commerce Department's Bureau of Economic Analysis (BEA) released its first estimate for U.S. Real Gross Domestic Product (GDP) for the first quarter of 2023:

============

Predicted: 1.5%

  • Actual: +1.1%

The yellow-highlighted percentage represents the first estimate of the quarter-to-quarter change for Real Gross Domestic Product for the entire United States.

============
 
 
============

The GDP is a very broad measure of economic activity for the entire United States, covering all sectors of the economy. The Commerce Department defines real GDP as, "the output of goods and services produced by labor and property located in the United States."

============

CHART: Personal Income + Outlays + Saving - Q1 2023 UPDATE
CHART: Personal Income
+ Outlays + Saving - Q1 2023 UPDATE

Labels: , , , , , , , , , , , ,


--> www.FedPrimeRate.com Privacy Policy <--

>  SITEMAP  <

Wednesday, April 26, 2023

Crude Oil Inventories Report for Week of April 21, 2023

Crude Oil Inventories


The U.S. Crude Oil Inventories report for the week that ended on April 21, 2023 was released this morning:

-- Change from Last Week: -5,100,000 Barrels

-- Change from A Year Ago (Y/Y): +46,500,000 Barrels

-- Current U.S. Crude Oil Stocks: 460,900,000 Barrels

Diminishing crude oil inventories often translate to higher crude oil and fuel prices (and vice versa), but not always.

The report is produced by the U.S. Energy Information Administration (EIA).

Labels: , , , , , , ,


--> www.FedPrimeRate.com Privacy Policy <--

>  SITEMAP  <

Consumer Confidence Index (CCI) for April 2023

Consumer Confidence Index® (CCI) for this month (April 2023) was released by The Conference Board® this morning:

================

Predicted: 104.0
  • Actual: 101.3

================

Previous Month (revised): 104.0

  • Change from Previous Month: -2.6% (-2.7 points)
================

The "predicted" figure is what economists were expecting, while the "actual" is the true or real figure.

From Today's Report:

"...The Expectations Index, based on consumers’ short-term outlook for income, business, and labor market conditions fell to 68.1 (1985=100) from 74.0. The Expectations Index has now remained below 80 -- the level associated with a recession within the next year -- every month since February 2022, with the exception of a brief uptick in December 2022. The survey was fielded from April 3, about three weeks after the bank failures in the United States, to April 19.

'While consumers’ relatively favorable assessment of the current business environment improved somewhat in April, their expectations fell and remain below the level which often signals a recession looming in the short-term,' said Ataman Ozyildirim, Senior Director, Economics at The Conference Board. 'Consumers became more pessimistic about the outlook for both business conditions and labor markets. Compared to last month, fewer households expect business conditions to improve and more expect worsening of conditions in the next six months. They also expect fewer jobs to be available over the short term. April’s decline in consumer confidence reflects particular deterioration in expectations for consumers under 55 years of age and for households earning $50,000 and over.'

'Meanwhile, April’s results show consumer inflation expectations over the next 12 months remain essentially unchanged from March at 6.2 percent, although that level is down substantially from the peak of 7.9% reached last year, it is still elevated. Overall purchasing plans for homes, autos, appliances, and vacations all pulled back in April, a signal that consumers may be economizing amid growing pessimism.'..."

Every month, The Conference Board sends a questionnaire to 5,000 U.S. households. Survey participants are polled about their feelings regarding the U.S. economy, current and future, and about their own fiscal circumstances. On average, 3,500 participants complete and return the 5-question survey.

  • The baseline "100" score for the CCI is associated with 1985 survey data.


When consumers feel good about the economy, they tend to do more spending, and vice versa.

Based in New York City, The Conference Board is a private, not-for-profit organization with a mission to, "create and disseminate knowledge about management and the marketplace to help businesses strengthen their performance and better serve society."

The CCI is usually released on the last Tuesday of the month.

================   

 CHART: Consumer Confidence Index (CCI)
 April 2023 Update

================


Labels: , , , , , , , , , , ,


--> www.FedPrimeRate.com Privacy Policy <--

>  SITEMAP  <

Thursday, April 20, 2023

Leading Economic Index for March 2023

The Conference Board® released its Leading Economic Index® (LEI) for March 2023 this morning:

==============

Index for March 2023: 108.4 (The baseline 100 score is associated with 2016 data.)

==============

Predicted: -0.5%
  • Actual: -1.185% (-1.3 points)

==============

  • LEI for February 2023: 109.7

  • LEI for January 2023: 110.2

  • LEI for December 2022: 110.7

  • LEI for November 2022: 111.5

  • LEI for October 2022: 112.5

  • LEI for September 2022: 113.5

  • LEI for August 2022: 116.4

  • LEI for July 2022: 116.4

  • LEI for June 2022: 117.1

  • LEI for May 2022: 117.9

  • LEI for April 2022: 118.7

  • LEI for March 2022: 119.3

  • LEI for February 2022: 119.4

  • LEI for January 2022: 118.5

==============

The yellow-highlighted percentage is the month-to-month change for the index.  The "predicted" figure is what economists were expecting, while the "actual" is the true or real figure.

The LEI is a composite of 10 of the nation's economic data releases that's put together by The Conference Board. Statistically, the components listed below have shown a significant increase or decrease before national economic upturns or downturns:

  1. The Standard + Poor's 500 Index

  2. Average weekly claims for unemployment insurance

  3. Building permits for new private housing

  4. The interest rate spread between the yield on the benchmark 10-Year Treasury Note and Federal Funds

  5. ISM® Index of New Orders

  6. Manufacturer's new orders for consumer goods or materials

  7. Manufacturers' new orders, non-defense capital goods excluding aircraft orders

  8. Average weekly manufacturing hours

  9. Average consumer expectations for business conditions

  10. Leading Credit Index™

==============
 
CHART: Leading Economic Index 6-Month Growth Rate with Warning + Recession Signals - March 2023 UPDATE

CHART: Leading Economic Index
6-Month Growth Rate
with Warning + Recession Signals
 March 2023 UPDATE
 
==============
 
From Today's Report:

"...'The U.S. LEI fell to its lowest level since November of 2020, consistent with worsening economic conditions ahead,' said Justyna Zabinska-La Monica, Senior Manager, Business Cycle Indicators, at The Conference Board. 'The weaknesses among the index’s components were widespread in March and have been so over the past six months, which pushed the growth rate of the LEI deeper into negative territory.

Only stock prices and manufacturers’ new orders for consumer goods and materials contributed positively over the last six months.

The Conference Board forecasts that economic weakness will intensify and spread more widely throughout the US economy over the coming months, leading to a recession starting in mid-2023.'..
."

==============
 

Labels: , , , , , , , , , ,


--> www.FedPrimeRate.com Privacy Policy <--

>  SITEMAP  <

New Unemployment Insurance Claims for The Week of April 15, 2023

Jobless Claims
Jobless Claims

Earlier today, the Labor Department released its weekly report on New Jobless Insurance Claims for the week that ended on April 15, 2023:

====================

Predicted: 245,000

  • Actual: 245,000
====================

The yellow-highlighted figure represents the number of first-time claims for unemployment benefits for the entire United States. The "predicted" figure is what economists were expecting, while the "actual" is the true or real figure.

  • Previous Week (revised): 240,000
  • 4-Week Moving Average: 239,750

====================

Labels: , , , , , , ,


--> www.FedPrimeRate.com Privacy Policy <--

>  SITEMAP  <

Friday, April 14, 2023

Producer Price Index - Final Demand (PPI-FD) for March 2023

The Producer Price Index - Final Demand (PPI-FD) for March 2023 was released this morning:

Previous Month: -0.1%
Actual: -0.5%

Change from 12 months previous:  +2.7%

=============

Below is the PPI-FD when food, energy and trade services are removed:

Previous Month: +0.2%
Actual: +0.1%

Change from 12 months previous:  +3.6%

=============

The above, yellow-highlighted percentages represent the month-to-month change in prices received by domestic producers of goods and services, for goods, services and construction in the United States, for final demand.

Final Demand = personal consumption (consumers), exports, government purchases and capital investment.

The PPI-FD is released by the Labor Department's Bureau of Labor Statistics.

The "predicted" figure is what economists were expecting, while the "actual" is the true or real figure.


 ==============

 CHART: Producer Price Index - Final Demand (PPI-FD) - March 2023 Update

CHART: Producer Price Index
 Final Demand (PPI-FD)
 March 2023 Update

==============

Labels: , , , , , , , , , , ,


--> www.FedPrimeRate.com Privacy Policy <--

>  SITEMAP  <

Thursday, April 13, 2023

Crude Oil Inventories Report for Week of April 7, 2023

Crude Oil Inventories


The U.S. Crude Oil Inventories report for the week that ended on April 7, 2023 was released this morning:

-- Change from Last Week: +600,000 Barrels

-- Change from A Year Ago (Y/Y): +48,800,000 Barrels

-- Current U.S. Crude Oil Stocks: 470,500,000 Barrels

Diminishing crude oil inventories often translate to higher crude oil and fuel prices (and vice versa), but not always.

The report is produced by the U.S. Energy Information Administration (EIA).

Labels: , , , , , , ,


--> www.FedPrimeRate.com Privacy Policy <--

>  SITEMAP  <

Consumer Price Index (CPI) for March 2023

Earlier this morning, the Labor Department's Bureau of Labor Statistics released the Consumer Price Index (CPI) for March 2023:


=========================================

CPI During March 2023: 301.836

=========================================

Consumer Price Index, Headline

Predicted: +0.3%
Actual: +0.331% (+0.996 points)

  • Change From 12 Months Ago: +4.98% (+14.332 points)


=========================================

Consumer Price Index, Minus Food and Energy (Core CPI)

Predicted: +0.1%
Actual: +0.482% (+1.465 points)

Change From 12 Months Ago: +5.59% (+16.171 points)


=========================================

The above, yellow-highlighted figures represent month-to-month change (not seasonally adjusted) in prices for a specific group of goods and services that consumers buy, and is, therefore, a very important part of the overall inflation picture for the country.

The "predicted" figure is what economists were expecting, while the "actual" is the true or real figure.

General categories that constitute the CPI are:

  • Healthcare
  • Housing
  • Clothing
  • Communications
  • Education
  • Transportation
  • Food and Beverages
  • Recreation
  • Miscellaneous Goods and Services (grooming expenses, etc.)

=========================================

CPI During  March 2022: 287.504

=========================================

 CHART: Consumer Price Index 12-Month Percentage Change -- March 2023 Update

CHART: Consumer Price Index
12-Month Percentage Change
March 2023 Update

=========================================


=========================================


Labels: , , , , , , , ,


--> www.FedPrimeRate.com Privacy Policy <--

>  SITEMAP  <

bing

bing


SCAMS!

FedPrimeRate.com
Entire Website © 2024 FedPrimeRate.comSM


This website is neither affiliated nor associated with The United States Federal Reserve
in any way. Information in this website is provided for educational purposes only. The owners
of this website make no warranties with respect to any and all content contained within this
website. Consult a financial professional before making important decisions related to any
investment or loan product, including, but not limited to, business loans, personal loans,
education loans, first or second mortgages, credit cards, car loans or any type of insurance.