.comment-link {margin-left:.6em;}

Economy

Economic Data (USA)

Friday, October 29, 2021

PCE Price Index + Personal Income + Consumer Spending Report for September 2021

The Commerce Department's Bureau of Economic Analysis (BEA) released its report on The PCE Price Index, Consumer Spending and Personal Income for September 2021:

=============

Consumer Spending (Personal Consumption Expenditures)

Predicted: +0.5%

  • Actual: +0.6%
  • Actual (2012 Chained* Dollars): +0.3%
=============

Personal Income

Predicted: -0.5%
  • Actual: -1.0%
=============

  • Disposable Personal Income, Current Dollars: -1.3%
  • Disposable Personal Income (2012 Chained* Dollars): -1.6%

=============

The above highlighted percentages represent the month-to-month change in Consumer Spending (aka Personal Consumption Expenditures), Personal Income and Disposable Personal Income for the entire United States.

=============

=====================


CHART: Month-on-Month Change in Personal Income September 2021 Update

CHART: Month-on-Month Change in Personal Income
September 2021 Update

=====================

=====================

Personal Consumption Expenditures (PCE) Price Index
Predicted: +0.3%
Actual: 0.3% 

  • Change from 12 months previous: +4.4%
=====================

Core PCE Price Index
( = PCE Price Index minus food and energy)
Predicted: +0.2%
Actual: 0.2%

  • Change from 12 months previous: +3.6%
=====================

The yellow-highlighted percentages represent the month-to-month change in the prices associated with domestic personal consumption.  The PCE Price Index is different from the Consumer Price Index (CPI) in that it is a very broad measure of the prices associated with domestic products and services, while the CPI measures a more limited fixed basket of goods and services.

The broad nature of the PCE Price Index is key to why it is the Federal Reserve's preferred measure of inflation.  The Federal Open Market Committee (FOMC) pays very close attention to it.

=====================

The "predicted" figures are what economists were expecting, while the "actual" figures are the true or real figure.


=====================

 =====================

*Chained dollars is a method of adjusting real dollar amounts for inflation over time, so as to allow comparison of figures from different years. The Commerce Department introduced the chained-dollar measure in 1996. Chained dollars generally reflect dollar figures computed with 2012 as the base year.


Labels: , , , , , , , , , , , , ,


--> www.FedPrimeRate.com Privacy Policy <--

>  SITEMAP  <

Consumer Sentiment: Final Results for October 2021

The University of Michigan's Index of Consumer Sentiment (ICS) - Final Results for October 2021 was released today:

Predicted: 71.5
  • Actual: 71.7
=========

  • Change from Previous Month: -1.511% (-1.1 points)
  • Change from 12 Months Previous: -12.347% (-10.1 points)

=========

  • Final ICS Reading for September 2021: 72.8

  • Final ICS Reading for October 2020: 81.8

=========

From today's report:

"...Consumer sentiment remained virtually unchanged from its mid month reading, gaining just 0.3 Index points, and just 0.1 Index points above the average in the past two months, and only 0.1 Index points below the April 2020 low. The positive impact of higher income expectations and the receding coronavirus has been offset by higher rates of inflation and falling confidence in government economic policies. Consumers not only anticipated the highest year-ahead inflation rate since 2008 in the October survey, consumers also expressed greater uncertainty about the year-ahead inflation rate than anytime in nearly forty years (see the chart below.) Note that this was the first major spike in inflation uncertainty recorded outside of a recession. Even uncertainty about the long-term inflation rate was the highest in more than a decade. Declining living standards due to inflation were spontaneously mentioned by one-of-every five households, concentrated among older and poorer households.

The patterns of consumers' reactions to recent rises in inflation represent the preconditions that can promote an escalating inflation rate during the year ahead. Consumers' recognition of high and rising prices is near universal, so too is their desire to reestablish spending for a more traditional holiday season. People understand that the origin of inflation has been in the upheavals in supply lines and labor markets. The acceptance of higher prices was caused by swollen savings due to the record
pandemic cash incentives as well as by Biden's new social support programs. The declining resistance to price hikes among buyers will be joined by less resistance among sellers to hiking prices that will be justified by higher materials and labor costs. These reactions promote an accelerating inflation rate until a tipping point is reached when consumers' incomes can no longer keep pace with escalating inflation. In the past inflationary era, one recession was insufficient to realign expectations; it required a series of boom-bust cycles, until the Fed's Volcker finally defeated inflation by raising interest rates to record levels..."


========= 


CHART: Inflation Uncertainty as Estimated by the Range of the Middle 50% in Inflation Expectations

CHART: Inflation Uncertainty as Estimated
by the Range of the Middle 50%
in Inflation Expectations

=========


The ICS is derived from the following five survey questions:


  1. "We are interested in how people are getting along financially these days. Would you say that you (and your family living there) are better off or worse off financially than you were a year ago?"


  2. "Now looking ahead, do you think that a year from now you (and your family living there) will be better off financially, or worse off, or just about the same as now?"


  3. "Now turning to business conditions in the country as a whole, do you think that during the next twelve months we'll have good times financially, or bad times, or what?"


  4. "Looking ahead, which would you say is more likely: that in the country as a whole we'll have continuous good times during the next five years or so, or that we will have periods of widespread unemployment or depression, or what?"


  5. "About the big things people buy for their homes, such as furniture, a refrigerator, stove, television, and things like that. Generally speaking, do you think now is a good or bad time for people to buy major household items?"

=========


=========

The ICS uses a 1966 baseline, i.e. for 1966, the ICS = 100. So any number that is below the 1966 baseline of 100 means that the folks who were polled recently aren't as optimistic about the U.S. economy as those polled back in 1966.

The ICS is similar to the Consumer Confidence Index in that they both measure consumer attitudes and offer valuable insight into consumer spending.

=========

The "predicted" figure is what economists were expecting, while the "actual" is the true or real figure.

=========


=========


Labels: , , , , , ,


--> www.FedPrimeRate.com Privacy Policy <--

>  SITEMAP  <

Thursday, October 28, 2021

Gross Domestic Product (GDP): First Estimate for Q3, 2021

Earlier this morning, the Commerce Department's Bureau of Economic Analysis (BEA) released its first estimate for U.S. Real Gross Domestic Product (GDP) for the third quarter of 2021:

============

Predicted: +2.5%

  • Actual: +2.0%

  • Real Consumer Spending, Quarter-to-Quarter Change: +1.6%

The yellow-highlighted percentage represents the first estimate of the quarter-to-quarter change for Real Gross Domestic Product for the entire United States.


============

From Today's Report:

"...Coronavirus (COVID-19) Impact on the Third-Quarter 2021 GDP Estimate

The increase in third quarter GDP reflected the continued economic impact of the COVID-19 pandemic. A resurgence of COVID-19 cases resulted in new restrictions and delays in the reopening of establishments in some parts of the country. Government assistance payments in the form of forgivable loans to businesses, grants to state and local governments, and social benefits to households all decreased. The full economic effects of the COVID-19 pandemic cannot be quantified in the GDP estimate for the third quarter because the impacts are generally embedded in source data and cannot be separately identified..."

============

The GDP is a very broad measure of economic activity for the entire United States, covering all sectors of the economy. The Commerce Department defines real GDP as, "the output of goods and services produced by labor and property located in the United States."

============

CHART: GDP - Q3 2021 - First Estimate

CHART: GDP - Q3 2021 - First Estimate

============

============

Labels: , , , , , , ,


--> www.FedPrimeRate.com Privacy Policy <--

>  SITEMAP  <

New Unemployment Insurance Claims for The Week of October 23, 2021

Jobless Claims
Jobless Claims

Earlier today, the Labor Department released its weekly report on New Jobless Insurance Claims for the week that ended on October 23, 2021:

====================

Predicted: 285,000

  • Actual: 281,000
====================

The yellow-highlighted figure represents the number of first-time claims for unemployment benefits for the entire United States. The "predicted" figure is what economists were expecting, while the "actual" is the true or real figure.

  • Previous Week (unrevised): 291,000
  • 4-Week Moving Average: 299,250

====================

From Today's Report

"...In the week ending October 23, the advance figure for seasonally adjusted initial claims was 281,000, a decrease of 10,000 from the previous week's revised level. This is the lowest level for initial claims since March 14, 2020 [the eve of the COVID-19 pandemic in the USA] when it was 256,000. The previous week's level was revised up by 1,000 from 290,000 to 291,000. The 4-week moving average was 299,250, a decrease of 20,750 from the previous week's revised average. This is the lowest level for this average since March 14, 2020 when it was 225,500. The previous week's average was revised up by 250 from 319,750 to 320,000..."


====================


====================


Labels: , , , , , , , , , , ,


--> www.FedPrimeRate.com Privacy Policy <--

>  SITEMAP  <

Tuesday, October 26, 2021

Consumer Confidence Index (CCI) for October 2021

The Consumer Confidence Index® (CCI) for this month (October 2021) was released by The Conference Board® this morning:

================

Predicted: 110.0
  • Actual: 113.8

================

Previous Month (revised): 109.8

  • Change from Previous Month: +3.643% (+4.0 points)
================

The "predicted" figure is what economists were expecting, while the "actual" is the true or real figure.

From Today's Report:

"...'Consumer confidence improved in October, reversing a three-month downward trend as concerns about the spread of the Delta variant eased,' said Lynn Franco, Senior Director of Economic Indicators at The Conference Board. 'While short-term inflation concerns rose to a 13-year high, the impact on confidence was muted. The proportion of consumers planning to purchase homes, automobiles, and major appliances all increased in October, a sign that consumer spending will continue to support economic growth through the final months of 2021. Likewise, nearly half of respondents (47.6%) said they intend to take a vacation within the next six months—the highest level since February 2020, a reflection of the ongoing resurgence in consumers’ willingness to travel and spend on in-person services.'..."

Every month, The Conference Board sends a questionnaire to 5,000 U.S. households. Survey participants are polled about their feelings regarding the U.S. economy, current and future, and about their own fiscal circumstances. On average, 3,500 participants complete and return the 5-question survey.

  • The baseline "100" score for the CCI is associated with 1985 survey data.

When consumers feel good about the economy, they tend to do more spending, and vice versa.

Based in New York City, The Conference Board is a private, not-for-profit organization with a mission to, "create and disseminate knowledge about management and the marketplace to help businesses strengthen their performance and better serve society."

The CCI is usually released on the last Tuesday of the month.

================

================


Labels: , , , , , , , , ,


--> www.FedPrimeRate.com Privacy Policy <--

>  SITEMAP  <

Monday, October 25, 2021

Chicago Fed National Activity Index (CFNAI) for September 2021

The Federal Reserve Bank of Chicago released its National Activity Index (CFNAI) for September 2021:

==================

Predicted: FLAT
  • Actual (CFNAI): -0.13

==================

  • Previous Month (revised): +0.05
  • 3-Month Moving Average (CFNAI-MA3): +0.25
==================


The CFNAI is a weighted average of 85 indicators of growth in national economic activity drawn from four broad categories of data:

  • Production and income;
  • Employment, unemployment, and hours;
  • Personal consumption and housing; and
  • Sales, orders, and inventories.

The "predicted" figure is what economists were expecting, while the yellow-highlighted figure is what was reported.

==================

CHART: CFNAI-MA3 with Business Cycles September 2021 Update

CHART: CFNAI-MA3 with Business Cycles
September 2021 Update

==================

CHART: Chicago Fed National Activity Monthly Index September 2021 Update

CHART: Chicago Fed National Activity Monthly Index
September 2021 Update

 ====================


From Today's Report

"...Index Suggests Slower Economic Growth In September

Led by declines in production-related indicators, the Chicago Fed National Activity Index (CFNAI) decreased to –0.13 in September from +0.05 in August. One of the four broad categories of indicators used to construct the index made a negative contribution in September, and one category deteriorated from August. The index’s three-month moving average, CFNAI-MA3, moved down to +0.25 in September from +0.38 in August..
."

==================

Understanding The CFNAI:

A zero value for the monthly index has been associated with the national economy expanding at its historical trend (average) rate of growth; negative values with below-average growth (in standard deviation units); and positive values with above-average growth.

Periods of economic expansion have historically been associated with values of the CFNAI-MA3 above -0.70 and the CFNAI Diffusion Index above -0.35. Conversely, periods of economic contraction have historically been associated with values of the CFNAI-MA3 below -0.70 and the CFNAI Diffusion Index below -0.35.

An increasing likelihood of a period of sustained increasing inflation has historically been associated with values of the CFNAI-MA3 above +0.70 more than two years into an economic expansion. Similarly, a substantial likelihood of a period of sustained increasing inflation has historically been associated with values of the CFNAI-MA3 above +1.00 more than two years into an economic expansion.

==================


==================


Labels: , , , , , , , , , , , , , , , , ,


--> www.FedPrimeRate.com Privacy Policy <--

>  SITEMAP  <

Thursday, October 21, 2021

New Unemployment Insurance Claims for The Week of October 16, 2021

Jobless Claims
Jobless Claims

Earlier today, the Labor Department released its weekly report on New Jobless Insurance Claims for the week that ended on October 16, 2021:

====================

Predicted: 285,000

  • Actual: 290,000
====================

The yellow-highlighted figure represents the number of first-time claims for unemployment benefits for the entire United States. The "predicted" figure is what economists were expecting, while the "actual" is the true or real figure.

  • Previous Week (unrevised): 296,000
  • 4-Week Moving Average: 319,750

====================

From Today's Report

"...The 4-week moving average was 319,750, a decrease of 15,250 from the previous week's revised average. This is the lowest level for this average since March 14, 2020 [the eve of the COVID-19 pandemic in the USA when it was 225,500. The previous week's average was revised up by 750 from 334,250 to 335,000..."


====================


====================


Labels: , , , , , , , , , , ,


--> www.FedPrimeRate.com Privacy Policy <--

>  SITEMAP  <

Wednesday, October 20, 2021

Crude Oil Inventories Report for Week of October 15, 2021

Crude Oil Inventories

The U.S. Crude Oil Inventories report for the week that ended on October 15, 2021 was released this morning:

-- Change from Last Week: -400,000 Barrels

-- Change from A Year Ago (Y/Y): -61,600,000 Barrels

-- Current U.S. Crude Oil Stocks: 426,500,000 Barrels

Diminishing crude oil inventories often translate to higher crude oil prices (and vice versa), but not always.

The report is produced by the U.S. Energy Information Administration (EIA).


Labels: , , , , , , , , , ,


--> www.FedPrimeRate.com Privacy Policy <--

>  SITEMAP  <

Tuesday, October 19, 2021

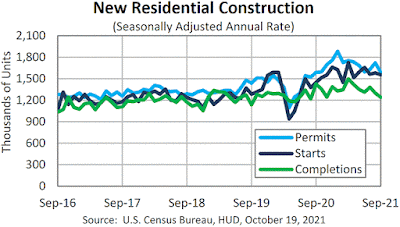
Housing Starts During September 2021

The U.S. Commerce Department this morning released its Housing Starts report for September 2021:

---------------------------------------------------

Housing Starts:
Predicted: 1,600,000
Actual: 1,555,000

Change From Previous Month: -1.582% (-25,000 New Units)
Change From One Year Previous: +7.39% (+107,000 New Units)

---------------------------------------------------

Building Permits:
Predicted: 1,600,000
Actual: 1,589,000

Change From Previous Month: -7.67% (-132,000 New permits)
Change From One Year Previous: Flat / No Change  (No Y/Y Change in New Permits)

----------------------------------------------------

Housing Starts: The top, yellow-highlighted figure is a measure of initial construction of single and multi-family residential units in the United States for the indicated month. Seasonally adjusted annual rate. The "predicted" figure is what economists were expecting, while the "actual" is the true or real figure.

If you're wondering about the demand for new homes in the United States, or about the American residential construction industry in general, then you should pay attention to the monthly Housing Starts report. This report also offers insight into specific types of consumer spending: when housing starts are up, demand for the stuff that a consumer would purchase for a new home (large appliances, consumer electronics, furniture, etc.) tends to also rise -- and vice versa.


=================


CHART: Housing Starts - September 2021 Update

CHART: Housing Starts - September 2021 Update

=================


================


Labels: , , , , , , , ,


--> www.FedPrimeRate.com Privacy Policy <--

>  SITEMAP  <

Monday, October 18, 2021

Industrial Production + Manufacturing + Capacity Utilization During September 2021

The Industrial Production, Manufacturing and Capacity Utilization numbers for September 2021 were released by the Federal Reserve this morning:

Industrial Production:
Predicted: FLAT
Actual: -1.3%

Manufacturing:
Predicted: FLAT
Actual: -0.7%

The yellow-highlighted percentages represent the month-to-month change in manufacturing, and physical output from mining operations, utility plants and factories for the entire United States.

Capacity Utilization Rate:
Predicted: 75.0%
Actual: 75.2

The Capacity Utilization Rate represents the use of available resources at mining operations, utility plants and factories for the entire United States last month.

The "predicted" figures are what economists were expecting, while the "actual" is the true or real figure.

From Today's Report:

"...Industrial production fell 1.3 percent in September after moving down 0.1 percent in August; output was previously reported to have risen 0.4 percent in August. In September, manufacturing output decreased 0.7 percent: The production of motor vehicles and parts fell 7.2 percent, as shortages of semiconductors continued to hobble operations, while factory output elsewhere declined 0.3 percent. The output of utilities dropped 3.6 percent, as demand for cooling subsided after a warmer-than-usual August. Mining production fell 2.3 percent.

The lingering effects of Hurricane Ida more than accounted for the drop in mining in September; they also contributed 0.3 percentage point to the drop in manufacturing. Overall, about 0.6 percentage point of the drop in total industrial production resulted from the impact of the hurricane.

Despite the decrease in September, total industrial production rose 4.3 percent at an annual rate for the third quarter as a whole, its fifth consecutive quarter with a gain of at least 4 percent.

At 100.0 percent of its 2017 average, total industrial production in September was 4.6 percent above its year-earlier level. Capacity utilization for the industrial sector fell 1.0 percentage point in September to 75.2 percent, a rate that is 4.4 percentage points below its long-run (1972–2020) average.
.."


 ===============


===============


Labels: , , , , , , ,


--> www.FedPrimeRate.com Privacy Policy <--

>  SITEMAP  <

Friday, October 15, 2021

U.S. Retail And Food Services Sales Report for September 2021

The Commerce Department this morning released advance estimates of U.S. Retail and Food Services Sales for September 2021:

Predicted: Unchanged
Actual: +0.735% (+$4,566,000,000)

The yellow-highlighted percentage above represents the month-to-month change in total sales receipts for retailers that sell durable and non-durable goods, and retailers that provide food and beverage services.

=================

  • Estimated Retail Sales During September 2021: $625,416,000,000
  • Change From 12 Months Previous: +13.95% (+$76,560,000,000)

=================
 
 
CHART: Retail Sales - September 2021 Update

CHART: Retail Sales - September 2021 Update

  
=================

================= 


Labels: , , , , , , , , , ,


--> www.FedPrimeRate.com Privacy Policy <--

>  SITEMAP  <

Producer Price Index - Final Demand (PPI-FD) for September 2021

The Producer Price Index - Final Demand (PPI-FD) for September 2021 was released this morning:

Predicted: +0.5%
Actual: +0.5%

Change from 12 months previous:  +8.6%

=============

Below is the PPI-FD when food, energy and trade services are removed:

Predicted: +0.5%
Actual: +0.1%

Change from 12 months previous:  +5.9%

=============

The above, yellow-highlighted percentages represent the month-to-month change in prices received by domestic producers of goods and services, for goods, services and construction in the United States, for final demand.

Final Demand = personal consumption (consumers), exports, government purchases and capital investment.

The PPI-FD is released by the Labor Department's Bureau of Labor Statistics.

The "predicted" figure is what economists were expecting, while the "actual" is the true or real figure.


==============

CHART: Producer Price Index - Final Demand (PPI-FD) 12 Month Percent Changes September 2021 Update


CHART: Producer Price Index - Final Demand (PPI-FD)
12 Month Percent Changes
September 2021 Update

 ==============


Labels: , , , , , , , , , ,


--> www.FedPrimeRate.com Privacy Policy <--

>  SITEMAP  <

Thursday, October 14, 2021

New Unemployment Insurance Claims for The Week of October 9, 2021

Jobless Claims
Jobless Claims

Earlier today, the Labor Department released its weekly report on New Jobless Insurance Claims for the week that ended on October 9, 2021:

====================

Predicted: 300,000

  • Actual: 293,000
====================

The yellow-highlighted figure represents the number of first-time claims for unemployment benefits for the entire United States. The "predicted" figure is what economists were expecting, while the "actual" is the true or real figure.

  • Previous Week (unrevised): 329,000
  • 4-Week Moving Average: 334,250

====================

From Today's Report

"...In the week ending October 9, the advance figure for seasonally adjusted initial claims was 293,000, a decrease of 36,000 from the previous week's revised level. This is the lowest level for initial claims since March 14, 2020 [the eve of the COVID-19 pandemic in the USA] when it was 256,000..."


====================


====================


Labels: , , , , , , , , , , ,


--> www.FedPrimeRate.com Privacy Policy <--

>  SITEMAP  <

Wednesday, October 13, 2021

Consumer Price Index (CPI) for September 2021

Earlier this morning, the Labor Department's Bureau of Labor Statistics released the Consumer Price Index (CPI) for September 2021:


=========================================

CPI During September 2021: 274.310

=========================================


Predicted: +0.3%
Actual: +0.272% (+0.743 point)

  • Change From 12 Months Previous: +5.39% (+14.03 points)

=========================================

The above, yellow-highlighted figures represent the seasonally unadjusted, month-to-month change in prices for a specific group of goods and services that consumers buy, and is, therefore, a very important part of the overall inflation picture for the country.

The "predicted" figure is what economists were expecting, while the "actual" is the true or real figure.

General categories that constitute the CPI are:

  • Healthcare
  • Housing
  • Clothing
  • Communications
  • Education
  • Transportation
  • Food and Beverages
  • Recreation
  • Miscellaneous Goods and Services (grooming expenses, etc.)

=========================================

CHART: Consumer Price Index (CPI) 12 Month Percentage Change September 2021 Update
CHART: Consumer Price Index (CPI)
12 Month Percentage Change
September 2021 Update

=========================================

CPI During August 2021: 273.567

=========================================


=========================================


Labels: , , , , , , , , ,


--> www.FedPrimeRate.com Privacy Policy <--

>  SITEMAP  <

Tuesday, October 12, 2021

Job Openings and Labor Turnover Survey (JOLTS) for August 2021

The Job Openings and Labor Turnover Survey (JOLTS*) for August 2021 was released by the Labor Department this morning:

============

Job Openings

Predicted: 10,400,000
Actual:    10,439,000

  • Previous Month (revised): 11,098,000

  • One Year Previous: 6,451,000

  • Change from one year previous: +61.82% (+3,988,000)


=============

Hires: 6,322,000 

Quits: 4,270,000 (New Record High)

Total Separations §: 6,003,000 

=============

From Today's Release:


"...Job Openings

On the last business day of August, the number and rate of job openings decreased to 10.4 million (-659,000) and 6.6 percent, respectively. Job openings decreased in several industries with the largest decreases in health care and social assistance (-224,000); accommodation and food services (-178,000); and state and local government education (-124,000). Job openings increased in federal government (+22,000). The number of job openings decreased in the Northeast and Midwest regions.

Hires
In August, the number and rate of hires decreased to 6.3 million (-439,000) and 4.3 percent, respectively. Hires decreased in accommodation and food services (-240,000) and in state and local government education (-160,000). The number of hires decreased in the Midwest region.

 
Separations
Total separations includes quits, layoffs and discharges, and other separations. Quits are generally voluntary separations initiated by the employee. Therefore, the quits rate can serve as a measure of workers’ willingness or ability to leave jobs. Layoffs and discharges are involuntary separations initiated by the employer. Other separations includes separations due to retirement, death, disability, and transfers to other locations of the same firm.
 
In August, the number and rate of total separations were little changed at 6.0 million and 4.1 percent, respectively. The total separations level increased in accommodation and food services (+203,000) and in state and local government education (+57,000). The total separations level decreased in other services (-68,000) and in state and local government, excluding education (-26,000). Total separations were little changed in all four regions.
 
The number of quits increased in August to [a record high] 4.3 million (+242,000). The quits rate increased to a series high of 2.9 percent. Quits increased in accommodation and food services (+157,000); wholesale trade (+26,000); and state and local government education (+25,000). Quits decreased in real estate and rental and leasing (-23,000). The number of quits increased in the South and Midwest regions.
 
In August, the number and rate of layoffs and discharges were little changed at 1.3 million and 0.9 percent, respectively. Layoffs and discharges decreased in other services (-61,000) and in state and local government, excluding education (-22,000). Layoffs and discharges increased in state and local government education (+19,000). Layoffs and discharges were little changed in all four regions.

The number of other separations edged up in August to 390,000 (+49,000). Other separations increased in several industries with the largest increases in state and local government education (+13,000); information (+11,000); and durable goods manufacturing (+8,000). The other separations level increased in the West region..."

=============
 

CHART: Hires and Total Separations Rates August 2021 Update

CHART: Hires and Total Separations Rates
August 2021 Update

=============

§ = Here's How The Labor Department Defines Total Separations:

"Total separations includes quits, layoffs and discharges, and other separations. Total separations is referred to as turnover. Quits are generally voluntary separations initiated by the employee. Therefore, the quits rate can serve as a measure of workers’ willingness or ability to leave jobs. Layoffs and discharges are involuntary separations initiated by the employer. Other separations includes separations due to retirement, death, disability, and transfers to other locations of the same firm."

=============

=============


Labels: , , , , , , , , , , , ,


--> www.FedPrimeRate.com Privacy Policy <--

>  SITEMAP  <

Friday, October 08, 2021

Employment Situation Report for September 2021

The Employment Situation Report for September 2021 was released by The Department of Labor's Bureau of Labor Statistics this morning:

Nonfarm Payrolls (month-to-month change)
Predicted: +200,000
Actual: +194,000


U-3 Unemployment Rate (Headline)
Actual: 4.8%
Previous Month: 5.2%
12 Months Previous: 7.8%

U-6 Unemployment Rate*
Actual: 8.5%
Previous Month: 8.8%
12 Months Previous: 12.8%

Average Hourly Earnings (month-to-month change)
Predicted: +0.3%
Actual: +0.62% (+$0.19)

Average Hourly Earnings (year-on-year change)
Predicted: +3.5%
Actual: +4.576% (+$1.35)

Average Weekly Earnings (month-to-month change)
Actual: +1.2% (+$12.74)


Average Weekly Earnings (year-on-year change)
Actual: +4.576% (+$46.98)

Civilian Labor Force Participation Rate: 61.6%
Previous Month: 61.7%
12 Months Previous: 61.4%

Average Workweek
Predicted: 34.8 hours
Actual: 34.8 hours

Economist, academics, central bankers and investors pay very close attention to the monthly Employment Situation report as it offers penetrating insight as to the current and near-future state of the overall U.S. economy. If a) Americans are earning more money and b) the economy is creating new jobs, this typically translates to more money being pumped into the economy (and vice versa.)

The "predicted" figure is what economists were expecting, while the "actual" is the true or real figure.

===================

From Today's Report:

 "...The number of persons not in the labor force who currently want a job was 6.0 million in September, little changed over the month but up by 959,000 since February 2020. These individuals were not counted as unemployed because they were not actively looking for work during the last 4 weeks or were unavailable to take a job.

In September, 5.0 million persons reported that they had been unable to work because their employer closed or lost business due to the
pandemic -- that is, they did not work at all or worked fewer hours at some point in the last 4 weeks due to the pandemic. This measure is down from 5.6 million in August. Among those who reported in September that they were unable to work because of pandemic-related closures or lost business, 15.5 percent received at least some pay from their employer for the hours not worked, little changed from the prior month.

Among those not in the labor force in September, 1.6 million persons were prevented from looking for work due to the pandemic, little changed from August. (To be counted as unemployed, by definition, individuals must be either actively looking for work or on temporary layoff.)

Total nonfarm payroll employment increased by 194,000 in September. Thus far this year, monthly job growth has averaged 561,000. Nonfarm employment has increased by 17.4 million since a recent trough in April 2020 but is down by 5.0 million, or 3.3 percent, from its pre-pandemic level in February 2020. In September, notable job gains occurred in leisure and hospitality, in professional and business services, in retail trade, and in transportation and warehousing. Employment in public education declined over the month.

The change in total nonfarm payroll employment for July was revised up by 38,000, from +1,053,000 to +1,091,000, and the change for August was revised up by 131,000, from +235,000 to +366,000. With these revisions, employment in July and August combined is 169,000 higher than previously reported..."

===================


CHART: Nonfarm Payroll Employment September 2021 Update

CHART: Nonfarm Payroll Employment
September 2021 Update

===================


CHART: U-3 (Headline) Unemployment Rate September 2021 Update

CHART: U-3 (Headline) Unemployment Rate
September 2021 Update

 ===================

 * =  The U-6 Unemployment Rate is defined as:

"Total unemployed, plus all persons marginally attached to the labor force, plus total employed part time for economic reasons, as a percent of the civilian labor force plus all persons marginally attached to the labor force."


===================


 ===================


Labels: , , , , , , , , , , , , , , ,


--> www.FedPrimeRate.com Privacy Policy <--

>  SITEMAP  <

Thursday, October 07, 2021

Crude Oil Inventories Report for Week of October 1, 2021

Crude Oil Inventories

The U.S. Crude Oil Inventories report for the week that ended on October 1, 2021 was released this morning:

-- Change from Last Week: +2,300,000 Barrels

-- Change from A Year Ago (Y/Y): -72,000,000 Barrels

-- Current U.S. Crude Oil Stocks: 420,900,000 Barrels

Diminishing crude oil inventories often translate to higher crude oil prices (and vice versa), but not always.

The report is produced by the U.S. Energy Information Administration (EIA).


Labels: , , , , , , , , , ,


--> www.FedPrimeRate.com Privacy Policy <--

>  SITEMAP  <

Friday, October 01, 2021

PCE Price Index + Personal Income + Consumer Spending Report for August 2021

The Commerce Department's Bureau of Economic Analysis (BEA) released its report on The PCE Price Index, Consumer Spending and Personal Income for August 2021:

=============

Consumer Spending (Personal Consumption Expenditures)

Predicted: +0.5%

  • Actual: +0.8%
  • Actual (2012 Chained* Dollars): +0.4%
=============

Personal Income

Predicted: +0.5%
  • Actual: +0.2%
=============

  • Disposable Personal Income, Current Dollars: +0.1%
  • Disposable Personal Income (2012 Chained* Dollars): -0.3%

=============

The above highlighted percentages represent the month-to-month change in Consumer Spending (aka Personal Consumption Expenditures), Personal Income and Disposable Personal Income for the entire United States.

=============

===================== 


CHART: Month-on-Month Change in Personal Income - August 2021 Update
CHART: Month-on-Month Change in Personal Income
August 2021 Update

=====================

=====================

Personal Consumption Expenditures (PCE) Price Index
Predicted: +0.5%
Actual: 0.4% 

  • Change from 12 months previous: +4.3%
=====================

Core PCE Price Index
( = PCE Price Index minus food and energy)
Predicted: +0.5%
Actual: 0.3%

  • Change from 12 months previous: +3.6%
=====================

The yellow-highlighted percentages represent the month-to-month change in the prices associated with domestic personal consumption.  The PCE Price Index is different from the Consumer Price Index (CPI) in that it is a very broad measure of the prices associated with domestic products and services, while the CPI measures a more limited fixed basket of goods and services.

The broad nature of the PCE Price Index is key to why it is the Federal Reserve's preferred measure of inflation.  The Federal Open Market Committee (FOMC) pays very close attention to it.

=====================

The "predicted" figures are what economists were expecting, while the "actual" figures are the true or real figure.


=====================

 =====================

*Chained dollars is a method of adjusting real dollar amounts for inflation over time, so as to allow comparison of figures from different years. The Commerce Department introduced the chained-dollar measure in 1996. Chained dollars generally reflect dollar figures computed with 2012 as the base year.


Labels: , , , , , , , , , , , , ,


--> www.FedPrimeRate.com Privacy Policy <--

>  SITEMAP  <

bing

bing


SCAMS!

FedPrimeRate.com
Entire Website © 2024 FedPrimeRate.comSM


This website is neither affiliated nor associated with The United States Federal Reserve
in any way. Information in this website is provided for educational purposes only. The owners
of this website make no warranties with respect to any and all content contained within this
website. Consult a financial professional before making important decisions related to any
investment or loan product, including, but not limited to, business loans, personal loans,
education loans, first or second mortgages, credit cards, car loans or any type of insurance.