.comment-link {margin-left:.6em;}

Economy

Economic Data (USA)

Wednesday, October 31, 2018

Crude Oil Inventories Report for Week of October 26, 2018

The U.S. Crude Oil Inventories report for the week that ended on October 26, 2018 was released this morning: 

-- Change from Last Week: +3,200,000 Barrels

-- Change from Last Year (Y/Y): -28,900,000 Barrels

-- Current U.S. Crude Oil Stocks: 426,000,000 Barrels

Diminishing crude oil inventories often translate to higher crude oil prices (and vice versa), but not always.

The report is produced by the U.S. Energy Information Administration (EIA).


Labels: , , , ,


--> www.FedPrimeRate.com Privacy Policy <--

>  SITEMAP  <

Employment Cost Index for Q3, 2018

The Employment Cost Index (ECI) for the third quarter of 2018 was released by The Labor Department's Bureau of Labor Statistics this morning:

Predicted: +0.7%
Actual: +0.8%


  • Reading from previous quarter: +0.6%
     
  • Change from 12 months previous (Y/Y): +2.8%


The yellow-highlighter figure represents the seasonally adjusted, quarter-to-quarter change for the ECI, which is the Labor Department's broadest measure of employee-compensation costs, and includes wages, salaries and benefits.

==================

  • Wages and Salaries: +0.9%

  • Change from 12 months previous (Y/Y): +2.9% 

==================

  • Benefits: +0.4%

  • Change from 12 months previous (Y/Y): +2.6% 

==================


From the Labor Department website:


"...The Employment Cost Index (ECI) measures the change in the cost of labor, free from the influence of employment shifts among occupations and industries..."

==================

Employment Cost Index - Q3, 2018 Update

==================

  • The ECI report for the fourth quarter of 2018 is scheduled for release on January 31, 2019.


==================


    Labels: , , , , , , , ,


    --> www.FedPrimeRate.com Privacy Policy <--

    >  SITEMAP  <

    Tuesday, October 30, 2018

    Consumer Confidence Index (CCI) for October 2018

    The Consumer Confidence Index® (CCI) for this month (October 2018) was released by The Conference Board® this morning:

    Predicted: 136.3
    Actual: 137.9

    ================

    Previous Month (revised): 135.3.
     
    •  Change from Previous Month: +1.922% (+2.6 points)
    ==========

    The "predicted" figure is what economists were expecting, while the "actual" is the true or real figure.

    From Today's Report:

    "...'Consumer Confidence increased in October, following a modest gain in September, and remains at levels last seen in the fall of 2000 (September 2000, 142.5),' said Lynn Franco, Senior Director of Economic Indicators at The Conference Board. 'Consumers’ assessment of present-day conditions remains quite positive, primarily due to strong employment growth. The Expectations Index posted another gain in October, suggesting that consumers do not foresee the economy losing steam anytime soon. Rather, they expect the strong pace of growth to carry over into early 2019.'

    Consumers’ assessment of current conditions improved in October. The percentage of consumers saying business conditions are 'good' increased from 39.9 percent to 40.5 percent, while those claiming business conditions are 'bad' decreased from 9.6 percent to 9.2 percent. Consumers’ assessment of the labor market was also more favorable. Those claiming jobs are 'plentiful' increased from 44.1 percent to 45.9 percent, while those claiming jobs are 'hard to get' decreased from 14.1 percent to 13.2 percent.

    Consumers’ optimism about the short-term future increased further in October. The percentage of consumers expecting business conditions will improve over the next six months increased from 25.8 percent to 26.3 percent, while those expecting business conditions will worsen declined, from 8.3 percent to 7.4 percent.

    Consumers’ outlook for the labor market was somewhat mixed. The proportion expecting more jobs in the months ahead decreased from 22.1 percent to 21.9 percent, but those anticipating fewer jobs also decreased, from 11.4 percent to 10.5 percent. Regarding their short-term income prospects, the percentage of consumers expecting an improvement rose from 22.5 percent to 24.7 percent, but the proportion expecting a decrease increased from 7.6 percent to 8.5 percent..
    ."

    Every month, The Conference Board sends a questionnaire to 5,000 U.S. households. Survey participants are polled about their feelings regarding the U.S. economy, current and future, and about their own fiscal circumstances. On average, 3,500 participants complete and return the 5-question survey.

    • The baseline "100" score for the CCI is associated with 1985 survey data.

    When consumers feel good about the economy, they tend to do more spending, and vice versa.

    Based in New York City, The Conference Board is a private, not-for-profit organization with a mission to, "create and disseminate knowledge about management and the marketplace to help businesses strengthen their performance and better serve society."

    The CCI is usually released on the last Tuesday of the month.

    =====================
    =====================

      Labels: , , ,


      --> www.FedPrimeRate.com Privacy Policy <--

      >  SITEMAP  <

      Monday, October 29, 2018

      PCE Price Index + Personal Income + Consumer Spending Report for September 2018

      The Commerce Department's Bureau of Economic Analysis (BEA) released its report on The PCE Price Index, Consumer Spending and Personal Income for September 2018:

      ----------------------

      Consumer Spending (Personal Consumption Expenditures)
      Predicted: +0.4%
      Actual: +0.4%

      ----------------------

      Personal Income
      Predicted: +0.4%
      Actual: +0.2%

      ----------------------

      • Disposable Personal Income, Current Dollars:  +0.2%
      • Disposable Personal Income, 2012 Chained* Dollars +0.1% 

      ----------------------

      The highlighted percentages represent the month-to-month change in Consumer Spending (aka Personal Consumption Expenditures), Personal Income and Disposable Personal Income for the entire United States.


      =====================
      =====================

      Personal Consumption Expenditures (PCE) Price Index
      Predicted: +0.1%
      Actual: +0.1%

      • Change from 12 months previous: +2.0%
      =====================

      Core PCE Price Index
      ( = PCE Price Index minus food and energy)
      Predicted: +0.1%
      Actual: +0.2%

      • Change from 12 months previous: +2.0%
      =====================

      The yellow-highlighted percentages represent the month-to-month change in the prices associated with domestic personal consumption.  The PCE Price Index is different from the Consumer Price Index (CPI) in that it is a very broad measure of the prices associated with domestic products and services, while the CPI measures a more limited fixed basket of goods and services.

      The broad nature of the PCE Price Index is key to why it is the Federal Reserve's preferred measure of inflation.  The Federal Open Market Committee (FOMC) pays very close attention to it.

      =====================

      The "predicted" figures are what economists were expecting, while the "actual" figures are the true or real figure.


       =====================

       =====================

      *Chained dollars is a method of adjusting real dollar amounts for inflation over time, so as to allow comparison of figures from different years. The Commerce Department introduced the chained-dollar measure in 1996. Chained dollars generally reflect dollar figures computed with 2012 as the base year.


      Labels: , , , , , , , , , , ,


      --> www.FedPrimeRate.com Privacy Policy <--

      >  SITEMAP  <

      Friday, October 26, 2018

      Gross Domestic Product (GDP): First Estimate for Q3, 2018

      The U.S. Real Gross Domestic Product (GDP) "Advance" (first estimate) report for the third quarter of 2018 was released this morning by the Commerce Department's Bureau of Economic Analysis (BEA):

      Predicted: +3.3%
      Actual: +3.5%

      The yellow-highlighted figure represents the quarter-to-quarter change in real gross domestic product for the entire United States.

      The GDP is the broadest measure of economic activity in the entire United States, covering all sectors of the economy.

      The "advance" estimate is based on data that are subject to future revision.

      =============================


      Labels: , ,


      --> www.FedPrimeRate.com Privacy Policy <--

      >  SITEMAP  <

      Wednesday, October 24, 2018

      New Home Sales During September 2018

      The September 2018 New Home Sales report was released by the Commerce Department this morning:

      Predicted: 625,000
      Actual New Home Sales: 553,000

      ------------------------------------------------------

      Change from One Month Previous: -5.5%

      Change from One Year Previous: -13.2%

      ------------------------------------------------------

      Median Price for a New Home during September 2018: $320,000

      ========

      Average Price for a New Home during September 2018: $377,200


      ------------------------------------------------------

      Inventory: 7.1 months (not seasonally adjusted.)

      ------------------------------------------------------


      ================================


      Compiled jointly by the U.S. Commerce Department and the U.S. Department of Housing and Urban Development, the yellow-highlighted figure above is the seasonally adjusted and annualized number of newly-built homes with committed buyers for the indicated month.

      The "predicted" figure is what economists were expecting, while the "actual" is the true or real figure.

      The New Home Sales report is watched by economists and investors because it offers insight into the state of the U.S. housing market, and also provides data that can be used to predict sales of large household furniture and appliances like refrigerators, air conditioners, microwave ovens, etc.


      Labels: , , ,


      --> www.FedPrimeRate.com Privacy Policy <--

      >  SITEMAP  <

      Crude Oil Inventories Report for Week of October 19, 2018

      The U.S. Crude Oil Inventories report for the week that ended on October 19, 2018 was released this morning: 

      -- Change from Last Week: +6,300,000 Barrels

      -- Change from Last Year (Y/Y): -34,600,000 Barrels

      -- Current U.S. Crude Oil Stocks: 422,800,000 Barrels

      Diminishing crude oil inventories often translate to higher crude oil prices (and vice versa), but not always.

      The report is produced by the U.S. Energy Information Administration (EIA).


      Labels: , , , ,


      --> www.FedPrimeRate.com Privacy Policy <--

      >  SITEMAP  <

      Friday, October 19, 2018

      Existing Home Sales During September 2018

      The Existing Home Sales report for September 2018 was released by The National Association of Realtors® (NAR) this morning:

      Predicted: 5,300,000
      Actual: 5,150,000

      •  Change from Previous Month: -3.4%

      •  Change from One Year Previous: -4.1%
      ==========

      Inventory: 1,880,000 (4.4 months supply)

      ==========

      The yellow-highlighted, "actual" figure above represents the preliminary, seasonally adjusted annualized sales count of existing homes, co-ops and condominiums for the indicated month. The "predicted" figure is what economists were expecting, while the "actual" is the true or real figure.

      ------------------------------------------------------

      Median Price for A Used Home During September: $258,100

      Change from One Year Previous: +4.2%

      ---------

      Average Price for A Used Home During September: $296,800

      Change from One Year Previous: +2.5%

      ------------------------------------------------------ 


      ==========

      From Today's Report:


      "...Existing-home sales declined in September after a month of stagnation in August, according to the National Association of Realtors®. All four major regions saw no gain in sales activity last month.

      Total existing-home sales, https://www.nar.realtor/existing-home-sales, which are completed transactions that include single-family homes, townhomes, condominiums and co-ops, fell 3.4% from August to a seasonally adjusted rate of 5.15 million in September. Sales are now down 4.1% from a year ago (5.37 million in September 2017).

      Lawrence Yun, NAR chief economist, says rising interest rates have led to a decline in sales across all regions of the country. 'This is the lowest existing home sales level since November 2015,' he said. 'A decade’s high mortgage rates are preventing consumers from making quick decisions on home purchases. All the while, affordable home listings remain low, continuing to spur underperforming sales activity across the country.'

      The median existing-home price for all housing types in September was $258,100, up 4.2% from September 2017 ($247,600). September’s price increase marks the 79th straight month of year-over-year gains.

      Total housing inventory at the end of September decreased from 1.91 million in August to 1.88 million existing homes available for sale, and is up from 1.86 million a year ago. Unsold inventory is at a 4.4-month supply at the current sales pace, up from 4.3 last month and 4.2 months a year ago.

      Properties typically stayed on the market for 32 days in September, up from 29 days in August but down from 34 days a year ago. Forty-seven percent of homes sold in September were on the market for less than a month.

      'There is a clear shift in the market with another month of rising inventory on a year over year basis, though seasonal factors are leading to a third straight month of declining inventory,' said Yun. 'Homes will take a bit longer to sell compared to the super-heated fast pace seen earlier this year.'

      Realtor.com®’s Market Hotness Index, measuring time-on-the-market data and listings views per property, revealed that the hottest metro areas in September were Midland, Texas; Fort Wayne, Ind.; Odessa, Texas; Boston-Cambridge-Newton, Mass.; and Columbus, Ohio.

      According to Freddie Mac, the average commitment rate for a 30-year, conventional, fixed-rate mortgage increased to 4.63% in September from 4.55% in August. The average commitment rate for all of 2017 was 3.99%.

      'Rising interests rates coupled with increasing home prices are keeping first-time buyers out of the market, but consistent job gains could allow more Americans to enter the market with a steady and measurable rise in inventory,' says Yun.

      First-time buyers were responsible for 32% of sales in September, up from last month (31%) and a year ago (29%). NAR’s 2017 Profile of Home Buyers and Sellers – released in late 2017 – revealed that the annual share of first-time buyers was 34%.

      'Despite small month over month increases, the share of first-time buyers in the market continues to underwhelm because there are simply not enough listings in their price range,' said NAR President
      Elizabeth Mendenhall, a sixth-generation Realtor® from Columbia, Missouri and CEO of RE/MAX Boone Realty. 'Entry-level homes remain highly sought after, as prospective buyers are advised to contact a Realtor® as early in the buying process as possible in order to ensure buyers can act fast on listings that catch their eye.'

      All-cash sales accounted for 21% of transactions in September, up from August and a year ago (both 20%). Individual investors, who account for many cash sales, purchased 13% of homes in September, unchanged from August and down from 15% a year ago.

      Distressed sales – foreclosures and short sales – were 3% of sales in September (the lowest since NAR began tracking in October 2008), unchanged from last month and down from 4% a year ago. Two percent of September sales were foreclosures and 1% were short sales..."


      ==========


      ==========

      • The monthly Existing Home Sales report is released on or around the 25TH day of each month.
      ========

      Labels: , , , , , ,


      --> www.FedPrimeRate.com Privacy Policy <--

      >  SITEMAP  <

      Wednesday, October 17, 2018

      Crude Oil Inventories Report for Week of October 12, 2018

      The U.S. Crude Oil Inventories report for the week that ended on October 12, 2018 was released this morning: 

      -- Change from Last Week: +6,500,000 Barrels

      -- Change from Last Year (Y/Y): -40,000,000 Barrels

      -- Current U.S. Crude Oil Stocks: 416,400,000 Barrels

      Diminishing crude oil inventories often translate to higher crude oil prices (and vice versa), but not always.

      The report is produced by the U.S. Energy Information Administration (EIA).


      Labels: , , , ,


      --> www.FedPrimeRate.com Privacy Policy <--

      >  SITEMAP  <

      Tuesday, October 16, 2018

      Job Openings and Labor Turnover Survey (JOLTS) for August 2018

      The Job Openings and Labor Turnover Survey (JOLTS) for August 2018 was released by the Labor Department this morning:

      ============

      Job Openings

      Predicted: 6,905,000
      Actual:    7,136,000 (All-Time Record High*)

      • Previous Month (revised): 7,077,000

      • One Year Previous: 6,044,000

      =============

      Hires: 5,784,000

      Total Separations: 5,706,000

      =============

      The above, yellow-highlighted percentage represents the estimated number of job openings in the United States during the indicated month. The "predicted" figure is what economists were expecting, while the "actual" is the true or real figure.

      Here's how the Labor Department defines Total Separations:

      "Total separations includes quits, layoffs and discharges, and other separations. Total separations is referred to as turnover. Quits are generally voluntary separations initiated by the employee. Therefore, the quits rate can serve as a measure of workers’ willingness or ability to leave jobs. Layoffs and discharges are involuntary separations initiated by the employer. Other separations includes separations due to retirement, death, disability, and transfers to other locations of the same firm."

      =============


      Labels: , , , , , , ,


      --> www.FedPrimeRate.com Privacy Policy <--

      >  SITEMAP  <

      Industrial Production + Manufacturing + Capacity Utilization During September 2018

      The Industrial Production, Manufacturing and Capacity Utilization numbers for September 2018 were released by the Federal Reserve this morning:

      Industrial Production:
      Predicted: +0.2%
      Actual: +0.3%

      Manufacturing:
      Predicted: +0.2%
      Actual: +0.2%

      The yellow-highlighted percentages represent the month-to-month change in manufacturing, and physical output from mining operations, utility plants and factories for the entire United States.

      Capacity Utilization Rate:
      Predicted: 78.2%
      Actual: 78.1

      The Capacity Utilization Rate represents the use of available resources at mining operations, utility plants and factories for the entire United States last month.

      The "predicted" figures are what economists were expecting, while the "actual" is the true or real figure.

      From today's report:

      "...Industrial production increased 0.3 percent in September, about the same rate of change as in the previous two months. Output growth in September was held down slightly by Hurricane Florence, with an estimated effect of less than 0.1 percentage point. For the third quarter as a whole, total industrial production advanced at an annual rate of 3.3 percent. In September, manufacturing output moved up 0.2 percent for its fourth consecutive monthly increase, while the output of utilities was unchanged. The index for mining increased 0.5 percent and has moved up in each of the past eight months. At 108.5 percent of its 2012 average, total industrial production was 5.1 percent higher in September than it was a year earlier. Capacity utilization for the industrial sector was unchanged at 78.1 percent, a rate that is 1.7 percentage points below its long-run (1972–2017) average..."


      ===============


      ===============

      Labels: , , ,


      --> www.FedPrimeRate.com Privacy Policy <--

      >  SITEMAP  <

      Monday, October 15, 2018

      U.S. Retail And Food Services Sales Report for September 2018

      The Commerce Department this morning released advance estimates of U.S. Retail and Food Services Sales for September 2018:

      Predicted: +0.6%
      Actual: +0.104% (+$527,000)

      The yellow-highlighted percentage represents the month-to-month change in total sales receipts for retailers that sell durable and non-durable goods, and retailers that provide food and beverage services.

      =================

      -- Estimated Retail Sales During September 2018: $509,041,000,000

      -- Change from 12 Months Previous: +4.719% (+$22,938,000,000)

      =================


      Chart: Retail Sales - September 2018 Update
      Chart: Retail Sales - September 2018 Update


      =================

      =================


      Labels: , ,


      --> www.FedPrimeRate.com Privacy Policy <--

      >  SITEMAP  <

      Friday, October 12, 2018

      All 3 Major Stock Market Indices Lost Ground On The Week

      Summary of U.S. Markets for the Week Ending October 12, 2018:

      ===================================

      Dow Jones Industrial Average (DJIA) closed @ 25,339.99:

      - lost 1,107.06 points (-4.186%) on the week.
      - lost 1,488.40  points (-5.548%) since the October 3, 2018 record-high close (26,828.39.)

      ---------------------------

      S and P 500 Index closed @ 2,767.13:

      - lost 118.44 points (-4.105%) on the week.
      - lost 163.62 points (-5.583%) since the September 20, 2018 record-high close (2,930.75.)

      --------------------------- 

      NASDAQ Composite Index closed @ 7,496.89:

      - lost 291.56 points (-3.743%) on the week.
      - lost 612.80 points (-7.556%) since the August 29, 2018 record-high close (8,109.69.)

      ===================================

      - NYMEX Crude Oil for Future Delivery closed @ $71.34 per barrel

      - Comex Gold for December 2018 delivery closed @ $1,222.00 per troy ounce

      - In New York, a U.S. dollar buys 0.8651 euros

      - In New York, a Euro buys 1.1560 U.S. dollars

      - The United States Prime Rate is 5.25%

      - The Target Range for the Fed Funds Rate is 2.00% - 2.25%

      - The yield on the 10-Year Treasury Note is currently @ 3.15%


      ===================================

      Chart: Standard and Poor's 500 Index - October 12, 2018 Update
      Chart: Standard and Poor's 500 Index - October 12, 2018 Update

      ===================================

      Closing Currency Cross Rates - October 12, 2018
      Closing Currency Cross Rates - October 12, 2018

      ===================================


      Labels: , , , , , , , , , , ,


      --> www.FedPrimeRate.com Privacy Policy <--

      >  SITEMAP  <

      Import and Export Price Indexes for September 2018

      The Labor Department's Bureau of Labor Statistics this morning released its report on U.S. Import and Export Price Indexes for September 2018:

      Import Prices
      Predicted: +0.2%
      Actual: +0.5%

      Change From 12 Months Previous: +3.5%

      ===============

      Export Prices
      Predicted: +0.3%
      Actual: Unchanged (0.0%)

      Change From 12 Months Previous: +2.7%

      ===============
       
      The above percentages, highlighted in yellow, represent the month-to-month change in prices for:

      • Imports: the cost of goods produced in other countries and sold in the United States.
      • Exports: the cost of goods produced in the USA and sold in other countries.

      Together, these indexes offer insight into the status of inflation in the United States, and for the global economy as well. The "predicted" figure is what economists were expecting, while the "actual" is the true or real figure.


      ===============


      ===============

      Labels: , , , ,


      --> www.FedPrimeRate.com Privacy Policy <--

      >  SITEMAP  <

      Thursday, October 11, 2018

      Crude Oil Inventories Report for Week of October 5, 2018

      The U.S. Crude Oil Inventories report for the week that ended on October 5, 2018 was released this morning: 

      -- Change from Last Week: +6,000,000 Barrels

      -- Change from Last Year (Y/Y): -52,300,000 Barrels

      -- Current U.S. Crude Oil Stocks: 410,000,000 Barrels

      Diminishing crude oil inventories often translate to higher crude oil prices (and vice versa), but not always.

      The report is produced by the U.S. Energy Information Administration (EIA).


      Labels: , , , ,


      --> www.FedPrimeRate.com Privacy Policy <--

      >  SITEMAP  <

      New Unemployment Insurance Claims for The Week of October 6, 2018

      Earlier today, the Labor Department released its weekly report on New Jobless Insurance Claims for the week that ended on October 6, 2018:

      Predicted: 207,000
      Actual: 214,000

      The yellow-highlighted figure represents the number of first-time claims for unemployment benefits for the entire United States. The "predicted" figure is what economists were expecting, while the "actual" is the true or real figure.

      • Previous Week (unrevised): 207,000
      • 4-Week Moving Average: 209,500
      ========


      Labels: , , , ,


      --> www.FedPrimeRate.com Privacy Policy <--

      >  SITEMAP  <

      Consumer Price Index (CPI) for September 2018

      Earlier this morning, the Labor Department's Bureau of Labor Statistics released the Consumer Price Index (CPI) for September 2018:

      =========================================

      Predicted: +0.2%
      Actual: +0.1%

      (Change from 12 months previous: +2.3%)

      =========================================

      Below is the CPI when food and energy are removed, also known as core CPI:

      Predicted: +0.2%
      Actual: +0.1%

      (Change from 12 months previous: +2.2%)

      =========================================

      The above, yellow-highlighted figures represent the seasonally adjusted, month-to-month change in prices for a specific group of goods and services that consumers buy, and is, therefore, a very important part of the overall inflation picture for the country.

      The "predicted" figure is what economists were expecting, while the "actual" is the true or real figure.

      General categories that constitute the CPI are:

      • Healthcare
      • Housing
      • Clothing
      • Communications
      • Education
      • Transportation
      • Food and Beverages
      • Recreation
      • Miscellaneous Goods and Services (grooming expenses, etc.)

      =========================================

      Chart: Consumer Price Index (CPI) - September 2018 Update
      Chart: Consumer Price Index (CPI) - September 2018 Update

      =========================================


      =========================================

      Labels: , , , ,


      --> www.FedPrimeRate.com Privacy Policy <--

      >  SITEMAP  <

      Wednesday, October 10, 2018

      Producer Price Index - Final Demand (PPI-FD) for September 2018

      The Producer Price Index - Final Demand (PPI-FD) for September 2018 was released this morning:

      Predicted: +0.2%
      Actual: +0.2%

      Change from 12 months previous: +2.6%

      =============

      Below is the PPI-FD when food and energy are removed:

      Predicted: +0.2%
      Actual: +0.2%

      Change from 12 months previous: +2.5%

      =============

      The above, yellow-highlighted percentages represent the month-to-month change in prices received by domestic producers of goods and services, for goods, services and construction in the United States, for final demand.

      Final Demand = personal consumption (consumers), exports, government purchases and capital investment.

      The PPI-FD is released by the Labor Department's Bureau of Labor Statistics.

      The "predicted" figure is what economists were expecting, while the "actual" is the true or real figure.


      ==============


      ==============

      Labels: , , , , , ,


      --> www.FedPrimeRate.com Privacy Policy <--

      >  SITEMAP  <

      Tuesday, October 09, 2018

      NFIB Small Business Optimism Index for September 2018

      The National Federation of Independent Business® (NFIB®) released its Small Business Optimism Index (SBOI) for September 2018:

      =========

      Predicted: 108.0
      Actual: 107.9

      • Change from Previous Month: -0.827% (-0.9 point)
      • Change from 12 Months Previous: +4.757% (+4.9 points)

      =========

      The previous month's SBOI reading was 108.8.

      =========

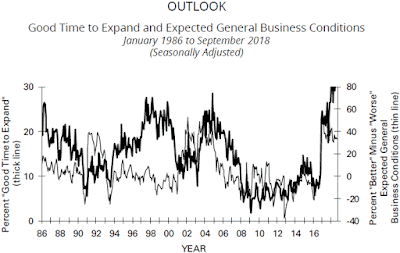
      Chart: NFIB Small Business Optimism Index - September 2018 Update
      Chart: NFIB Small Business Optimism Index - September 2018 Update

      =========

      Chart: NFIB Small Business Outlook - September 2018 Update
      Chart: NFIB Small Business Outlook - September 2018 Update

      =========

      From Today's Report (note text in bold):


      "...The NFIB Small Business Optimism Index continued its historic 23-month positive trend, with a reading of 107.9 in September, the third highest reading in the survey’s 45-year history. In the small business half of the economy, 2018 has produced 45-year record high measures of job openings, hiring plans, actual job creation, compensation increases (actual and planned), profit growth, and inventory investment.

      The September 2018 Survey Showed:

      -- Actual capital spending in the past few months rose significantly.

      -- Average employment change per firm was solid.

      -- Owners bulked up inventories.

      -- Compensation increases set a new record.


      'This is the longest streak of small business optimism in history, evidence that tax cuts and regulatory rollbacks are paying off for the economy as a whole,' said NFIB President and CEO Juanita D. Duggan. 'Our members say that business is booming and prospects continue to look bright.'

      Actual investment spending improved as prospects for the economy remain strong. Sixty percent of owners reported capital outlays, up four points from August. Of those making expenditures, 41 percent reported spending on new equipment (up two points), 26 percent acquired vehicles (up four points), and 16 percent improved or expanded facilities (down two points).

      Consumer spending temporarily slowed in August, likely producing excess inventories but has picked up again which will reverse the build-up. The net percent of owners expecting higher real sales volumes rose three points to a net 29 percent of owners. Owners reporting inventory increases rose one point to a net five percent (seasonally adjusted). Strong expectations for higher real sales translate into higher expected returns on capital investments as well as a need for more employees.

      'The economy continues to deliver a spectacular performance for one so near its record length. Small business owners continue to face labor force challenges but are increasing compensation to keep up,' said NFIB Chief Economist Bill Dunkelberg. 'With profits and investment remaining strong, our hope is that policymakers will stay the course and not screw around with success.'

      A record net 37 percent of owners reported raising overall compensation, as reported in last week’s NFIB monthly jobs report. This surpasses the previous record of a net 35 percent in May 2018. Twenty-four percent plan to increase total compensation at their firm and six percent plan reductions. Sixty-one percent of owners reported hiring or trying to hire, with 87 percent of those reporting few or no qualified workers. Thirty-eight percent of owners reported job openings they could not fill in the current period, unchanged from last month..."

       =========

      • Small business survey questions can be found at the end of today's report.
      • The baseline "100" score is associated with 1986 survey data.
      =========


      =========

      Labels: , , , , , ,


      --> www.FedPrimeRate.com Privacy Policy <--

      >  SITEMAP  <

      Friday, October 05, 2018

      Employment Situation Report for September 2018

      The Employment Situation Report for September 2018 was released by The Department of Labor's Bureau of Labor Statistics this morning:

      Nonfarm Payrolls (month-to-month change)
      Predicted: +180,000
      Actual: +134,000


      U-3 Unemployment Rate (Headline)
      Actual: 3.7%
      Previous Month: 3.9%
      12 Months Previous: 4.2%

      U-6 Unemployment Rate*
      Actual: 7.5%
      Previous Month: 7.4%
      12 Months Previous: 8.3%

      Average Hourly Earnings (month-to-month change)
      Predicted: +0.3%
      Actual: +0.295% (+$0.08)

      Average Hourly Earnings (year-on-year change)
      Predicted: +2.9%
      Actual: +2.754% (+$0.73)

      Average Weekly Earnings (month-to-month change)
      Actual: +0.295% (+$2.76)


      Average Weekly Earnings (year-on-year change)
      Actual: +3.353% (+$30.49)

      Civilian Labor Force Participation Rate: 62.7%
      Previous Month: 62.7%
      12 Months Previous: 63.0%

      Average Workweek
      Predicted: 34.5 hours
      Actual: 34.5 hours

      Economist, academics, central bankers and investors pay very close attention to the monthly Employment Situation report as it offers penetrating insight as to the current and near-future state of the overall U.S. economy. If a) Americans are earning more money and b) the economy is creating new jobs, this typically translates to more money being pumped into the economy (and vice versa.)

      The "predicted" figure is what economists were expecting, while the "actual" is the true or real figure.

      From today's report:


      "...
      In September, average hourly earnings for all employees on private nonfarm payrolls rose by 8 cents to $27.24 [+0.295%]. Over the year, average hourly earnings have increased by 73 cents, or [+2.754%]. Average hourly earnings of private-sector production and nonsupervisory employees increased by 6 cents to $22.81 [+0.264%] in September.


      The change in total nonfarm payroll employment for July was revised up from +147,000 to +165,000, and the change for August was revised up from +201,000 to +270,000. With these revisions,
      employment gains in July and August combined were 87,000 more than previously reported. (Monthly revisions result from additional reports received from businesses and government agencies since the last published estimates and from the recalculation of seasonal factors.)
      After revisions, job gains have averaged 190,000 per month over the last 3 months..." [Establishment Survey Data]
      ======

       * =  The U-6 Unemployment Rate is defined as:

      "Total unemployed, plus all persons marginally attached to the labor force, plus total employed part time for economic reasons, as a percent of the civilian labor force plus all persons marginally attached to the labor force."


      Labels: , , , , , ,


      --> www.FedPrimeRate.com Privacy Policy <--

      >  SITEMAP  <

      Thursday, October 04, 2018

      U.S. Factory Orders During August 2018

      The U.S. Census Bureau this morning released their report on Manufacturers' Shipments, Inventories and Orders -- also known as Factory Orders -- for August 2018:

      Predicted: +2.1%
      Actual: +2.313% (+$11,541,000,000)


      • August 2018 New Orders: $510,466,000,000.

      • July 2018 New Orders (revised): $498,925,000,000 (-0.536% | -$2,687,000,000)

      ========

      The yellow-highlighted percentage is the month-to-month change in orders for both durable and nondurable goods made by from U.S. manufacturers. The "predicted" figure is what economists were expecting, while the "actual" is the true or real figure.

      ======== 

      U.S. Factory Orders - August 2018 Update
      U.S. Factory Orders - August 2018 Update
       
      ======== 


      ========

      Labels: , ,


      --> www.FedPrimeRate.com Privacy Policy <--

      >  SITEMAP  <

      New Unemployment Insurance Claims for The Week of September 29, 2018

      Earlier today, the Labor Department released its weekly report on New Jobless Insurance Claims for the week that ended on September 29, 2018:

      Predicted: 213,000
      Actual: 207,000

      The yellow-highlighted figure represents the number of first-time claims for unemployment benefits for the entire United States. The "predicted" figure is what economists were expecting, while the "actual" is the true or real figure.

      • Previous Week (revised): 215,000
      • 4-Week Moving Average: 207,000
      ========


      Labels: , , , ,


      --> www.FedPrimeRate.com Privacy Policy <--

      >  SITEMAP  <

      Wednesday, October 03, 2018

      ISM Non-Manufacturing Index (NMI®) for September 2018

      Earlier today, the Institute for Supply Management (ISM®) released their Non-Manufacturing Index (NMI®) for September 2018:

      Predicted: 58.0%
      Actual: 61.6% (+3.1 points | +5.3% M/M Change)

      ==========

      Previous month: 58.5%

      ==========

      The NMI is a reliable barometer of the U.S. services sector; above 50% implies expansion, while a reading below 50% implies that the services sector contracted.

      Service Categories Include: Agriculture, Forestry, Fishing + Hunting; Mining; Utilities; Construction; Wholesale Trade; Retail Trade; Transportation + Warehousing; Information; Finance + Insurance; Real Estate, Rental + Leasing; Professional, Scientific + Technical Services; Management of Companies + Support Services; Educational Services; Health Care + Social Assistance; Arts, Entertainment + Recreation; Accommodation + Food Services; Public Administration; and Other Services (services such as Equipment + Machinery Repairing; Promoting or Administering Religious Activities; Grantmaking; Advocacy; and Providing Dry-Cleaning + Laundry Services, Personal Care Services, Death Care Services, Pet Care Services, Photofinishing Services, Temporary Parking Services, and Dating Services).

      ==========

      From today' report:

      "...Economic activity in the non-manufacturing sector grew in June for the 104TH consecutive month, say the nation’s purchasing and supply executives in the latest Non-Manufacturing ISM® Report On Business®..."

      ==========

      Here's a sampling of comments made by survey participants:

      •     '[Additional] logistics costs, both inbound and distribution, caused by increased governmental regulation, and a shortage of class-A drivers is leading to a significant increase in [the] cost of goods [sold].'
         (Accommodation and Food Services)

      •     'New residential construction market is still strong, with a good backlog of orders. Labor shortages and tariffs on materials continue to negatively weigh on earnings.'
         (Construction)

      •     'Economy continues to exhibit strength. New construction, both residential and commercial, abounds. Harvest [is] about over. Overall, results appear promising. Every day is a bit better than the last.'
         (Finance and Insurance)

      •     'Business activity has been slightly higher than normal, though pharmaceutical costs continue to put pressure on profitability.'
         (Health Care and Social Assistance)

      •     'Starting peak holiday season ramp-up, [with] heavy importing. Building inventories of finished goods, replacement parts and supplies. Outlook very positive for [the] holidays and 2019.'
         (Information)

      •     'Business generally remains strong, with new services being implemented.'
         (Management of Companies and Support Services)

      •     'Prices and supply have flattened, and tariff concerns have subsided for our business [at least for the duration of 2018]. Things seems to be stabilizing.'
         (Mining)

      •     'Overall positive outlook in the economy continues, but we are cautious due to limitations in available manpower.'
         (Professional, Scientific and Technical Services)

      •     'Business activity is up sharply due to the rush of purchase requests received prior to fiscal year 2018 funds expiring on September 30.'
         (Public Administration)

      •     'Our general state of business is strong, but there is a lot of uncertainty [about] the pending tariffs. This may cause a shift [in] production sites.'
         (Retail Trade)

      •     'Import tariffs on steel, plywood, and [other] lumber are inflating prices, which are difficult to pass along to the end user due to competitive pressures. Labor and trucking shortages are affecting the industry. Low finished goods inventory is inflating home prices and causing buyers to delay purchases.'
         (Wholesale Trade)


      ==========


      ISM Non-Manufacturing Index (NMI®) for September 2018
      ISM Non-Manufacturing Index (NMI®) for September 2018

      ==========


      Labels: , , , ,


      --> www.FedPrimeRate.com Privacy Policy <--

      >  SITEMAP  <

      Crude Oil Inventories Report for Week of September 28, 2018

      The U.S. Crude Oil Inventories report for the week that ended on September 28, 2018 was released this morning: 

      -- Change from Last Week: +8,000,000 Barrels

      -- Change from Last Year (Y/Y): -61,000,000 Barrels

      -- Current U.S. Crude Oil Stocks: 404,000,000 Barrels

      Diminishing crude oil inventories often translate to higher crude oil prices (and vice versa), but not always.

      The report is produced by the U.S. Energy Information Administration (EIA).


      Labels: , , , ,


      --> www.FedPrimeRate.com Privacy Policy <--

      >  SITEMAP  <

      Monday, October 01, 2018

      ISM Manufacturing Index for September 2018

      Earlier today, the Institute for Supply Management® (ISM®) released their Manufacturing Purchasing Manager's Index (PMI®) for September 2018:

      Predicted: 59.9%
      Actual: 59.8% (-1.5 points | -2.45% M/M Change)

      =========

      Previous month: 61.3%

      =========

      Every month, the ISM surveys purchasing and supply executives at hundreds of companies across the country who are involved in manufacturing in some form. The resulting index is watched closely by academics, economists and investors because manufacturing accounts for about 12% of U.S. Gross Domestic Product (GDP).

      The PMI is a reliable barometer of U.S. manufacturing: A PMI above 50% implies that U.S. manufacturing expanded during the month specified, while a reading below 50% implies that the made-in-the-USA sector contracted.

      =========

      From Today's Report:

      "...Economic activity in the manufacturing sector expanded in September, and the overall economy grew for the 113th consecutive month, say the nation’s supply executives in the latest Manufacturing ISM® Report On Business®..."
      =========

      The following is a sampling of quotes from a diverse pool of U.S. manufacturers:


      •     'The market is in a state of chaos with the latest round of tariffs. As an electronics original equipment manufacturer, our component prices have been impacted almost across the board. The tariffs have caused a mass rush to buy up inventories of affected products in order to minimize the long-term financial impact. This, in turn, is causing market constraints, which further drive up the cost and increase lead times.'
         (Computer and Electronic Products)

      •     'Tariffs starting to take a bite out of profitability.'
         (Chemical Products)

      •     'Business is strong and relatively stable. Tariffs are putting pressure on Chinese imports. Labor rates are increasing as it is very difficult to find help.'
         (Furniture and Related Products)

      •     'The economy's strength is holding [and] outlook for the industry is positive, although continuing margin compression in consumer packaged goods is restricting general growth momentum from the greater economy.'
         (Food, Beverage and Tobacco Products)

      •     'Still extremely strong through November; starting to see a decline for steel prices for December.'
         (Fabricated Metal Products)

      •     'General available capacity at suppliers continues to decrease, creating supply issues.'
         (Machinery)

      •     'Tariffs are creating a drag on some of our export opportunities.'
         (Plastics and Rubber Products)

      •     'Sourcing hourly workers for remote locations continues to be a challenge for both full-time and part-time opportunities. Have implemented a wide variety of recruiting techniques and suppliers to aid us in sourcing this hard-to-find talent.'
         (Paper Products)

      •     'Orders are coming in, but from a limited number of customers. The future looks very promising.'
         (Primary Metals)

      •     'Suppliers are impacted by China tariffs, [which is] delaying or cancelling manufacturing transfer projects.'
         (Miscellaneous Manufacturing)


       =========


      ISM Manufacturing Index History - September 2018 Update
      ISM Manufacturing Index History - September 2018 Update

      =========


      =========


      Labels: , , , ,


      --> www.FedPrimeRate.com Privacy Policy <--

      >  SITEMAP  <

      bing

      bing


      SCAMS!

      FedPrimeRate.com
      Entire Website © 2024 FedPrimeRate.comSM


      This website is neither affiliated nor associated with The United States Federal Reserve
      in any way. Information in this website is provided for educational purposes only. The owners
      of this website make no warranties with respect to any and all content contained within this
      website. Consult a financial professional before making important decisions related to any
      investment or loan product, including, but not limited to, business loans, personal loans,
      education loans, first or second mortgages, credit cards, car loans or any type of insurance.