2016 In American Financial Markets
- S and P 500 Index added 194.89 points (+9.535%) (chart)
- Dow Jones Industrial Average (DJIA) added 2,337.57 points (+13.415%) (chart)
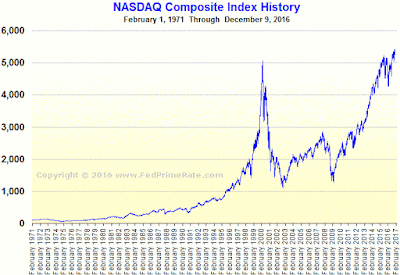
- NASDAQ Composite added 375.71 points (+7.503%) (chart)
=============
- For 2016, the average yield on the benchmark 10-Year Treasury Note was 1.84%.
- For 2016, the NYMEX WTI crude oil for future delivery rose by $16.68 (+45.032%) (chart)
=============
Bull-Market Update:
Since the March 9, 2009 bear-market low:
- S and P 500 Index: +230.928%
- Dow Jones Industrial Average (DJIA): +203.711%
- NASDAQ Composite: +324.322%
=============
 |
| Chart: S and P 500 Index |
=============
 |
| Chart: Dow Jones Industrial Average (DJIA) |
=============
 |
| Chart: NASDAQ Composite |
Labels: 2016, bull_market, bull_market_update, crude_oil, stock_market, stocks
|
--> www.FedPrimeRate.com Privacy Policy <--
CLICK HERE to JUMP to the TOP of THIS PAGE > SITEMAP < |


