.comment-link {margin-left:.6em;}

Economy

Economic Data (USA)

Wednesday, December 23, 2020

PCE Price Index + Personal Income + Consumer Spending Report for November 2020

The Commerce Department's Bureau of Economic Analysis (BEA) released its report on The PCE Price Index, Consumer Spending and Personal Income for November 2020:

=============

Consumer Spending (Personal Consumption Expenditures)

Predicted: -0.5%

  • Actual: -0.4%
  • Actual (2012 Chained* Dollars): -0.4%
=============

Personal Income

Predicted: -1.0%
  • Actual: -1.1%
=============

  • Disposable Personal Income, Current Dollars: -1.2%
  • Disposable Personal Income (2012 Chained* Dollars): -1.3%

=============

The above highlighted percentages represent the month-to-month change in Consumer Spending (aka Personal Consumption Expenditures), Personal Income and Disposable Personal Income for the entire United States.

=============

===================== 
 
 
CHART: Change in Personal Income - November 2020 Update
CHART: Change in Personal Income
November 2020 Update
 
=====================

=====================

Personal Consumption Expenditures (PCE) Price Index
Predicted: Unchanged
Actual: Unchanged 

  • Change from 12 months previous: +1.1%
=====================

Core PCE Price Index
( = PCE Price Index minus food and energy)
Predicted: Unchanged
Actual: Unchanged

  • Change from 12 months previous: +1.4%
=====================

The yellow-highlighted percentages represent the month-to-month change in the prices associated with domestic personal consumption.  The PCE Price Index is different from the Consumer Price Index (CPI) in that it is a very broad measure of the prices associated with domestic products and services, while the CPI measures a more limited fixed basket of goods and services.

The broad nature of the PCE Price Index is key to why it is the Federal Reserve's preferred measure of inflation.  The Federal Open Market Committee (FOMC) pays very close attention to it.

=====================

The "predicted" figures are what economists were expecting, while the "actual" figures are the true or real figure.


=====================

 =====================

*Chained dollars is a method of adjusting real dollar amounts for inflation over time, so as to allow comparison of figures from different years. The Commerce Department introduced the chained-dollar measure in 1996. Chained dollars generally reflect dollar figures computed with 2012 as the base year.

Labels: , , , , , , , , , , , , ,


--> www.FedPrimeRate.com Privacy Policy <--

>  SITEMAP  <

New Home Sales During November 2020

The November 2020 New Home Sales report was released by the Commerce Department this morning:

------------------------------------------------------

Predicted: 850,000
  • Actual New Home Sales: 841,000

------------------------------------------------------

  • Change from One Month Previous: -104,000 units (-11.005%)

  • Change from One Year Previous: +145,000 units (+20.833%)


------------------------------------------------------

Median Price for a New Home
during November 2020: $335,300

***************************

Average Price for a New Home
during November 2020: $390,100

------------------------------------------------------

Inventory: 286,000 (4.1 months supply at current sales rate; seasonally‐adjusted.)

------------------------------------------------------

================================


CHART: New Home Sales - November 2020 Update

CHART: New Home Sales
November 2020 Update

 ================================


================================


Compiled jointly by the U.S. Commerce Department and the U.S. Department of Housing and Urban Development, the yellow-highlighted figure above is the seasonally adjusted and annualized number of newly-built homes with committed buyers for the indicated month.

The "predicted" figure is what economists were expecting, while the "actual" is the true or real figure.

The New Home Sales report is watched by economists and investors because it offers insight into the state of the U.S. housing market, and also provides data that can be used to predict sales of large household furniture and appliances like refrigerators, air conditioners, microwave ovens, etc.


================================

================================


Labels: , , , , , , , ,


--> www.FedPrimeRate.com Privacy Policy <--

>  SITEMAP  <

Tuesday, December 22, 2020

Existing Home Sales During November 2020

The Existing Home Sales report for November 2020 was released by The National Association of Realtors® (NAR®) this morning:

Predicted: 6,500,000
Actual: 6,690,000

  •  Change from Previous Month: -2.478% (-170,000 homes)

  •  Change from One Year Previous: +25.752% (+1,370,000 homes)
==========

Inventory: 1,280,000 (2.3 months supply)

==========

The yellow-highlighted, "actual" figure above represents the preliminary, seasonally adjusted annualized sales count of existing homes, co-ops and condominiums for the indicated month. The "predicted" figure is what economists were expecting, while the "actual" is the true or real figure.

------------------------------------------------------

Median Price for A Used Home During November 2020: $310,800

Change from One Year Previous: +14.56% (+$39,500)

---------

Average Price for A Used Home During November 2020: $343,000

Change from One Year Previous: +11.291% (+$34,800)


------------------------------------------------------ 

==========


==========

From Today's Report:


"...Existing-home sales fell in November, snapping a five-month streak of month-over-month gains, according to the National Association of Realtors®. All major regions either took a step back or held steady in terms of their respective month-over-month status, but each of the four areas experienced significant year-over-year growth.

Total existing-home sales, https://www.nar.realtor/existing-home-sales, completed transactions that include single-family homes, townhomes, condominiums and co-ops, decreased 2.5% from October to a seasonally-adjusted annual rate of 6.69 million in November. However, sales in total rose year-over-year, up 25.8% from a year ago (5.32 million in November 2019).

'Home sales in November took a marginal step back, but sales for all of 2020 are already on pace to surpass last year's levels,' said
Lawrence Yun, NAR's chief economist. 'Given the COVID-19 pandemic, it's amazing that the housing sector is outperforming expectations.'

Yun notes that job recoveries have stalled in the past few months, and fast-rising coronavirus cases along with stricter lockdowns have weakened consumer confidence.

'Circumstances are far from being back to the pre-pandemic normal,' he said. 'However, the latest stimulus package and with the vaccine distribution underway, and a very strong demand for homeownership still prevalent, robust growth is forthcoming for 2021.'

The median existing-home price for all housing types in November was $310,800, up 14.6% from November 2019 ($271,300), as prices increased in every region. November's national price increase marks 105 straight months of year-over-year gains.

Total housing inventory at the end of November totaled 1.28 million units, down 9.9% from October and down 22% from one year ago (1.64 million). Unsold inventory sits at an all-time low 2.3-month supply at the current sales pace, down from 2.5 months in October and down from the 3.7-month figure recorded in November 2019.

Properties typically remained on the market for 21 days in November, seasonally even with October and down from 38 days in November 2019. Seventy-three percent of homes sold in November 2020 were on the market for less than a month.

'The positive momentum that home sellers are seeing will carry on well into the new year,' Yun predicted, citing low mortgage rates and remote-work flexibilities.

Yun's projections of a continued housing market rebound were the consensus among economic and housing experts during NAR's Real Estate Forecast Summit, held earlier this month. Industry insiders in attendance agreed that mortgage rates will hover around 3% in the coming year, and said they expect an annual median home price increase of 8.0%.

'Housing affordability, which had greatly benefitted from falling mortgage rates, are now being challenged due to record-high home prices,' Yun said. 'That could place strain on some potential consumers, particularly first-time buyers.'

First-time buyers were responsible for 32% of sales in November, equal to the percentage seen in both October 2020 and November 2019. NAR's 2020 Profile of Home Buyers and Sellers -- released last month -- revealed that the annual share of first-time buyers was 31%.

Individual investors or second-home buyers, who account for many cash sales, purchased 14% of homes in November, identical to the share recorded in October 2020 and a small decline from 16% in October 2019. All-cash sales accounted for 20% of transactions in November, up from 19% in October but unchanged from November 2019.

Distressed sales – foreclosures and short sales – represented less than 1% of sales in November, equal to October's percentage but down from 2% in November 2019.

'While we still face economic and health challenges ahead, I have zero doubt that the nation will continue to recover from this pandemic,' said NAR President Charlie Oppler, a Realtor® from Franklin Lakes, N.J., and broker/owner of Prominent Properties Sotheby's International Realty. 'Whether it's through volunteering or philanthropy, or helping a given buyer secure that dream home, Realtors® have stepped up in a major way and we will continue with those efforts in 2021 and beyond.'

According to Freddie Mac, the average commitment rate for a 30-year, conventional, fixed-rate mortgage decreased to 2.77% in November, down from 2.83% in October. The average commitment rate across all of 2019 was 3.94%.
.."

==================


==================


Labels: , , , , , , , , , , ,


--> www.FedPrimeRate.com Privacy Policy <--

>  SITEMAP  <

Consumer Confidence Index (CCI) for December 2020

The Consumer Confidence Index® (CCI) for this month (December 2020) was released by The Conference Board® this morning:

================

Predicted: 95.0
  • Actual: 88.6

================

Previous Month (revised): 92.9

  • Change from Previous Month: -4.629% (-4.3 points)
================

The "predicted" figure is what economists were expecting, while the "actual" is the true or real figure.

From Today's Report:

"...'Consumers’ assessment of current conditions deteriorated sharply in December, as the resurgence of COVID-19 remains a drag on confidence,' said Lynn Franco, Senior Director of Economic Indicators at The Conference Board. 'As a result, consumers’ vacation intentions, which had notably improved in October, have retreated. On the flip side, as consumers continue to hunker down at home, intentions to purchase appliances have risen. Overall, it appears that growth has weakened further in Q4, and consumers do not foresee the economy gaining any significant momentum in early 2021.'..."

Every month, The Conference Board sends a questionnaire to 5,000 U.S. households. Survey participants are polled about their feelings regarding the U.S. economy, current and future, and about their own fiscal circumstances. On average, 3,500 participants complete and return the 5-question survey.

  • The baseline "100" score for the CCI is associated with 1985 survey data.

When consumers feel good about the economy, they tend to do more spending, and vice versa.

Based in New York City, The Conference Board is a private, not-for-profit organization with a mission to, "create and disseminate knowledge about management and the marketplace to help businesses strengthen their performance and better serve society."

The CCI is usually released on the last Tuesday of the month.

================

================

Labels: , , , , , , , , ,


--> www.FedPrimeRate.com Privacy Policy <--

>  SITEMAP  <

Monday, December 21, 2020

Chicago Fed National Activity Index (CFNAI) for November 2020

The Federal Reserve Bank of Chicago released its National Activity Index (CFNAI) for November 2020:

==================

Predicted: +0.30
  • Actual (CFNAI): +0.27

==================

  • Previous Month (revised): +1.01
  • 3-Month Moving Average (CFNAI-MA3): +0.56
==================


The CFNAI is a weighted average of 85 indicators of growth in national economic activity drawn from four broad categories of data:

  • Production and income;
  • Employment, unemployment, and hours;
  • Personal consumption and housing; and
  • Sales, orders, and inventories.

The "predicted" figure is what economists were expecting, while the yellow-highlighted figure is what was reported.

==================

 
CHART: Chicago Fed National Activity Monthly Index November 2020 Update
CHART: Chicago Fed National Activity Monthly Index
November 2020 Update

 
==================

From Today's Report

"...Index Suggests Slower, But Still Slightly Above-Average Growth In November

Led by slower growth in employment- and production-related indicators, the Chicago Fed National Activity Index (CFNAI) declined to +0.27 in November from +1.01 in October. Three of the four broad categories of indicators used to construct the index made positive contributions in November, but all four categories decreased from October. The index’s three-month moving average, CFNAI-MA3, decreased to +0.56 in November from +0.85 in October..
."

==================

Understanding The CFNAI:

A zero value for the monthly index has been associated with the national economy expanding at its historical trend (average) rate of growth; negative values with below-average growth (in standard deviation units); and positive values with above-average growth.

Periods of economic expansion have historically been associated with values of the CFNAI-MA3 above -0.70 and the CFNAI Diffusion Index above -0.35. Conversely, periods of economic contraction have historically been associated with values of the CFNAI-MA3 below -0.70 and the CFNAI Diffusion Index below -0.35.

An increasing likelihood of a period of sustained increasing inflation has historically been associated with values of the CFNAI-MA3 above +0.70 more than two years into an economic expansion. Similarly, a substantial likelihood of a period of sustained increasing inflation has historically been associated with values of the CFNAI-MA3 above +1.00 more than two years into an economic expansion.

==================


==================

Labels: , , , , , , , , , , , , , , , ,


--> www.FedPrimeRate.com Privacy Policy <--

>  SITEMAP  <

Friday, December 18, 2020

Leading Economic Index for November 2020

The Conference Board® released its Leading Economic Index® (LEI) for November 2020 this morning:

==============

Index for November 2020: 109.1 (The baseline 100 score is associated with 2016 data.)

==============

Predicted: +0.5%

  • Actual: +0.646% (+0.7 point)

==============

  • LEI for October 2020: 108.4

  • LEI for September 2020: 107.5

  • LEI for August 2020: 106.7
     
  • LEI for July 2020: 105.0

  • LEI for June 2020: 102.9
     
  • LEI for May 2020: 99.8

==============

The yellow-highlighted percentage is the month-to-month change for the index.  The "predicted" figure is what economists were expecting, while the "actual" is the true or real figure.

The LEI is a composite of 10 of the nation's economic data releases that's put together by The Conference Board. Statistically, the components listed below have shown a significant increase or decrease before national economic upturns or downturns:

  1. The Standard + Poor's 500 Index

  2. Average weekly claims for unemployment insurance

  3. Building permits for new private housing

  4. The interest rate spread between the yield on the benchmark 10-Year Treasury Note and Federal Funds

  5. ISM® Index of New Orders

  6. Manufacturer's new orders for consumer goods or materials

  7. Manufacturers' new orders, nondefense capital goods excluding aircraft orders

  8. Average weekly manufacturing hours

  9. Average consumer expectations for business conditions

  10. Leading Credit Index™

==============
 
 
CHART: Leading Economic Index - November 2020 Update
CHART: Leading Economic Index
November 2020 Update

==============
 

CHART: Leading Economic Index - Six-Month Growth November 2020 Update
CHART: Leading Economic Index - Six-Month Growth
November 2020 Update

==============
 
From Today's Report:

"...'The US LEI continued rising in November, but its pace of improvement has been decelerating in recent months, suggesting a significant moderation in growth as the US economy heads into 2021,' said Ataman Ozyildirim, Senior Director of Economic Research at The Conference Board. 'Initial claims for unemployment insurance, new orders for manufacturing, residential construction permits, and stock prices made the largest positive contributions to the LEI. However, falling average working hours in manufacturing and consumers’ worsening outlook underscore the downside risks to growth from a second wave of COVID-19 and high unemployment.'..."

==============


==============

Labels: , , , , , , , ,


--> www.FedPrimeRate.com Privacy Policy <--

>  SITEMAP  <

Thursday, December 17, 2020

New Unemployment Insurance Claims for The Week of December 12, 2020

Jobless Claims
Jobless Claims

Earlier today, the Labor Department released its weekly report on New Jobless Insurance Claims for the week that ended on December 12, 2020:

====================

Predicted: 800,000

  • Actual: 885,000
====================

The yellow-highlighted figure represents the number of first-time claims for unemployment benefits for the entire United States. The "predicted" figure is what economists were expecting, while the "actual" is the true or real figure.

  • Previous Week (revised): 862,000
  • 4-Week Moving Average: 812,500

====================


====================


Labels: , , , , , , , , , ,


--> www.FedPrimeRate.com Privacy Policy <--

>  SITEMAP  <

Tuesday, December 15, 2020

Import and Export Price Indexes for November 2020

The Labor Department's Bureau of Labor Statistics this morning released its report on U.S. Import and Export Price Indexes for November 2020:

===============

Import Prices
Predicted: +0.1%
Actual: +0.1%

Change From 12 Months Previous: -1.0%

===============

Export Prices
Predicted: +0.5%
Actual: +0.6%

Change From 12 Months Previous: -1.1%

===============
 
The above percentages, highlighted in yellow, represent the month-to-month change in prices for:

  • Imports: the cost of goods produced in other countries and sold in the United States.
  • Exports: the cost of goods produced in the USA and sold in other countries.

Together, these indexes offer insight into the status of inflation in the United States, and for the global economy as well. The "predicted" figure is what economists were expecting, while the "actual" is the true or real figure.


===============


CHART: Import Price Index - November 2020 Update


===============


CHART: Export Price Index - November 2020 Update


===============

From Today's Report:

"...Coronavirus (COVID-19) Pandemic Impact on November 2020 Import and Export Price Index Data

The Bureau of Labor Statistics did not make changes to either the collection method or estimation methodology for the November release of U.S. Import and Export Price Indexes. Survey response rates for November were 5.6-percentage points lower than those in November 2019. A small number of indexes that are normally published were not published in November. Additional information is available at www.bls.gov/covid19/import-export-price-indexes-covid19-impacts-november-2020.htm.
..."
==============


==============


Labels: , , , , , , , ,


--> www.FedPrimeRate.com Privacy Policy <--

>  SITEMAP  <

Friday, December 04, 2020

Employment Situation Report for November 2020

The Employment Situation Report for November 2020 was released by The Department of Labor's Bureau of Labor Statistics this morning:

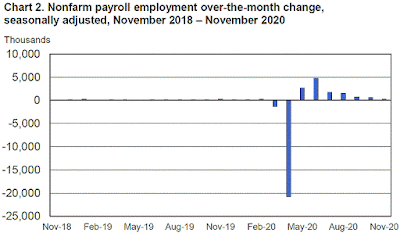
Nonfarm Payrolls (month-to-month change)
Predicted: +300,000
Actual: +245,000


U-3 Unemployment Rate (Headline)
Actual: 6.7%
Previous Month: 6.9%
12 Months Previous: 3.5%

U-6 Unemployment Rate*
Actual: 12.0%
Previous Month: 12.1%
12 Months Previous: 6.8%

Average Hourly Earnings (month-to-month change)
Predicted: +0.2%
Actual: +0.305% (+$0.09)

Average Hourly Earnings (year-on-year change)
Predicted: +5.0%
Actual: +4.375% (+$1.24)

Average Weekly Earnings (month-to-month change)
Actual: +0.305% (+$3.13)


Average Weekly Earnings (year-on-year change)
Actual: +5.897% (+$57.32)

Civilian Labor Force Participation Rate: 61.5%
Previous Month: 61.7%
12 Months Previous: 63.2%

Average Workweek
Predicted: 34.8 hours
Actual: 34.8 hours

Economist, academics, central bankers and investors pay very close attention to the monthly Employment Situation report as it offers penetrating insight as to the current and near-future state of the overall U.S. economy. If a) Americans are earning more money and b) the economy is creating new jobs, this typically translates to more money being pumped into the economy (and vice versa.)

The "predicted" figure is what economists were expecting, while the "actual" is the true or real figure.

===================

From Today's Report:

 "...The change in total nonfarm payroll employment for September was revised up by 39,000, from +672,000 to +711,000, and the change for October was revised down by 28,000, from +638,000 to +610,000. With these revisions, employment in September and October combined was 11,000 more than previously reported..."

"...Coronavirus (COVID-19) Impact on November 2020 Establishment and Household Survey Data

Data collection for both surveys was affected by the coronavirus (
COVID-19) pandemic. In the establishment survey, approximately one-fifth of the establishments are assigned to four regional data collection centers for collection. Although these centers were closed, interviewers at these centers worked remotely to collect data by telephone. Additionally, BLS encouraged businesses to report electronically. The collection rate for the establishment survey was 74 percent in November, about the same as the average for the 12 months ending in February 2020. The household survey is generally conducted through in-person and telephone interviews. However, for the safety of both interviewers and respondents, in-person interviews were conducted only when telephone interviews could not be done.


The household survey response rate was 79 percent in November, considerably higher than the low of 65 percent in June but below the average of 83 percent for the 12 months ending in February 2020.


In the establishment survey, workers who are paid by their employer for all or any part of the pay period including the 12th of the month are counted as employed, even if they were not actually at their jobs. Workers who are temporarily or permanently absent from their jobs and are not being paid are not counted as employed, even if they continue to receive benefits. In the household survey, individuals are classified as employed, unemployed, or not in the labor force based on their answers to a series of questions about their activities during the survey reference week (November 8th through November 14th). Workers who indicate they were not working during the entire survey reference week and expect to be recalled to their jobs should be classified as unemployed on temporary layoff. As in recent months, a large number of persons were classified as unemployed on temporary layoff in November.


Since March, household survey interviewers have been instructed to classify employed persons absent from work due to temporary, coronavirus-related business closures or cutbacks as unemployed on temporary layoff. As happened in earlier months, some workers affected by the pandemic who should have been classified as unemployed on temporary layoff were instead misclassified as employed but not at work. However, the share of responses that may have been misclassified was highest in the early months of the pandemic and has been considerably lower in recent months.


For March through October, BLS published an estimate of what the unemployment rate would have been had misclassified workers been included among the unemployed. Repeating this same approach, the overall November unemployment rate would have been 0.4 percentage point higher than reported. However, this represents the upper bound of our estimate of misclassification and probably overstates the size of the misclassification error.

According to usual practice, the data from the household survey are accepted as recorded. To maintain data integrity, no ad hoc actions are taken to reclassify survey responses.
.."
===================


Chart: Nonfarm Payroll Employment  November 2020 Update
Chart: Nonfarm Payroll Employment

November 2020 Update


===================


Chart: U-3 (Headline) Unemployment Rate  November 2020 Update
Chart: U-3 (Headline) Unemployment Rate

November 2020 Update


 ===================

 * =  The U-6 Unemployment Rate is defined as:

"Total unemployed, plus all persons marginally attached to the labor force, plus total employed part time for economic reasons, as a percent of the civilian labor force plus all persons marginally attached to the labor force."


===================


 ===================


Labels: , , , , , , , , , ,


--> www.FedPrimeRate.com Privacy Policy <--

>  SITEMAP  <

bing

bing


SCAMS!

FedPrimeRate.com
Entire Website © 2024 FedPrimeRate.comSM


This website is neither affiliated nor associated with The United States Federal Reserve
in any way. Information in this website is provided for educational purposes only. The owners
of this website make no warranties with respect to any and all content contained within this
website. Consult a financial professional before making important decisions related to any
investment or loan product, including, but not limited to, business loans, personal loans,
education loans, first or second mortgages, credit cards, car loans or any type of insurance.