.comment-link {margin-left:.6em;}

Economy

Economic Data (USA)

Friday, May 28, 2021

PCE Price Index + Personal Income + Consumer Spending Report for April 2021

The Commerce Department's Bureau of Economic Analysis (BEA) released its report on The PCE Price Index, Consumer Spending and Personal Income for April 2021:

=============

Consumer Spending (Personal Consumption Expenditures)

Predicted: +0.7%

  • Actual: +0.5%
  • Actual (2012 Chained* Dollars): -0.1%
=============

Personal Income

Predicted: +0.1%
  • Actual: -13.1%
=============

  • Disposable Personal Income, Current Dollars: -14.6%
  • Disposable Personal Income (2012 Chained* Dollars): -15.1%

=============

The above highlighted percentages represent the month-to-month change in Consumer Spending (aka Personal Consumption Expenditures), Personal Income and Disposable Personal Income for the entire United States.

=============

===================== 

 
CHART: Month-to-Month Change in Personal Income - April 2021 Update

CHART: Month-to-Month Change in Personal Income
April 2021 Update

=====================

=====================

Personal Consumption Expenditures (PCE) Price Index
Predicted: +0.6%
Actual: 0.6% 

  • Change from 12 months previous: +3.6%
=====================

Core PCE Price Index
( = PCE Price Index minus food and energy)
Predicted: +0.9%
Actual: 0.7%

  • Change from 12 months previous: +3.1%
=====================

The yellow-highlighted percentages represent the month-to-month change in the prices associated with domestic personal consumption.  The PCE Price Index is different from the Consumer Price Index (CPI) in that it is a very broad measure of the prices associated with domestic products and services, while the CPI measures a more limited fixed basket of goods and services.

The broad nature of the PCE Price Index is key to why it is the Federal Reserve's preferred measure of inflation.  The Federal Open Market Committee (FOMC) pays very close attention to it.

=====================

The "predicted" figures are what economists were expecting, while the "actual" figures are the true or real figure.


=====================

 =====================

*Chained dollars is a method of adjusting real dollar amounts for inflation over time, so as to allow comparison of figures from different years. The Commerce Department introduced the chained-dollar measure in 1996. Chained dollars generally reflect dollar figures computed with 2012 as the base year.


Labels: , , , , , , , , , , , , ,


--> www.FedPrimeRate.com Privacy Policy <--

>  SITEMAP  <

Thursday, May 20, 2021

New Unemployment Insurance Claims for The Week of May 15, 2021

Jobless Claims
Jobless Claims

Earlier today, the Labor Department released its weekly report on New Jobless Insurance Claims for the week that ended on May 15, 2021:

====================

Predicted: 500,000

  • Actual: 444,000
====================

The yellow-highlighted figure represents the number of first-time claims for unemployment benefits for the entire United States. The "predicted" figure is what economists were expecting, while the "actual" is the true or real figure.

  • Previous Week (revised): 478,000
  • 4-Week Moving Average: 504,750

====================


====================


Labels: , , , , , , , , , ,


--> www.FedPrimeRate.com Privacy Policy <--

>  SITEMAP  <

Leading Economic Index for April 2021

The Conference Board® released its Leading Economic Index® (LEI) for April 2021 this morning:

==============

Index for April 2021: 113.3 (The baseline 100 score is associated with 2016 data.)

==============

Predicted: +2.0%
  • Actual: +1.614% (+1.8 points)

==============

  • LEI for March 2021: 111.5

  • LEI for February 2021: 110.1
     
  • LEI for January 2021: 110.2

  • LEI for December 2020: 109.6

  • LEI for November 2020: 109.2

  • LEI for October 2020: 108.2

==============

The yellow-highlighted percentage is the month-to-month change for the index.  The "predicted" figure is what economists were expecting, while the "actual" is the true or real figure.

The LEI is a composite of 10 of the nation's economic data releases that's put together by The Conference Board. Statistically, the components listed below have shown a significant increase or decrease before national economic upturns or downturns:

  1. The Standard + Poor's 500 Index

  2. Average weekly claims for unemployment insurance

  3. Building permits for new private housing

  4. The interest rate spread between the yield on the benchmark 10-Year Treasury Note and Federal Funds

  5. ISM® Index of New Orders

  6. Manufacturer's new orders for consumer goods or materials

  7. Manufacturers' new orders, nondefense capital goods excluding aircraft orders

  8. Average weekly manufacturing hours

  9. Average consumer expectations for business conditions

  10. Leading Credit Index™

==============


Chart: Leading Economic Index - April 2021 Update


==============


Chart: Leading Economic Index - Six-Month Growth April 2021 Update
Chart: Leading Economic Index - Six-Month Growth
April 2021 Update

 
==============
 
From Today's Report:

"...'With April’s large monthly gain to start the second quarter, the U.S. LEI has now recovered fully from its COVID-19 contraction—surpassing the index’s previous peak, reached at the very onset of the global pandemic in January 2020,' said Ataman Ozyildirim, Senior Director of Economic Research at The Conference Board. 'While employment and production have not recovered to their pre-pandemic levels yet, the U.S. LEI suggests the economy’s upward trend should continue and growth may even accelerate in the near term. The Conference Board now forecasts real GDP could grow around 8 to 9 percent (annualized) in the second quarter, with year-over-year economic growth reaching 6.4 percent for 2021.'..."

==============


============== 


Labels: , , , , , , ,


--> www.FedPrimeRate.com Privacy Policy <--

>  SITEMAP  <

Tuesday, May 18, 2021

Housing Starts During April 2021

The U.S. Commerce Department this morning released its Housing Starts report for April 2021:

---------------------------------------------------

Housing Starts:
Predicted: 1,600,000
Actual: 1,569,000

Change From Previous Month: -9.463% (-164,000 units)
Change From One Year Previous: +67.271% (+631,000 units)

---------------------------------------------------

Building Permits:
Predicted: 1,800,000
Actual: 1,760,000

Change From Previous Month: +0.285% (+5,000 permits)
Change From One Year Previous: +60.878% (+666,000 permits)

----------------------------------------------------

Housing Starts: The top, yellow-highlighted figure is a measure of initial construction of single and multi-family residential units in the United States for the indicated month. Seasonally adjusted annual rate. The "predicted" figure is what economists were expecting, while the "actual" is the true or real figure.

If you're wondering about the demand for new homes in the United States, or about the American residential construction industry in general, then you should pay attention to the monthly Housing Starts report. This report also offers insight into specific types of consumer spending: when housing starts are up, demand for the stuff that a consumer would purchase for a new home (large appliances, consumer electronics, furniture, etc.) tends to also rise -- and vice versa.


=================


CHART: Housing Starts - April 2021 Update


=================


================


Labels: , , , , , , , ,


--> www.FedPrimeRate.com Privacy Policy <--

>  SITEMAP  <

Friday, May 14, 2021

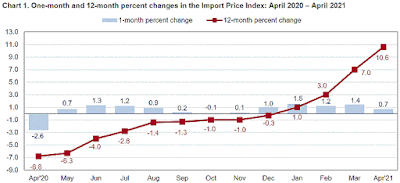
Import and Export Price Indexes for April 2021

The Labor Department's Bureau of Labor Statistics this morning released its report on U.S. Import and Export Price Indexes for April 2021:

===============

Import Prices
Predicted: +0.5%
Actual: +0.7%

Change From 12 Months Previous: +10.6%

===============

Export Prices
Predicted: +0.5%
Actual: +0.8%

Change From 12 Months Previous: +14.4%

===============
 
The above percentages, highlighted in yellow, represent the month-to-month change in prices for:

  • Imports: the cost of goods produced in other countries and sold in the United States.
  • Exports: the cost of goods produced in the USA and sold in other countries.

Together, these indexes offer insight into the status of inflation in the United States, and for the global economy as well. The "predicted" figure is what economists were expecting, while the "actual" is the true or real figure.


===============


CHART: Import Price Index - April 2021 Update


===============


CHART: Export Price Index - April 2021 Update

===============


==============


Labels: , , , , , , , ,


--> www.FedPrimeRate.com Privacy Policy <--

>  SITEMAP  <

U.S. Retail And Food Services Sales Report for April 2021

The Commerce Department this morning released advance estimates of U.S. Retail and Food Services Sales for April 2021:

Predicted: +0.2%
Actual: +0.0219% (+$136,000,000)

The yellow-highlighted percentage above represents the month-to-month change in total sales receipts for retailers that sell durable and non-durable goods, and retailers that provide food and beverage services.

=================

  • Estimated Retail Sales During April 2021: $619,923,000,000
  • Change From 12 Months Previous: +51.222% (+$209,981,000,000)

=================


CHART: Retail Sales - April 2021 Update


=================

=================


Labels: , , , , , , , , ,


--> www.FedPrimeRate.com Privacy Policy <--

>  SITEMAP  <

Wednesday, May 12, 2021

Consumer Price Index (CPI) for April 2021

Earlier this morning, the Labor Department's Bureau of Labor Statistics released the Consumer Price Index (CPI) for April 2021:

=========================================

Predicted: +0.5%
Actual: +0.8%

  • Change From 12 Months Previous: +4.2%

=========================================

Below is the CPI when food and energy are removed, also known as core CPI:

Predicted: 0.5%
Actual: 0.9%

  • Change From 12 Months Previous: +3.0%

=========================================

The above, yellow-highlighted figures represent the seasonally adjusted, month-to-month change in prices for a specific group of goods and services that consumers buy, and is, therefore, a very important part of the overall inflation picture for the country.

The "predicted" figure is what economists were expecting, while the "actual" is the true or real figure.

General categories that constitute the CPI are:

  • Healthcare
  • Housing
  • Clothing
  • Communications
  • Education
  • Transportation
  • Food and Beverages
  • Recreation
  • Miscellaneous Goods and Services (grooming expenses, etc.)

=========================================


CHART: Consumer Price Index (CPI) - April 2021 Update
CHART: Consumer Price Index (CPI)
April 2021 Update

========================================= 


=========================================


Labels: , , , , , , , , ,


--> www.FedPrimeRate.com Privacy Policy <--

>  SITEMAP  <

Friday, May 07, 2021

Employment Situation Report for April 2021

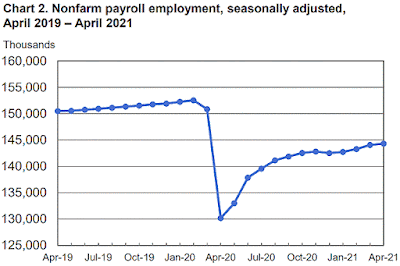
The Employment Situation Report for April 2021 was released by The Department of Labor's Bureau of Labor Statistics this morning:

Nonfarm Payrolls (month-to-month change)
Predicted: +900,000
Actual: +266,000


U-3 Unemployment Rate (Headline)
Actual: 6.1%
Previous Month: 6.0%
12 Months Previous: 14.8%

U-6 Unemployment Rate*
Actual: 10.4%
Previous Month: 10.7%
12 Months Previous: 22.9%

Average Hourly Earnings (month-to-month change)
Predicted: +0.3%
Actual: +0.792% (+$0.20)

Average Hourly Earnings (year-on-year change)
Predicted: +5.0%
Actual: +1.153% (+$0.29)

Average Weekly Earnings (month-to-month change)
Actual: +0.792% (+$6.88)


Average Weekly Earnings (year-on-year change)
Actual: +3.87% (+$32.62)

Civilian Labor Force Participation Rate: 61.7%
Previous Month: 61.5%
12 Months Previous: 60.2%

Average Workweek
Predicted: 34.9 hours
Actual: 35.0 hours

Economist, academics, central bankers and investors pay very close attention to the monthly Employment Situation report as it offers penetrating insight as to the current and near-future state of the overall U.S. economy. If a) Americans are earning more money and b) the economy is creating new jobs, this typically translates to more money being pumped into the economy (and vice versa.)

The "predicted" figure is what economists were expecting, while the "actual" is the true or real figure.

===================

From Today's Report:

 "...The change in total nonfarm payroll employment for February was revised up by 68,000, from +468,000 to +536,000, and the change for March was revised down by 146,000, from +916,000 to +770,000. With these revisions, employment in February and March combined is 78,000 lower than previously reported. (Monthly revisions result from additional reports received from businesses and government agencies since the last published estimates and from the recalculation of seasonal factors.)..."
===================


Chart: U-3 (Headline) Unemployment Rate - April 2021 Update

Chart: U-3 (Headline) Unemployment Rate
April 2021 Update

===================


Chart: Nonfarm Payroll Employment - April 2021 Update

Chart: Nonfarm Payroll Employment
April 2021 Update


 ===================

 * =  The U-6 Unemployment Rate is defined as:

"Total unemployed, plus all persons marginally attached to the labor force, plus total employed part time for economic reasons, as a percent of the civilian labor force plus all persons marginally attached to the labor force."


===================


 ===================


Labels: , , , , , , , , , ,


--> www.FedPrimeRate.com Privacy Policy <--

>  SITEMAP  <

Monday, May 03, 2021

Construction Spending During March 2021

Earlier today, the U.S. Census Bureau -- which is part of the Commerce Department -- released its Construction Spending report for March 2021:

Predicted: +2.0%
Actual: +0.2112% (+$3,189,000,000)

The yellow-highlighted percentage represents the month-to-month change in new public and private construction activity for the United States. The "predicted" figure is what economists were expecting, while the "actual" is the true or real figure.

  • Estimated construction spending during March 2021: $1,513,085,000,000.

  • February 2021 (revised): $1,509,896,000,000.
     
  • Change from 12 months previous: +5.315% (+$76,358,000,000.)


================


Chart: Construction Spending During March 2021

================


 ================


Labels: ,


--> www.FedPrimeRate.com Privacy Policy <--

>  SITEMAP  <

bing

bing


SCAMS!

FedPrimeRate.com
Entire Website © 2024 FedPrimeRate.comSM


This website is neither affiliated nor associated with The United States Federal Reserve
in any way. Information in this website is provided for educational purposes only. The owners
of this website make no warranties with respect to any and all content contained within this
website. Consult a financial professional before making important decisions related to any
investment or loan product, including, but not limited to, business loans, personal loans,
education loans, first or second mortgages, credit cards, car loans or any type of insurance.