.comment-link {margin-left:.6em;}

Economy

Economic Data (USA)

Friday, May 29, 2020

Consumer Sentiment: Final Result for May 2020

The University of Michigan's Index of Consumer Sentiment (ICS) - Final Result for May 2020 was released today:

Predicted: 70.0
Actual: 72.3

  • Change from Previous Month: +0.696% (+0.5 point)
  • Change from 12 Months Previous: -27.7% (-27.7 points)

=========

  • Final ICS Reading for April 2020: 71.8

  • Final ICS Reading for May 2019: 100.0

=========

From today's report:

"...Consumer sentiment has remained largely unchanged during the past two months, with the final May estimate just a half index point above the April reading. The CARES relief checks and higher unemployment payments have helped to stem economic hardship, but those programs have not acted to stimulate discretionary spending due to uncertainty about the future course of the pandemic. It should not be surprising that a growing number of consumers expected the economy to improve from its recent standstill, or that the majority still thought conditions in the economy would remain unfavorable in the year ahead. This has been a common occurrence in past cycles (see the chart).
Expectations for economic growth have always dominated at the ends of recessions, and favorable assessments about the current state of the economy are more frequent near the ends of expansions.
The gap between economic growth and the current performance of the economy is likely to grow significantly when the disastrous 2nd quarter GDP is announced. More widespread price discounting as well as low interest rates have helped to improve buying plans, but those plans still remain well below the levels recorded three months ago.
Adding to consumers' concerns about a significant expected drop in income growth, year-ahead inflation expectations rose sharply, putting extra pressure on consumers' abilities to maintain their living standards..."

=========


The ICS is derived from the following five survey questions:


  1. "We are interested in how people are getting along financially these days. Would you say that you (and your family living there) are better off or worse off financially than you were a year ago?"


  2. "Now looking ahead, do you think that a year from now you (and your family living there) will be better off financially, or worse off, or just about the same as now?"


  3. "Now turning to business conditions in the country as a whole, do you think that during the next twelve months we'll have good times financially, or bad times, or what?"


  4. "Looking ahead, which would you say is more likely: that in the country as a whole we'll have continuous good times during the next five years or so, or that we will have periods of widespread unemployment or depression, or what?"


  5. "About the big things people buy for their homes, such as furniture, a refrigerator, stove, television, and things like that. Generally speaking, do you think now is a good or bad time for people to buy major household items?"

=========


=========

The ICS uses a 1966 baseline, i.e. for 1966, the ICS = 100. So any number that is below the 1966 baseline of 100 means that the folks who were polled recently aren't as optimistic about the U.S. economy as those polled back in 1966.

The ICS is similar to the Consumer Confidence Index in that they both measure consumer attitudes and offer valuable insight into consumer spending.

=========

The "predicted" figure is what economists were expecting, while the "actual" is the true or real figure.

=========


=========


Labels: , , , , ,


--> www.FedPrimeRate.com Privacy Policy <--

>  SITEMAP  <

PCE Price Index + Personal Income + Consumer Spending Report for April 2020

The Commerce Department's Bureau of Economic Analysis (BEA) released its report on The PCE Price Index, Consumer Spending and Personal Income for April 2020:

=============

Consumer Spending (Personal Consumption Expenditures)
Predicted: -10.0%
Actual: -13.6%

----------------------

Personal Income
Predicted: -5.0%
Actual: +10.5%

=============

  • Disposable Personal Income, Current Dollars: +12.9%
  • Disposable Personal Income, 2012 Chained* Dollars: +13.4%

=============

The above highlighted percentages represent the month-to-month change in Consumer Spending (aka Personal Consumption Expenditures), Personal Income and Disposable Personal Income for the entire United States.

=============

=====================
=====================

Personal Consumption Expenditures (PCE) Price Index
Predicted: -0.5%
Actual: -0.5%

  • Change from 12 months previous: +0.5%
=====================

Core PCE Price Index
( = PCE Price Index minus food and energy)
Predicted: -0.5%
Actual: -0.4%

  • Change from 12 months previous: +1.0%
=====================

The yellow-highlighted percentages represent the month-to-month change in the prices associated with domestic personal consumption.  The PCE Price Index is different from the Consumer Price Index (CPI) in that it is a very broad measure of the prices associated with domestic products and services, while the CPI measures a more limited fixed basket of goods and services.

The broad nature of the PCE Price Index is key to why it is the Federal Reserve's preferred measure of inflation.  The Federal Open Market Committee (FOMC) pays very close attention to it.

=====================

The "predicted" figures are what economists were expecting, while the "actual" figures are the true or real figure.


=====================

From Today's Report:


"...The April estimate for personal income and outlays was impacted by the response to the spread of COVID-19, as federal economic recovery payments were distributed, and governments continued with “stay-at-home” orders. The full economic effects of the COVID-19 pandemic cannot be quantified in the personal income and outlays estimate for April because the impacts are generally embedded in source data and cannot be separately identified. For more information, see the “highlights” file and the Effects of Selected Federal Pandemic Response Programs on Personal Income table..."


=====================

 =====================

*Chained dollars is a method of adjusting real dollar amounts for inflation over time, so as to allow comparison of figures from different years. The Commerce Department introduced the chained-dollar measure in 1996. Chained dollars generally reflect dollar figures computed with 2012 as the base year.

Labels: , , , , , , , , , , , ,


--> www.FedPrimeRate.com Privacy Policy <--

>  SITEMAP  <

Thursday, May 28, 2020

Durable Goods Orders During April 2020

The Durable Goods Orders report for April 2020 was released by the Commerce Department this morning:

================

Predicted: -18.0%
  • Actual: $169,966,000,000 (-$35,379,000,000 [-17.229%])

================

  • March 2020 (revised): $205,345,000,000 (-$40,850,000,000 [-16.593%])
 
================
Chart: Durable Goods Orders - April 2020 Update

================

The yellow-highlighted figures represent the dollar amount of new orders for durable or hard goods for immediate or future delivery from U.S. manufacturers, along with both the dollar and month-to-month percentage change.

Examples of durable goods: cars, airplanes, computers, furniture -- items that are built to last at least three years.

================


 ================

Labels: , , , , ,


--> www.FedPrimeRate.com Privacy Policy <--

>  SITEMAP  <

Crude Oil Inventories Report for Week of May 22, 2020

Crude Oil Inventories

The U.S. Crude Oil Inventories report for the week that ended on May 22, 2020 was released this morning:

-- Change from Last Week: +7,900,000 Barrels

-- Change from A Year Ago (Y/Y): +57,900,000 Barrels

-- Current U.S. Crude Oil Stocks: 534,400,000 Barrels

Diminishing crude oil inventories often translate to higher crude oil prices (and vice versa), but not always.

The report is produced by the U.S. Energy Information Administration (EIA).


Labels: , , , ,


--> www.FedPrimeRate.com Privacy Policy <--

>  SITEMAP  <

Gross Domestic Product (GDP): Second Estimate for Q1, 2020

Earlier this morning, the Commerce Department's Bureau of Economic Analysis (BEA) released its second estimate for U.S. Real Gross Domestic Product (GDP) for the first quarter of 2020:

Predicted: -5.0%
Actual: -5.0%

The yellow-highlighted percentage represents the quarter-to-quarter change for Real Gross Domestic Product for the entire United States.

============

"...Corporate Profits

Profits from current production (corporate profits with inventory valuation and capital consumption adjustments) decreased $295.4 billion in the first quarter, in contrast to an increase of $53.0 billion in the fourth quarter (table 10).

Profits of domestic financial corporations decreased $67.4 billion in the first quarter, in contrast to an increase of $0.7 billion in the fourth quarter. Profits of domestic nonfinancial corporations decreased $169.5 billion, in contrast to an increase of $53.7 billion. Rest-of-the-world profits decreased $58.6 billion, compared with a decrease of $1.4 billion. In the first quarter, receipts decreased $72.7 billion,
and payments decreased $14.2 billion.
.."

============

"...Coronavirus (COVID-19) Impact on the First-Quarter 2020 GDP Estimate

The decline in first quarter GDP reflected the response to the spread of COVID-19, as governments issued “stay-at-home” orders in March. This led to rapid changes in demand, as businesses and schools switched to remote work or canceled operations, and consumers canceled, restricted, or redirected their spending.  The full economic effects of the COVID-19 pandemic cannot be quantified in the GDP estimate for the first quarter of 2020 because the impacts are generally embedded in source data and cannot be separately identified..."

============

GDP, First Quarter 2020, Second Estimate

============

  • On June 25, 2020, a third and "final" GDP estimate will be released by the BEA, which will contain the most accurate and authoritative data for the first quarter of 2020.

The GDP is a very broad measure of economic activity for the entire United States, covering all sectors of the economy. The Commerce Department defines real GDP as, "the output of goods and services produced by labor and property located in the United States."

============


============

Labels: , , , , , ,


--> www.FedPrimeRate.com Privacy Policy <--

>  SITEMAP  <

New Unemployment Insurance Claims for The Week of May 23, 2020

Jobless Claims
Jobless Claims

Earlier today, the Labor Department released its weekly report on New Jobless Insurance Claims for the week that ended on May 23, 2020:

====================

Predicted: 2,000,000

  • Actual: 2,123,000
====================

The yellow-highlighted figure represents the number of first-time claims for unemployment benefits for the entire United States. The "predicted" figure is what economists were expecting, while the "actual" is the true or real figure.

  • Previous Week (revised): 2,446,000
  • 4-Week Moving Average: 2,608,000

====================

From This Morning's Report:

"...The COVID-19 virus continues to impact the number of initial claims and insured unemployment. This report includes information on claimants filing Pandemic Unemployment Assistance and Pandemic Emergency Unemployment Compensation claims..."

====================


====================


Labels: , , , , , , , , ,


--> www.FedPrimeRate.com Privacy Policy <--

>  SITEMAP  <

Tuesday, May 26, 2020

New Home Sales During April 2020

The April 2020 New Home Sales report was released by the Commerce Department this morning:

Predicted: 500,000
Actual New Home Sales: 623,000

------------------------------------------------------

  • Change from One Month Previous: +4,000 units (+0.646%)

  • Change from One Year Previous: -41,000 units (-6.175%)

------------------------------------------------------

Median Price for a New Home
during April 2020: $309,900

***************************

Average Price for a New Home
during April 2020: $364,500


------------------------------------------------------

Inventory: 325,000 (6.3 months supply at current sales rate; seasonally‐adjusted.)

------------------------------------------------------

================================


================================


Compiled jointly by the U.S. Commerce Department and the U.S. Department of Housing and Urban Development, the yellow-highlighted figure above is the seasonally adjusted and annualized number of newly-built homes with committed buyers for the indicated month.

The "predicted" figure is what economists were expecting, while the "actual" is the true or real figure.

The New Home Sales report is watched by economists and investors because it offers insight into the state of the U.S. housing market, and also provides data that can be used to predict sales of large household furniture and appliances like refrigerators, air conditioners, microwave ovens, etc.


================================

================================

Labels: , , , , , , ,


--> www.FedPrimeRate.com Privacy Policy <--

>  SITEMAP  <

Consumer Confidence Index (CCI) for May 2020

The Consumer Confidence Index® (CCI) for this month (May 2020) was released by The Conference Board® this morning:

================

Predicted: 88.3
  • Actual: 86.6

================

Previous Month (revised): 85.7
 
  • Change from Previous Month: +1.05% (+0.9 point)
================

The "predicted" figure is what economists were expecting, while the "actual" is the true or real figure.

From Today's Report:

"...'Following two months of rapid decline, the free-fall in Confidence stopped in May,' says Lynn Franco, Senior Director of Economic Indicators at The Conference Board. 'The severe and widespread impact of COVID-19 has been mostly reflected in the Present Situation Index, which has plummeted nearly 100 points since the onset of the pandemic. Short-term expectations moderately increased as the gradual re-opening of the economy helped improve consumers’ spirits. However, consumers remain concerned about their financial prospects. In addition, inflation expectations continue to climb, which could lead to a sense of diminished purchasing power and curtail spending. While the decline in confidence appears to have stopped for the moment, the uneven path to recovery and potential second wave are likely to keep a cloud of uncertainty hanging over consumers’ heads.'..."

Every month, The Conference Board sends a questionnaire to 5,000 U.S. households. Survey participants are polled about their feelings regarding the U.S. economy, current and future, and about their own fiscal circumstances. On average, 3,500 participants complete and return the 5-question survey.

  • The baseline "100" score for the CCI is associated with 1985 survey data.

When consumers feel good about the economy, they tend to do more spending, and vice versa.

Based in New York City, The Conference Board is a private, not-for-profit organization with a mission to, "create and disseminate knowledge about management and the marketplace to help businesses strengthen their performance and better serve society."

The CCI is usually released on the last Tuesday of the month.

================

================

Labels: , , , , , , , ,


--> www.FedPrimeRate.com Privacy Policy <--

>  SITEMAP  <

Chicago Fed National Activity Index (CFNAI) for April 2020

The Federal Reserve Bank of Chicago released its National Activity Index (CFNAI) for April 2020:

==================

  • Actual (CFNAI): -16.74

==================

  • Previous Month (revised): -4.97
  • 3-Month Moving Average (CFNAI-MA3): -7.22
==================


The CFNAI is a weighted average of 85 indicators of growth in national economic activity drawn from four broad categories of data:

  • Production and income;
  • Employment, unemployment, and hours;
  • Personal consumption and housing; and
  • Sales, orders, and inventories.

The "predicted" figure is what economists were expecting, while the yellow-highlighted figure is what was reported.

==================


Chart: Chicago Fed National Activity Index with Business Cycles - April 2020 Update
Chart: Chicago Fed National Activity Index with Business Cycles
April 2020 Update

==================

From Today's Report
"...Index Suggests Economic Growth Fell Substantially in April

Led by declines in production- and employment-related indicators, the Chicago Fed National Activity Index (CFNAI) fell to –16.74 in April from –4.97 in March. All four broad categories of indicators used to construct the index made negative contributions in April, and all four categories decreased from March. The index’s three-month moving average, CFNAI-MA3, decreased to –7.22 in April from –1.69 in March. Following a period of economic expansion, an increasing likelihood of a recession has historically been associated with a CFNAI-MA3 value below –0.70..
."

==================

Understanding The CFNAI:

A zero value for the monthly index has been associated with the national economy expanding at its historical trend (average) rate of growth; negative values with below-average growth (in standard deviation units); and positive values with above-average growth.

Periods of economic expansion have historically been associated with values of the CFNAI-MA3 above -0.70 and the CFNAI Diffusion Index above -0.35. Conversely, periods of economic contraction have historically been associated with values of the CFNAI-MA3 below -0.70 and the CFNAI Diffusion Index below -0.35.

An increasing likelihood of a period of sustained increasing inflation has historically been associated with values of the CFNAI-MA3 above +0.70 more than two years into an economic expansion. Similarly, a substantial likelihood of a period of sustained increasing inflation has historically been associated with values of the CFNAI-MA3 above +1.00 more than two years into an economic expansion.

==================


==================

Labels: , , , , , , , , ,


--> www.FedPrimeRate.com Privacy Policy <--

>  SITEMAP  <

Thursday, May 21, 2020

Philadelphia Fed Business Outlook Survey for May 2020

Earlier today, the Federal Reserve Bank of Philadelphia released its diffuse index of current manufacturing conditions for this month (May 2020):

Predicted: -40.0
Actual: -43.1

The "actual" figure above is an index of current manufacturing conditions within the Federal Reserve's Third District, which includes eastern Pennsylvania, all of Delaware and the southern half of New Jersey. Any figure below zero implies that manufacturing in the region is contracting, while a figure above zero implies expansion.

The "predicted" figure is what economists were expecting, while the "actual" is the true or real figure.
 
======================


Chart: Philadelphia Fed Current and Future General Activities Indexes - May 2020

======================

  • Last month, the actual figure was -56.6

======================


======================


For a national perspective of manufacturing conditions, check out the Institute of Supply Management's Purchasing Manager's Index (PMI).


Labels: , , ,


--> www.FedPrimeRate.com Privacy Policy <--

>  SITEMAP  <

Leading Economic Index for April 2020

The Conference Board® released its Leading Economic Index® (LEI) for April 2020 this morning:

==============

Index for April 2020: 98.8 (The baseline 100 score is associated with 2016 data.)

==============

Predicted: -6.0%
  • Actual: -4.449% (-4.6 points)

==============

  • LEI for March 2020: 103.4

  • LEI for February 2020: 111.7
     
  • LEI for January 2020: 111.9

  • LEI for December 2019: 111.4

  • LEI for November 2019: 111.6

  • LEI for October 2019: 111.4

  • LEI for September 2019: 111.6

==============

The yellow-highlighted percentage is the month-to-month change for the index.  The "predicted" figure is what economists were expecting, while the "actual" is the true or real figure.

The LEI is a composite of 10 of the nation's economic data releases that's put together by The Conference Board. Statistically, the components listed below have shown a significant increase or decrease before national economic upturns or downturns:

  1. The Standard + Poor's 500 Index

  2. Average weekly claims for unemployment insurance

  3. Building permits for new private housing

  4. The interest rate spread between the yield on the benchmark 10-Year Treasury Note and Federal Funds

  5. ISM® Index of New Orders

  6. Manufacturer's new orders for consumer goods or materials

  7. Manufacturers' new orders, nondefense capital goods excluding aircraft orders

  8. Average weekly manufacturing hours

  9. Average consumer expectations for business conditions

  10. Leading Credit Index™

==============
 
Chart: Leading Economic Index - April 2020 Update
==============

 
From Today's Report:

"...'In April, the US LEI continued on a downward trajectory, after posting the largest decline in its 60-year history in March,' said Ataman Ozyildirim, Senior Director of Economic Research at The Conference Board. 'The erosion has been very widespread, except for stock prices and the interest rate spread which partially reflect the rapid and large response of the Federal Reserve to offset the pandemic’s impact and support financial conditions. The sharp declines in the LEI and CEI suggest that the U.S. economy is now in recession territory.'

'Business conditions may recover for some sectors and industries over the next few months,' added Bart van Ark, Chief Economist at The Conference Board, 'But, the breadth and depth of the decline in the LEI suggests that an imminent re-opening of some sectors does not imply a fast rebound for the economy at large.'..."

==============

==============

Labels: , , , , , ,


--> www.FedPrimeRate.com Privacy Policy <--

>  SITEMAP  <

Existing Home Sales During April 2020

The Existing Home Sales report for April 2020 was released by The National Association of  Realtors® (NAR®) this morning:

Predicted: 4,325,000
Actual: 4,330,000

  •  Change from Previous Month: -17.837% (-940,000 homes)

  •  Change from One Year Previous: -17.208% (-900,000 homes)
==========

Inventory: 1,470,000 (4.1 months supply)

==========

The yellow-highlighted, "actual" figure above represents the preliminary, seasonally adjusted annualized sales count of existing homes, co-ops and condominiums for the indicated month. The "predicted" figure is what economists were expecting, while the "actual" is the true or real figure.

------------------------------------------------------

Median Price for A Used Home During April 2020: $286,800

Change from One Year Previous: +7.416% (+$19,800)

---------

Average Price for A Used Home During April 2020: $321,500

Change from One Year Previous: +5.41% (+$16,500)


------------------------------------------------------ 

==========


==========

From Today's Report:


"...Existing-home sales dropped in April, continuing what is now a two-month skid in sales brought on by the coronavirus pandemic, according to the National Association of Realtors®. Each of the four major regions experienced a decline in month-over-month and year-over-year sales, with the West seeing the greatest dip in both categories.

'The economic lockdowns – occurring from mid-March through April in most states – have temporarily disrupted home sales,' said
Lawrence Yun, NAR’s chief economist. 'But the listings that are on the market are still attracting buyers and boosting home prices.'

April’s existing-home sales are the lowest level of sales since July 2010 (3.45 million) and the largest month-over-month drop since July 2010 (-22.5%.)

April’s national price increase marks 98 straight months of year-over-year gains.

'Record-low
mortgage rates are likely to remain in place for the rest of the year, and will be the key factor driving housing demand as state economies steadily reopen,' Yun said. 'Still, more listings and increased home construction will be needed to tame price growth.'

Properties typically remained on the market for 27 days in April, seasonally down from 29 days in March, but up from 24 days in April 2019. Fifty-six percent of homes sold in April 2020 were on the market for less than a month.

While virtually every sector of the American economy has been hit hard by this pandemic, our nation’s 1.4 million Realtors® have continued to show an undying commitment to their profession, their clients and America’s real estate industry,' said NAR President
Vince Malta, broker at Malta & Co., Inc., in San Francisco, Calif.

'As we find during any time of crisis, we have a tremendous opportunity to evolve and emerge stronger and more efficient,' Malta continued. 'Having renewed our focus on new, innovative ways to serve American consumers, I am confident the real estate sector and our nation’s Realtors® are uniquely positioned to lead America’s economic recovery.'.
.."

==================


==================

Labels: , , , , , , , , , ,


--> www.FedPrimeRate.com Privacy Policy <--

>  SITEMAP  <

New Unemployment Insurance Claims for The Week of May 16, 2020

Jobless Claims
Jobless Claims

Earlier today, the Labor Department released its weekly report on New Jobless Insurance Claims for the week that ended on May 16, 2020:

====================

Predicted: 2,400,000

  • Actual: 2,438,000
====================

The yellow-highlighted figure represents the number of first-time claims for unemployment benefits for the entire United States. The "predicted" figure is what economists were expecting, while the "actual" is the true or real figure.

  • Previous Week (revised): 2,687,000
  • 4-Week Moving Average: 3,042,000

====================

From This Morning's Report:

"...The COVID-19 virus continues to impact the number of initial claims and insured unemployment. This report now includes information on claimants filing Pandemic Unemployment Assistance and Pandemic Emergency Unemployment Compensation claims..."

====================


====================

Labels: , , , , , , , , ,


--> www.FedPrimeRate.com Privacy Policy <--

>  SITEMAP  <

Wednesday, May 20, 2020

Crude Oil Inventories Report for Week of May 15, 2020

Crude Oil Inventories

The U.S. Crude Oil Inventories report for the week that ended on May 15, 2020 was released this morning:

-- Change from Last Week: -5,000,000 Barrels

-- Change from A Year Ago (Y/Y): +49,700,000 Barrels

-- Current U.S. Crude Oil Stocks: 526,500,000 Barrels

Diminishing crude oil inventories often translate to higher crude oil prices (and vice versa), but not always.

The report is produced by the U.S. Energy Information Administration (EIA).


Labels: , , , ,


--> www.FedPrimeRate.com Privacy Policy <--

>  SITEMAP  <

Tuesday, May 19, 2020

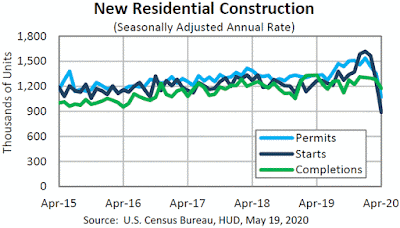
Housing Starts During April 2020

The U.S. Commerce Department this morning released its Housing Starts report for April 2020:

---------------------------------------------------

Housing Starts:
Predicted: 968,000
Actual: 891,000

Change From Previous Month: -30.172% (-385,000 units)
Change From One Year Previous: -29.676% (-376,000 units)

---------------------------------------------------

Building Permits:
Predicted: 1,033,000
Actual: 1,074,000

Change From Previous Month: -20.796% (-282,000 units)
Change From One Year Previous: -19.248% (-256,000 units)

----------------------------------------------------

Housing Starts: The top, yellow-highlighted figure is a measure of initial construction of single and multi-family residential units in the United States for the indicated month. Seasonally adjusted annual rate. The "predicted" figure is what economists were expecting, while the "actual" is the true or real figure.

If you're wondering about the demand for new homes in the United States, or about the American residential construction industry in general, then you should pay attention to the monthly Housing Starts report. This report also offers insight into specific types of consumer spending: when housing starts are up, demand for the stuff that a consumer would purchase for a new home (large appliances, consumer electronics, furniture, etc.) tends to also rise -- and vice versa.


=================

Chart: Housing Starts - April 2020 Update

=================


================

Labels: , , , , , , ,


--> www.FedPrimeRate.com Privacy Policy <--

>  SITEMAP  <

Saturday, May 16, 2020

Import and Export Price Indexes for April 2020

The Labor Department's Bureau of Labor Statistics this morning released its report on U.S. Import and Export Price Indexes for April 2020:

===============

Import Prices
Predicted: -3.0%
Actual: -2.6%

Change From 12 Months Previous: -6.8%

===============

Export Prices
Predicted: -2.3%
Actual: -3.3%

Change From 12 Months Previous: -7.0%

===============
 
The above percentages, highlighted in yellow, represent the month-to-month change in prices for:

  • Imports: the cost of goods produced in other countries and sold in the United States.
  • Exports: the cost of goods produced in the USA and sold in other countries.

Together, these indexes offer insight into the status of inflation in the United States, and for the global economy as well. The "predicted" figure is what economists were expecting, while the "actual" is the true or real figure.


===============
 
Chart: Import Price Index - April 2020 Update

===============

Chart: Export Price Index - April 2020 Update

===============


===============

Labels: , , , ,


--> www.FedPrimeRate.com Privacy Policy <--

>  SITEMAP  <

Friday, May 15, 2020

Industrial Production + Manufacturing + Capacity Utilization During April 2020

The Industrial Production, Manufacturing and Capacity Utilization numbers for April 2020 were released by the Federal Reserve this morning:

Industrial Production:
Predicted: -11.5%
Actual: -11.2%

Manufacturing:
Predicted: -11.4%
Actual: -13.7%

The yellow-highlighted percentages represent the month-to-month change in manufacturing, and physical output from mining operations, utility plants and factories for the entire United States.

Capacity Utilization Rate:
Predicted: 64.1%
Actual: 64.9

The Capacity Utilization Rate represents the use of available resources at mining operations, utility plants and factories for the entire United States last month.

The "predicted" figures are what economists were expecting, while the "actual" is the true or real figure.

From today's report:

"...Total industrial production fell 11.2 percent in April for its largest monthly drop in the 101-year history of the index, as the COVID-19 (coronavirus disease 2019) pandemic led many factories to slow or suspend operations throughout the month. Manufacturing output dropped 13.7 percent, its largest decline on record, as all major industries posted decreases. The output of motor vehicles and parts fell more than 70 percent; production elsewhere in manufacturing dropped 10.3 percent. The indexes for utilities and mining decreased 0.9 percent and 6.1 percent, respectively. At 92.6 percent of its 2012 average, the level of total industrial production was 15.0 percent lower in April than it was a year earlier. Capacity utilization for the industrial sector decreased 8.3 percentage points to 64.9 percent in April, a rate that is 14.9 percentage points below its long-run (1972–2019) average and 1.8 percentage points below its all-time (since 1967) low set in 2009.

In addition to the regular revisions that reflect incoming data, the industrial production indexes for March were revised to incorporate data on initial claims for unemployment insurance by employees who had worked in the industrial sector. The methods used to construct the estimates are described on the Federal Reserve Board's website at www.federalreserve.gov/releases/g17/g17_technical_qa.htm#covid2020ui.
.."

===============


===============


Labels: , , , , , ,


--> www.FedPrimeRate.com Privacy Policy <--

>  SITEMAP  <

Job Openings and Labor Turnover Survey (JOLTS) for March 2020

The Job Openings and Labor Turnover Survey (JOLTS*) for March 2020 was released by the Labor Department this morning:

============

Job Openings

Predicted: 5,900,000
Actual:    6,191,000

  • Previous Month (revised): 7,004,000

  • One Year Previous: 7,364,000

=============

Hires: 5,206,000

Total Separations: 14,517,000

=============

The above, yellow-highlighted percentage represents the estimated number of job openings in the United States during the indicated month. The "predicted" figure is what economists were expecting, while the "actual" is the true or real figure.

=============

From Today's Release:

"...The number of total separations increased by 8.9 million to a series high of 14.5 million in March, the U.S. Bureau of Labor Statistics reported today. Within separations, the quits rate fell to 1.8 percent and the layoffs and discharges rate increased to 7.5 percent. Job openings decreased to 6.2 million on the last business day of March. Over the month, hires declined to 5.2 million. The changes in these measures reflect the effects of the coronavirus (COVID-19) pandemic and efforts to contain it. This release includes estimates of the number and rate of job openings, hires, and separations for the total nonfarm sector, by industry, and by four geographic regions..."

=============

Chart: Job Openings, Hires and Separations - March 2020 Update
Chart: Job Openings, Hires and Separations
March 2020 Update

=============

Here's How The Labor Department Defines Total Separations:

"Total separations includes quits, layoffs and discharges, and other separations. Total separations is referred to as turnover. Quits are generally voluntary separations initiated by the employee. Therefore, the quits rate can serve as a measure of workers’ willingness or ability to leave jobs. Layoffs and discharges are involuntary separations initiated by the employer. Other separations includes separations due to retirement, death, disability, and transfers to other locations of the same firm."

=============

=============


Labels: , , , , , , , , , ,


--> www.FedPrimeRate.com Privacy Policy <--

>  SITEMAP  <

U.S. Retail And Food Services Sales Report for April 2020

The Commerce Department this morning released advance estimates of U.S. Retail and Food Services Sales for April 2020:

Predicted: -11.2%
Actual: -16.45% (-$79,530,000,000)

The yellow-highlighted percentage above represents the month-to-month change in total sales receipts for retailers that sell durable and non-durable goods, and retailers that provide food and beverage services.

=================

  • Estimated Retail Sales During April 2020: $403,946,000,000
  • Change From 12 Months Previous: -21.609% (-$111,350,000,000)

=================

Chart: Retail Sales - April 2020 Update

=================


=================


Labels: , , , , ,


--> www.FedPrimeRate.com Privacy Policy <--

>  SITEMAP  <

Thursday, May 14, 2020

New Unemployment Insurance Claims for The Week of May 9, 2020

Jobless Claims
Jobless Claims

Earlier today, the Labor Department released its weekly report on New Jobless Insurance Claims for the week that ended on May 9, 2020:

====================

Predicted: 2,500,000

  • Actual: 2,981,000
====================

The yellow-highlighted figure represents the number of first-time claims for unemployment benefits for the entire United States. The "predicted" figure is what economists were expecting, while the "actual" is the true or real figure.

  • Previous Week (revised): 3,176,000
  • 4-Week Moving Average: 3,616,500

====================

From This Morning's Report:

"...The COVID-19 virus continues to impact the number of initial claims and insured unemployment. This report now includes information on claimants filing Pandemic Unemployment Assistance and Pandemic Emergency Unemployment Compensation claims..."

====================


====================


Labels: , , , , , , , , ,


--> www.FedPrimeRate.com Privacy Policy <--

>  SITEMAP  <

Wednesday, May 13, 2020

Crude Oil Inventories Report for Week of May 8, 2020

Crude Oil Inventories

The U.S. Crude Oil Inventories report for the week that ended on May 8, 2020 was released this morning:

-- Change from Last Week: -700,000 Barrels

-- Change from A Year Ago (Y/Y): +59,400,000 Barrels

-- Current U.S. Crude Oil Stocks: 531,500,000 Barrels

Diminishing crude oil inventories often translate to higher crude oil prices (and vice versa), but not always.

The report is produced by the U.S. Energy Information Administration (EIA).


Labels: , , , , , , ,


--> www.FedPrimeRate.com Privacy Policy <--

>  SITEMAP  <

Tuesday, May 12, 2020

Consumer Price Index (CPI) for April 2020

Earlier this morning, the Labor Department's Bureau of Labor Statistics released the Consumer Price Index (CPI) for April 2020:

=========================================

Predicted: -0.8%
Actual: -0.8%

  • Change From 12 Months Previous: +0.3%

=========================================

Below is the CPI when food and energy are removed, also known as core CPI:

Predicted: -0.2%
Actual: -0.4%

  • Change From 12 Months Previous: +1.4%

=========================================

The above, yellow-highlighted figures represent the seasonally adjusted, month-to-month change in prices for a specific group of goods and services that consumers buy, and is, therefore, a very important part of the overall inflation picture for the country.

The "predicted" figure is what economists were expecting, while the "actual" is the true or real figure.

General categories that constitute the CPI are:

  • Healthcare
  • Housing
  • Clothing
  • Communications
  • Education
  • Transportation
  • Food and Beverages
  • Recreation
  • Miscellaneous Goods and Services (grooming expenses, etc.)

=========================================

From Today's Report:

"...A 20.6-percent decline in the gasoline index was the largest contributor to the monthly decrease in the seasonally adjusted all items index, but the indexes for apparel, motor vehicle insurance, airline fares, and lodging away from home all fell sharply as well. In contrast, food indexes rose in April, with the index for food at home posting its largest monthly increase since February 1974. The energy index declined mostly due to the decrease in the gasoline index, though some energy component indexes rose.

The index for all items less food and energy fell 0.4 percent in April, the largest monthly decline in the history of the series, which dates to 1957. Along with the indexes mentioned above, the indexes for used cars and trucks and recreation also declined. The indexes for rent, owners’ equivalent rent, medical care, and household furnishings and operations all increased in April.

The all items index increased 0.3 percent for the 12 months ending April, the smallest 12-month increase since October 2015. The index for all items less food and energy increased 1.4 percent over the last 12 months, its smallest increase since April 2011. The energy index fell 17.7 percent over the last year. In contrast, the food index rose 3.5 percent over the last 12 months, its largest 12-month increase since February 2012..."

 
=========================================

Chart: Consumer Price Index (CPI) - April 2020 Update

========================================= 


=========================================


Labels: , , , , ,


--> www.FedPrimeRate.com Privacy Policy <--

>  SITEMAP  <

Friday, May 08, 2020

Employment Situation Report for April 2020

The Employment Situation Report for April 2020 was released by The Department of Labor's Bureau of Labor Statistics this morning:

Nonfarm Payrolls (month-to-month change)
Predicted: -20,000,000
Actual: -20,500,000


U-3 Unemployment Rate (Headline)
Actual: 14.7%
Previous Month: 4.4%
12 Months Previous: 3.6%

U-6 Unemployment Rate*
Actual: 22.8%
Previous Month: 8.7%
12 Months Previous: 7.3%

Average Hourly Earnings (month-to-month change)
Predicted: +0.5%
Actual: +4.319% (+$1.04)

Average Hourly Earnings (year-on-year change)
Predicted: +3.0%
Actual: +7.673% (+$1.79)

Average Weekly Earnings (month-to-month change)
Actual: +4.632% (+$37.25)


Average Weekly Earnings (year-on-year change)
Actual: +7.034% (+$55.30)

Civilian Labor Force Participation Rate: 60.2%
Previous Month: 62.7%
12 Months Previous: 62.8%

Average Workweek
Predicted: 34.2 hours
Actual: 34.2 hours

Economist, academics, central bankers and investors pay very close attention to the monthly Employment Situation report as it offers penetrating insight as to the current and near-future state of the overall U.S. economy. If a) Americans are earning more money and b) the economy is creating new jobs, this typically translates to more money being pumped into the economy (and vice versa.)

The "predicted" figure is what economists were expecting, while the "actual" is the true or real figure.

===================

Chart: U-3 (Headline) Unemployment Rate - April 2020 Update
Chart: U-3 (Headline) Unemployment Rate
April 2020 Update

===================

 
Chart: Nonfarm Payroll Employment - April 2020 Update
Chart: Nonfarm Payroll Employment
April 2020 Update
===================

 * =  The U-6 Unemployment Rate is defined as:

"Total unemployed, plus all persons marginally attached to the labor force, plus total employed part time for economic reasons, as a percent of the civilian labor force plus all persons marginally attached to the labor force."


===================


 ===================


Labels: , , , , , , , , ,


--> www.FedPrimeRate.com Privacy Policy <--

>  SITEMAP  <

bing

bing


SCAMS!

FedPrimeRate.com
Entire Website © 2024 FedPrimeRate.comSM


This website is neither affiliated nor associated with The United States Federal Reserve
in any way. Information in this website is provided for educational purposes only. The owners
of this website make no warranties with respect to any and all content contained within this
website. Consult a financial professional before making important decisions related to any
investment or loan product, including, but not limited to, business loans, personal loans,
education loans, first or second mortgages, credit cards, car loans or any type of insurance.