.comment-link {margin-left:.6em;}

Economy

Economic Data (USA)

Thursday, July 30, 2020

Gross Domestic Product (GDP): First Estimate for Q2, 2020

Earlier this morning, the Commerce Department's Bureau of Economic Analysis (BEA) released its first estimate for U.S. Real Gross Domestic Product (GDP) for the second quarter of 2020:

============

Predicted: -32.0%

  • Actual: -32.9%

  • Real Consumer Spending, Quarter-to-Quarter Change: -34.6%

The yellow-highlighted percentage represents the first estimate of the quarter-to-quarter change for Real Gross Domestic Product for the entire United States.


============

"...Coronavirus (COVID-19) Impact on the Second-Quarter 2020 GDP Estimate

The decline in second quarter GDP reflected the response to COVID-19, as “stay-at-home” orders issued in March and April were partially lifted in some areas of the country in May and June, and government pandemic assistance payments were distributed to households and businesses. This led to rapid shifts in activity, as businesses and schools continued remote work and consumers and businesses canceled, restricted, or redirected their spending. The full economic effects of the COVID-19 pandemic cannot be quantified in the GDP estimate for the second quarter of 2020 because the impacts are generally embedded in source data and cannot be separately identified. For more information, see the Technical Note...

============

The GDP is a very broad measure of economic activity for the entire United States, covering all sectors of the economy. The Commerce Department defines real GDP as, "the output of goods and services produced by labor and property located in the United States."

============


CHART: GDP - Q2 2020 - First Estimate

============


============

Labels: , , , , , ,


--> www.FedPrimeRate.com Privacy Policy <--

>  SITEMAP  <

New Unemployment Insurance Claims for The Week of July 25, 2020

Jobless Claims
Jobless Claims

Earlier today, the Labor Department released its weekly report on New Jobless Insurance Claims for the week that ended on July 25, 2020:

====================

Predicted: 1,400,000

  • Actual: 1,434,000
====================

The yellow-highlighted figure represents the number of first-time claims for unemployment benefits for the entire United States. The "predicted" figure is what economists were expecting, while the "actual" is the true or real figure.

  • Previous Week (revised): 1,422,000
  • 4-Week Moving Average: 1,368,500

====================

From This Morning's Report:

"...The COVID-19 virus continues to impact the number of initial claims and insured unemployment. This report includes information on claimants filing Pandemic Unemployment Assistance and Pandemic Emergency Unemployment Compensation claims..."

====================


====================


Labels: , , , , , , , , , ,


--> www.FedPrimeRate.com Privacy Policy <--

>  SITEMAP  <

Monday, July 27, 2020

Durable Goods Orders During June 2020

The Durable Goods Orders report for June 2020 was released by the Commerce Department this morning:

================

Predicted: +8.0%

  • Actual: $206,873,000,000 (+$14,011,000,000 [+7.265%])

================

  • May 2020 (revised): $192,862,000,000 (+$25,360,000,000 [+15.1401%])
 
================

CHART: Durable Goods Orders - June 2020 Update

================

The yellow-highlighted figures represent the dollar amount of new orders for durable or hard goods for immediate or future delivery from U.S. manufacturers, along with both the dollar and month-to-month percentage change.

Examples of durable goods: cars, airplanes, computers, furniture -- items that are built to last at least three years.


================

From Today's Report:

"...Statement Regarding COVID-19 Impact: Due to recent events surrounding COVID-19, many businesses are operating on a limited capacity or have ceased operations completely. The Census Bureau has monitored response and data quality and determined estimates in this release meet publication standards. For more information on the compilation of this month's reports, see <COVID-19 FAQs>..."

================


 ================

Labels: , , , , , ,


--> www.FedPrimeRate.com Privacy Policy <--

>  SITEMAP  <

Friday, July 24, 2020

New Home Sales During June 2020

The June 2020 New Home Sales report was released by the Commerce Department this morning:

------------------------------------------------------

Predicted: 750,000
  • Actual New Home Sales: 776,000

------------------------------------------------------

  • Change from One Month Previous: +94,000 units (+13.783%)

  • Change from One Year Previous: +50,000 units (+6.887%)

------------------------------------------------------

Median Price for a New Home
during June 2020: $329,200

***************************

Average Price for a New Home
during June 2020: $384,700


------------------------------------------------------

Inventory: 307,000 (4.7 months supply at current sales rate; seasonally‐adjusted.)

------------------------------------------------------

================================


================================


Compiled jointly by the U.S. Commerce Department and the U.S. Department of Housing and Urban Development, the yellow-highlighted figure above is the seasonally adjusted and annualized number of newly-built homes with committed buyers for the indicated month.

The "predicted" figure is what economists were expecting, while the "actual" is the true or real figure.

The New Home Sales report is watched by economists and investors because it offers insight into the state of the U.S. housing market, and also provides data that can be used to predict sales of large household furniture and appliances like refrigerators, air conditioners, microwave ovens, etc.


================================

================================

From Today's Report:

"...Statement Regarding COVID‐19 Impact: Due to recent events surrounding COVID-19, many governments and businesses are operating on a limited capacity or have ceased operations completely. The Census Bureau has monitored response and data quality and determined estimates in this release meet publication standards. For more information on the compilation of this month's report, see <COVID-19 FAQs>..."

================================


Labels: , , , , , , , ,


--> www.FedPrimeRate.com Privacy Policy <--

>  SITEMAP  <

Thursday, July 23, 2020

Leading Economic Index for June 2020

The Conference Board® released its Leading Economic Index® (LEI) for June 2020 this morning:

==============

Index for June 2020: 102.0 (The baseline 100 score is associated with 2016 data.)

==============

Predicted: +3.0%
  • Actual: +2.00% (+2.00 points)

==============

  • LEI for May 2020: 100.0

  • LEI for April 2020: 96.9
     
  • LEI for March 2020: 103.4

  • LEI for February 2020: 111.8
     
  • LEI for January 2020: 112.0

  • LEI for December 2019: 111.4

  • LEI for November 2019: 111.6

  • LEI for October 2019: 111.4

  • LEI for September 2019: 111.6

==============

The yellow-highlighted percentage is the month-to-month change for the index.  The "predicted" figure is what economists were expecting, while the "actual" is the true or real figure.

The LEI is a composite of 10 of the nation's economic data releases that's put together by The Conference Board. Statistically, the components listed below have shown a significant increase or decrease before national economic upturns or downturns:

  1. The Standard + Poor's 500 Index

  2. Average weekly claims for unemployment insurance

  3. Building permits for new private housing

  4. The interest rate spread between the yield on the benchmark 10-Year Treasury Note and Federal Funds

  5. ISM® Index of New Orders

  6. Manufacturer's new orders for consumer goods or materials

  7. Manufacturers' new orders, nondefense capital goods excluding aircraft orders

  8. Average weekly manufacturing hours

  9. Average consumer expectations for business conditions

  10. Leading Credit Index™

==============

CHART: Leading Economic Index - Six-Month Growth June 2020 Update
CHART: Leading Economic Index - Six-Month Growth
June 2020 Update

==============

CHART: Leading Economic Index - June 2020 Update

==============
 
From Today's Report:

"...The Conference Board Leading Economic Index® (LEI) for the U.S. increased 2.0 percent in June to 102.0 (2016=100), following a 3.2 percent increase in May and a 6.3 percent decrease in April.

'The June increase in the LEI reflects improvements brought about by the incremental reopening of the economy, with labor market conditions and stock prices in particular contributing positively,' said Ataman Ozyildirim, Senior Director of Economic Research at The Conference Board. 'However, broader financial conditions and the consumers’ outlook on business conditions still point to a weak economic outlook. Together with a resurgence of new COVID-19 cases across much of the nation, the LEI suggests that the US economy will remain in recession territory in the near term.'
..."

==============


==============

Labels: , , , , , ,


--> www.FedPrimeRate.com Privacy Policy <--

>  SITEMAP  <

New Unemployment Insurance Claims for The Week of July 18, 2020

Jobless Claims
Jobless Claims

Earlier today, the Labor Department released its weekly report on New Jobless Insurance Claims for the week that ended on July 18, 2020:

====================

Predicted: 1,400,000

  • Actual: 1,416,000
====================

The yellow-highlighted figure represents the number of first-time claims for unemployment benefits for the entire United States. The "predicted" figure is what economists were expecting, while the "actual" is the true or real figure.

  • Previous Week (revised): 1,307,000
  • 4-Week Moving Average: 1,360,250

====================

From This Morning's Report:

"...The COVID-19 virus continues to impact the number of initial claims and insured unemployment. This report includes information on claimants filing Pandemic Unemployment Assistance and Pandemic Emergency Unemployment Compensation claims..."

====================


====================

Labels: , , , , , , , , , ,


--> www.FedPrimeRate.com Privacy Policy <--

>  SITEMAP  <

Wednesday, July 22, 2020

Crude Oil Inventories Report for Week of July 17, 2020

Crude Oil Inventories

The U.S. Crude Oil Inventories report for the week that ended on July 17, 2020 was released this morning:

-- Change from Last Week: +4,900,000 Barrels

-- Change from A Year Ago (Y/Y): +91,500,000 Barrels

-- Current U.S. Crude Oil Stocks: 536,600,000 Barrels

Diminishing crude oil inventories often translate to higher crude oil prices (and vice versa), but not always.

The report is produced by the U.S. Energy Information Administration (EIA).


Labels: , , , ,


--> www.FedPrimeRate.com Privacy Policy <--

>  SITEMAP  <

Existing Home Sales During June 2020

The Existing Home Sales report for June 2020 was released by The National Association of  Realtors® (NAR®) this morning:

Predicted: 4,500,000
Actual: 4,720,000

  •  Change from Previous Month: +20.716% (+810,000 homes)

  •  Change from One Year Previous: -11.278% (-600,000 homes)
==========

Inventory: 1,570,000 (4.0 months supply)

==========

The yellow-highlighted, "actual" figure above represents the preliminary, seasonally adjusted annualized sales count of existing homes, co-ops and condominiums for the indicated month. The "predicted" figure is what economists were expecting, while the "actual" is the true or real figure.

------------------------------------------------------

Median Price for A Used Home During June 2020: $295,300

Change from One Year Previous: +3.469% (+$9,900)

---------

Average Price for A Used Home During June 2020: $329,900

Change from One Year Previous: +2.645% (+$8,500)


------------------------------------------------------ 

==========


==========

From Today's Report:


"...Existing-home sales rebounded at a record pace in June, showing strong signs of a market turnaround after three straight months of sales declines caused by the ongoing pandemic, according to the National Association of Realtors®. Each of the four major regions achieved month-over-month growth, with the West experiencing the greatest sales recovery.

'The sales recovery is strong, as buyers were eager to purchase homes and properties that they had been eyeing during the shutdown,' said
Lawrence Yun, NAR’s chief economist. 'This revitalization looks to be sustainable for many months ahead as long as mortgage rates remain low and job gains continue.'

The
median existing-home price for all housing types in June was $295,300, up 3.5% from June 2019 ($285,400), as prices rose in every region. June’s national price increase marks 100 straight months of year-over-year gains.

'Home prices rose during the lockdown and could rise even further due to heavy buyer competition and a significant shortage of supply.'

'It’s inspiring to see Realtors® absorb the shock and unprecedented challenges of the virus-induced shutdowns and bounce back in this manner,' said NAR President Vince Malta, broker at Malta & Co., Inc., in San Francisco, Calif. 'NAR and our 1.4 million members will continue to tirelessly work to facilitate our nation’s economic recovery as we all adjust to this new normal.'.
.."

==================


==================

Labels: , , , , , , , , , ,


--> www.FedPrimeRate.com Privacy Policy <--

>  SITEMAP  <

Tuesday, July 21, 2020

Chicago Fed National Activity Index (CFNAI) for June 2020

The Federal Reserve Bank of Chicago released its National Activity Index (CFNAI) for June 2020:

==================

Predicted: -5.00
  • Actual (CFNAI): +4.11

==================

  • Previous Month (revised): +3.50
  • 3-Month Moving Average (CFNAI-MA3): -3.49
==================


The CFNAI is a weighted average of 85 indicators of growth in national economic activity drawn from four broad categories of data:

  • Production and income;
  • Employment, unemployment, and hours;
  • Personal consumption and housing; and
  • Sales, orders, and inventories.

The "predicted" figure is what economists were expecting, while the yellow-highlighted figure is what was reported.

==================

CHART: Chicago Fed National Activity Monthly Index - June 2020 Update
CHART: Chicago Fed National Activity Monthly Index
June 2020 Update

==================

From Today's Report

"...Index Suggests Economic Growth Increased Further In June

Led by improvements in production- and employment-related indicators, the Chicago Fed National Activity Index (CFNAI) increased to +4.11 in June from +3.50 in May. Three of the four broad categories of indicators used to construct the index made positive contributions in June, and two of the four categories increased from May. The index’s three-month moving average, CFNAI-MA3, moved up to –3.49 in June from –6.36 in May..
."

==================

Understanding The CFNAI:

A zero value for the monthly index has been associated with the national economy expanding at its historical trend (average) rate of growth; negative values with below-average growth (in standard deviation units); and positive values with above-average growth.

Periods of economic expansion have historically been associated with values of the CFNAI-MA3 above -0.70 and the CFNAI Diffusion Index above -0.35. Conversely, periods of economic contraction have historically been associated with values of the CFNAI-MA3 below -0.70 and the CFNAI Diffusion Index below -0.35.

An increasing likelihood of a period of sustained increasing inflation has historically been associated with values of the CFNAI-MA3 above +0.70 more than two years into an economic expansion. Similarly, a substantial likelihood of a period of sustained increasing inflation has historically been associated with values of the CFNAI-MA3 above +1.00 more than two years into an economic expansion.

==================


==================

Labels: , , , , , , , , , , , , , , , ,


--> www.FedPrimeRate.com Privacy Policy <--

>  SITEMAP  <

Friday, July 17, 2020

Consumer Sentiment: Preliminary Results for July 2020

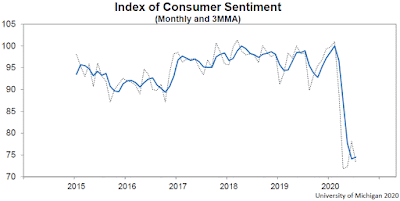
The University of Michigan's Index of Consumer Sentiment (ICS) - Preliminary Results for July 2020 was released today:

Predicted: 80.0
Actual: 73.2

  • Change from Previous Month: -6.274% (-4.9 points)
  • Change from 12 Months Previous: -25.61% (-25.2 points)

=========

  • Final ICS Reading for June 2020: 78.1

  • Final ICS Reading for July 2019: 98.4

=========

From today's report:

"...Consumer sentiment retreated in the first half of July due to the widespread resurgence of the coronavirus. The promising gain recorded in June was reversed, leaving the Sentiment Index in early July insignificantly above the April low (+1.4 points). Following the steepest two-month decline on record, it is not surprising that consumers need some time to reassess the likely economic impact from the coronavirus on their personal finances and on the overall economy. 
Unfortunately, declines are more likely in the months ahead as the coronavirus spreads and causes continued economic harm, social disruptions, and permanent scarring. Another aggressive fiscal response is urgently needed that focuses on financial relief for households as well as state and local governments. While financial relief is clearly needed for the most vulnerable households, that relief will not stimulate the extent of renewed consumer spending necessary to restore employment and income to pre-crisis levels anytime soon. No single policy could provide financial relief and stimulate economic growth, and without both, neither one could be ultimately successful.

Unfortunately, there is little time left on the political calendar for Congress to act as the election season is about to begin in earnest. Without action, another plunge in confidence and a longer recession is likely to occur..."

=========


The ICS is derived from the following five survey questions:


  1. "We are interested in how people are getting along financially these days. Would you say that you (and your family living there) are better off or worse off financially than you were a year ago?"


  2. "Now looking ahead, do you think that a year from now you (and your family living there) will be better off financially, or worse off, or just about the same as now?"


  3. "Now turning to business conditions in the country as a whole, do you think that during the next twelve months we'll have good times financially, or bad times, or what?"


  4. "Looking ahead, which would you say is more likely: that in the country as a whole we'll have continuous good times during the next five years or so, or that we will have periods of widespread unemployment or depression, or what?"


  5. "About the big things people buy for their homes, such as furniture, a refrigerator, stove, television, and things like that. Generally speaking, do you think now is a good or bad time for people to buy major household items?"

=========


=========

The ICS uses a 1966 baseline, i.e. for 1966, the ICS = 100. So any number that is below the 1966 baseline of 100 means that the folks who were polled recently aren't as optimistic about the U.S. economy as those polled back in 1966.

The ICS is similar to the Consumer Confidence Index in that they both measure consumer attitudes and offer valuable insight into consumer spending.

=========

The "predicted" figure is what economists were expecting, while the "actual" is the true or real figure.

=========

CHART: Index of Consumer Sentiment (Preliminary) - July 2020 Update
CHART: Index of Consumer Sentiment (Preliminary)
July 2020 Update
Monthly and 3-Month Moving Average

=========


=========


Labels: , , , , ,


--> www.FedPrimeRate.com Privacy Policy <--

>  SITEMAP  <

Housing Starts During June 2020

The U.S. Commerce Department this morning released its Housing Starts report for June 2020:

---------------------------------------------------

Housing Starts:
Predicted: 1,200,000
Actual: 1,186,000

Change From Previous Month: +17.31% (+175,000 units)
Change From One Year Previous: -3.968% (-49,000 units)

---------------------------------------------------

Building Permits:
Predicted: 1,300,000
Actual: 1,241,000

Change From Previous Month: +2.056% (+25,000 units)
Change From One Year Previous: -2.514% (-32,000 units)

----------------------------------------------------

Housing Starts: The top, yellow-highlighted figure is a measure of initial construction of single and multi-family residential units in the United States for the indicated month. Seasonally adjusted annual rate. The "predicted" figure is what economists were expecting, while the "actual" is the true or real figure.

If you're wondering about the demand for new homes in the United States, or about the American residential construction industry in general, then you should pay attention to the monthly Housing Starts report. This report also offers insight into specific types of consumer spending: when housing starts are up, demand for the stuff that a consumer would purchase for a new home (large appliances, consumer electronics, furniture, etc.) tends to also rise -- and vice versa.


=================

CHART: Housing Starts - June 2020 Update

=================


================

Labels: , , , , , , ,


--> www.FedPrimeRate.com Privacy Policy <--

>  SITEMAP  <

Thursday, July 16, 2020

U.S. Retail And Food Services Sales Report for June 2020

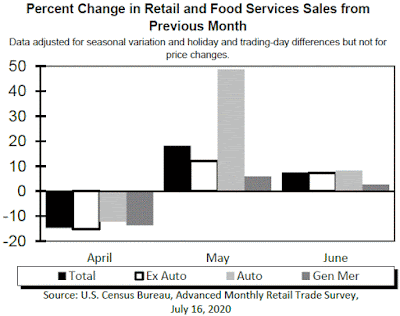
The Commerce Department this morning released advance estimates of U.S. Retail and Food Services Sales for June 2020:

Predicted: +6.0%
Actual: +7.504% (+$36,598,000,000)

The yellow-highlighted percentage above represents the month-to-month change in total sales receipts for retailers that sell durable and non-durable goods, and retailers that provide food and beverage services.

=================

  • Estimated Retail Sales During June 2020: $524,306,000,000
  • Change From 12 Months Previous: +1.098% (+$5,692,000,000)

=================

CHART: Retail Sales - June 2020 Update
=================


 From Today's Report:

"...Statement Regarding COVID-19 Impact: Due to recent events surrounding COVID-19, many businesses are operating on a limited capacity or have ceased operations completely. The Census Bureau has monitored response and data quality and determined estimates in this release meet publication standards. For more information on the compilation of this month's report, see COVID-19 FAQs..."
 
=================

=================


Labels: , , , , ,


--> www.FedPrimeRate.com Privacy Policy <--

>  SITEMAP  <

New Unemployment Insurance Claims for The Week of July 11, 2020

Jobless Claims
Jobless Claims

Earlier today, the Labor Department released its weekly report on New Jobless Insurance Claims for the week that ended on July 11, 2020:

====================

Predicted: 1,300,000

  • Actual: 1,300,000
====================

The yellow-highlighted figure represents the number of first-time claims for unemployment benefits for the entire United States. The "predicted" figure is what economists were expecting, while the "actual" is the true or real figure.

  • Previous Week (revised): 1,310,000
  • 4-Week Moving Average: 1,375,000

====================

From This Morning's Report:

"...The COVID-19 virus continues to impact the number of initial claims and insured unemployment. This report includes information on claimants filing Pandemic Unemployment Assistance and Pandemic Emergency Unemployment Compensation claims..."

====================


====================


Labels: , , , , , , , , ,


--> www.FedPrimeRate.com Privacy Policy <--

>  SITEMAP  <

Wednesday, July 15, 2020

Industrial Production + Manufacturing + Capacity Utilization During June 2020

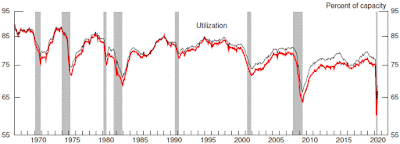
The Industrial Production, Manufacturing and Capacity Utilization numbers for June 2020 were released by the Federal Reserve this morning:

Industrial Production:
Predicted: +5.0%
Actual: +5.4%

Manufacturing:
Predicted: +6.0%
Actual: +7.2%

The yellow-highlighted percentages represent the month-to-month change in manufacturing, and physical output from mining operations, utility plants and factories for the entire United States.

Capacity Utilization Rate:
Predicted: 68.0%
Actual: 68.6

The Capacity Utilization Rate represents the use of available resources at mining operations, utility plants and factories for the entire United States last month.

The "predicted" figures are what economists were expecting, while the "actual" is the true or real figure.

From Today's Report:

"...Total industrial production rose 5.4 percent in June after increasing 1.4 percent in May; even so, it remained 10.9 percent below its pre-pandemic February level. For the second quarter as a whole, the index fell 42.6 percent at an annual rate, its largest quarterly decrease since the industrial sector retrenched after World War II. Manufacturing output climbed 7.2 percent in June, as all major industries posted increases. The largest gain—105.0 percent—was registered by motor vehicles and parts, while factory production elsewhere rose 3.9 percent. Mining production fell 2.9 percent, and the output of utilities increased 4.2 percent. At 97.5 percent of its 2012 average, the level of total industrial production was 10.8 percent lower in June than it was a year earlier. Capacity utilization for the industrial sector increased 3.5 percentage points to 68.6 percent in June, a rate that is 11.2 percentage points below its long-run (1972–2019) average but 1.9 percentage points above its trough during the Great Recession..."

===============
 
CHART: Utilization Rate - June 2020 Update

===============


===============


Labels: , , , , , ,


--> www.FedPrimeRate.com Privacy Policy <--

>  SITEMAP  <

Crude Oil Inventories Report for Week of July 10, 2020

Crude Oil Inventories

The U.S. Crude Oil Inventories report for the week that ended on July 10, 2020 was released this morning:

-- Change from Last Week: -7,500,000 Barrels

-- Change from A Year Ago (Y/Y): +75,800,000 Barrels

-- Current U.S. Crude Oil Stocks: 531,700,000 Barrels

Diminishing crude oil inventories often translate to higher crude oil prices (and vice versa), but not always.

The report is produced by the U.S. Energy Information Administration (EIA).


    Labels: , , , ,


    --> www.FedPrimeRate.com Privacy Policy <--

    >  SITEMAP  <

    Import and Export Price Indexes for June 2020

    The Labor Department's Bureau of Labor Statistics this morning released its report on U.S. Import and Export Price Indexes for June 2020:

    ===============

    Import Prices
    Predicted: +1.0%
    Actual: +1.4%

    Change From 12 Months Previous: -3.8%

    ===============

    Export Prices
    Predicted: +1.0%
    Actual: +1.4%

    Change From 12 Months Previous: -4.4%

    ===============
     
    The above percentages, highlighted in yellow, represent the month-to-month change in prices for:

    • Imports: the cost of goods produced in other countries and sold in the United States.
    • Exports: the cost of goods produced in the USA and sold in other countries.

    Together, these indexes offer insight into the status of inflation in the United States, and for the global economy as well. The "predicted" figure is what economists were expecting, while the "actual" is the true or real figure.


    ===============


    CHART: Import Price Index - June 2020 Update
    CHART: Import Price Index - June 2020 Update

    ===============


    CHART: Export Price Index - June 2020 Update
    CHART: Export Price Index - June 2020 Update

    ===============

    From Today's Report:


    "...Coronavirus (COVID-19) Pandemic Impact on June 2020 Import and Export Price Index Data

    The Bureau of Labor Statistics did not make any changes to either the collection method or estimation methodology for the June release of U.S. Import and Export Price Indexes. Survey response rates for June were 4.7-percentage points lower than those in June 2019. A small number of indexes that are normally published were not published in June..."
    ==============


    ===============


    Labels: , , , , , , ,


    --> www.FedPrimeRate.com Privacy Policy <--

    >  SITEMAP  <

    Tuesday, July 14, 2020

    Consumer Price Index (CPI) for June 2020

    Earlier this morning, the Labor Department's Bureau of Labor Statistics released the Consumer Price Index (CPI) for June 2020:

    =========================================

    Predicted: +0.4%
    Actual: +0.6%

    • Change From 12 Months Previous: +0.6%

    =========================================

    Below is the CPI when food and energy are removed, also known as core CPI:

    Predicted: +0.1%
    Actual: +0.2%

    • Change From 12 Months Previous: +1.2%

    =========================================

    The above, yellow-highlighted figures represent the seasonally adjusted, month-to-month change in prices for a specific group of goods and services that consumers buy, and is, therefore, a very important part of the overall inflation picture for the country.

    The "predicted" figure is what economists were expecting, while the "actual" is the true or real figure.

    General categories that constitute the CPI are:

    • Healthcare
    • Housing
    • Clothing
    • Communications
    • Education
    • Transportation
    • Food and Beverages
    • Recreation
    • Miscellaneous Goods and Services (grooming expenses, etc.)

    =========================================

    From Today's Report:

    "...The gasoline index rose sharply in June after recent declines and accounted for over half of the monthly increase in the seasonally adjusted all items index. The energy index increased 5.1 percent in June as the gasoline index rose 12.3 percent. The food index also rose in June, increasing 0.6 percent as the index for food at home continued to rise.

    The index for all items less food and energy rose 0.2 percent in June, its first monthly increase since February. The index for motor vehicle insurance increased sharply in June after recent declines. The indexes for apparel, shelter, and medical care also increased in June, while the indexes for used cars and trucks, recreation, and communication all declined.

    The all items index increased 0.6 percent for the 12 months ending June; this compares to a 0.1-percent increase for the 12 months ending May. The index for all items less food and energy increased 1.2 percent over the last 12 months. The food index increased 4.5 percent over the last 12 months, with the index for food at home rising 5.6 percent. Despite increasing in June, the energy index fell 12.6 percent
    over the last 12 months..."

    =============

    Coronavirus (
    COVID-19) Pandemic Impact on June 2020 Consumer Price Index Data

    Data collection by personal visit for the Consumer Price Index (CPI) program has beenbsuspended since March 16, 2020. When possible, data normally collected by personal visit were collected either online or by phone. Additionally, data collection in June was affected by the temporary closing or limited operations of certain types of establishments. These factors resulted in an increase in the number of prices considered temporarily unavailable and imputed. While the CPI program attempted to collect as much data as possible, many indexes are based on smaller amounts of collected prices than usual, and a small number of indexes that are normally published were not published this month. Additional information is available at www.bls.gov/covid19/effects-of-covid-19-pandemic-on-consumer-price-index.htm..."

     
    =========================================

    Chart: Consumer Price Index (CPI) - June 2020 Update
    Chart: Consumer Price Index (CPI) - June 2020 Update

    ========================================= 


    =========================================

    Labels: , , , , , , , ,


    --> www.FedPrimeRate.com Privacy Policy <--

    >  SITEMAP  <

    Friday, July 10, 2020

    Producer Price Index - Final Demand (PPI-FD) for June 2020

    The Producer Price Index - Final Demand (PPI-FD) for June 2020 was released this morning:

    Predicted: +0.2%
    Actual: -0.2%

    Change from 12 months previous:  -0.8%

    =============

    Below is the PPI-FD when food, energy and trade services are removed:

    Predicted: +0.2%
    Actual: +0.3%

    Change from 12 months previous:  -0.1%

    =============

    The above, yellow-highlighted percentages represent the month-to-month change in prices received by domestic producers of goods and services, for goods, services and construction in the United States, for final demand.

    Final Demand = personal consumption (consumers), exports, government purchases and capital investment.

    The PPI-FD is released by the Labor Department's Bureau of Labor Statistics.

    The "predicted" figure is what economists were expecting, while the "actual" is the true or real figure.


    ==============

    CHART: Producer Price Index - Final Demand (PPI-FD) June 2020
    CHART: Producer Price Index - Final Demand (PPI-FD)
    June 2020
    ==============

    From Today's Report:

    Coronavirus (COVID-19) Impact on June 2020 Producer Price Index Survey Data

    "...The Producer Price Index (PPI) response rates for June were consistent with those of May and no changes in estimation procedures were necessary. Additional information is available at www.bls.gov/covid19/effects-of-covid-19-pandemic-on-producer-price-index.htm..."
    ==============


    ==============


    Labels: , , , , , , , , ,


    --> www.FedPrimeRate.com Privacy Policy <--

    >  SITEMAP  <

    Thursday, July 09, 2020

    New Unemployment Insurance Claims for The Week of July 4, 2020

    Jobless Claims
    Jobless Claims

    Earlier today, the Labor Department released its weekly report on New Jobless Insurance Claims for the week that ended on July 4, 2020:

    ====================

    Predicted: 1,400,000

    • Actual: 1,314,000
    ====================

    The yellow-highlighted figure represents the number of first-time claims for unemployment benefits for the entire United States. The "predicted" figure is what economists were expecting, while the "actual" is the true or real figure.

    • Previous Week (revised): 1,413,000
    • 4-Week Moving Average: 1,437,250

    ====================

    From This Morning's Report:

    "...The COVID-19 virus continues to impact the number of initial claims and insured unemployment. This report includes information on claimants filing Pandemic Unemployment Assistance and Pandemic Emergency Unemployment Compensation claims..."

    ====================


    ====================


    Labels: , , , , , , , , ,


    --> www.FedPrimeRate.com Privacy Policy <--

    >  SITEMAP  <

    Wednesday, July 08, 2020

    Consumer Credit Status Report - May 2020

    The Consumer Credit Status Report for May, 2020 was released by the Federal Reserve earlier this afternoon:

    Total*: -5.3%

    Revolving* (e.g. credit cards): -28.6%

    Nonrevolving* (e.g. auto / student loans): +2.3%

    ============

    Previous Month Total^: -20.0%

    Previous Month Revolving^: -64.8%

    Previous Month Nonrevolving^: -4.6%

    ============

    Total Outstanding Consumer Credit (preliminary): $4,122,900,000,000

    ==================


    ==================

         * = Preliminary Data

        
    ^ = Revised Data

    ================== 

    Labels: , , , , , , , ,


    --> www.FedPrimeRate.com Privacy Policy <--

    >  SITEMAP  <

    bing

    bing


    SCAMS!

    FedPrimeRate.com
    Entire Website © 2024 FedPrimeRate.comSM


    This website is neither affiliated nor associated with The United States Federal Reserve
    in any way. Information in this website is provided for educational purposes only. The owners
    of this website make no warranties with respect to any and all content contained within this
    website. Consult a financial professional before making important decisions related to any
    investment or loan product, including, but not limited to, business loans, personal loans,
    education loans, first or second mortgages, credit cards, car loans or any type of insurance.