.comment-link {margin-left:.6em;}

Economy

Economic Data (USA)

Thursday, November 21, 2024

Existing Home Sales During October 2024

Existing Home Sales report for October 2024 was released by The National Association of Realtors® (NAR®) this morning:

======================

Previous Month: 3,830,000

  • Actual: 3,960,000
======================

  •  Change from Previous Month: +3.4% (+130,000 homes)

  •  Change from A Year Ago: +2.9% (+110,000 homes)
==========

Inventory: 1,370,000 (4.2 months supply.)

==========

The yellow-highlighted, "actual" figure above represents the preliminary, seasonally adjusted annualized sales count of existing homes, co-ops and condominiums for the indicated month. The "predicted" figure is what economists were expecting, while the "actual" is the true or real figure.

------------------------------------------------------

  • Median Price: $407,200

  • Price Change from A Year Ago: +4.00% (+$15,600)

------------------------------------------------------ 

==========

==========

From Today's Report:

"...'The worst of the downturn in home sales could be over, with increasing inventory leading to more transactions,' said NAR Chief Economist Lawrence Yun. 'Additional job gains and continued economic growth appear assured, resulting in growing housing demand. However, for most first-time homebuyers, mortgage financing is critically important. While mortgage rates remain elevated, they are expected to stabilize.'

'The ongoing price gains mean increasing wealth for homeowners nationwide,' Yun added. 'Additional inventory and more home building activity will help price increases moderate next year'..
."

==================


INFOGRAPHIC: Existing Home Sales - OCTOBER 2024 UPDATE

INFOGRAPHIC: Existing Home Sales
OCTOBER 2024 UPDATE


==================

==================
==================

Labels: , , , , , , , ,


--> www.FedPrimeRate.com Privacy Policy <--

>  SITEMAP  <

Wednesday, October 23, 2024

Existing Home Sales During September 2024

Existing Home Sales report for September 2024 was released by The National Association of Realtors® (NAR®) this morning:

======================

Previous Month: 3,880,000

  • Actual: 3,840,000
======================

  •  Change from Previous Month: -1.03% (-40,000 homes)

  •  Change from A Year Ago: -3.52% (-140,000 homes)
==========

Inventory: 1,390,000 (4.3 months supply.)

==========

The yellow-highlighted, "actual" figure above represents the preliminary, seasonally adjusted annualized sales count of existing homes, co-ops and condominiums for the indicated month. The "predicted" figure is what economists were expecting, while the "actual" is the true or real figure.

------------------------------------------------------

  • Median Price: $404,500

  • Price Change from A Year Ago: +3.00% (+$11,800)

------------------------------------------------------ 

==========

==========

From Today's Report:

"...'Home sales have been essentially stuck at around a four-million-unit pace for the past 12 months, but factors usually associated with higher home sales are developing,' said NAR Chief Economist Lawrence Yun. 'There are more inventory choices for consumers, lower mortgage rates  than a year ago and continued job additions to the economy. Perhaps, some consumers are hesitating about moving forward with a major expenditure like purchasing a home before the upcoming election.'

'More inventory is certainly good news for home buyers as it gives consumers more properties to view before making a decision,” Yun said. 'However, the inventory of distressed properties is minimal because the 
mortgage delinquency rate remains very low. Distressed property sales accounted for only 2% of all transactions in September.'..."

==================

CHART: Cost of A Used Home - September 2024 UPDATE
CHART: Cost of A Used Home
September 2024 UPDATE
==================

==================
==================

Labels: , , , , , , , ,


--> www.FedPrimeRate.com Privacy Policy <--

>  SITEMAP  <

Wednesday, September 25, 2024

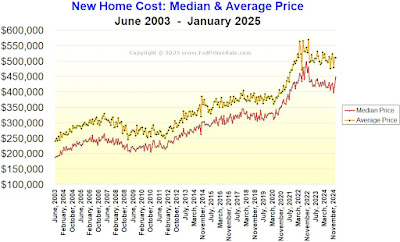
New Home Sales During August, 2024

The August, 2024 New Home Sales report was released by the Commerce Department this morning:

------------------------------------------------------

Previous Month (revised): 751,000

  • Actual New Home Sales: 716,000

------------------------------------------------------

  • Change from 1 Month Previous: -35,000 units (-4.66%)

  • Change from 1 Year Previous: +64,000 units (+9.82%)


------------------------------------------------------

Median Price for a New Home
During August, 2024: $420,600
 

***************************

Average Price for a New Home
During August, 2024: $492,700

------------------------------------------------------

Inventory: 467,000 (7.8 months supply at current sales rate; seasonally‐adjusted estimate.)

------------------------------------------------------

================================

CHART: New Home Sales AUGUST, 2024 Update
CHART: New Home Sales
AUGUST, 2024 Update

================================


================================


Compiled jointly by the U.S. Commerce Department and the U.S. Department of Housing and Urban Development, the yellow-highlighted figure above is the seasonally adjusted and annualized number of newly-built homes with committed buyers for the indicated month.

The "predicted" figure is what economists were expecting, while the "actual" is the true or real figure.

The New Home Sales report is watched by economists and investors because it offers insight into the state of the U.S. housing market, and also provides data that can be used to predict sales of large household furniture and appliances like refrigerators, air conditioners, microwave ovens, etc.


================================

================================

Labels: , , , , , , , ,


--> www.FedPrimeRate.com Privacy Policy <--

>  SITEMAP  <

Friday, September 20, 2024

Existing Home Sales During August 2024

Existing Home Sales report for August 2024 was released by The National Association of Realtors® (NAR®) this morning:

======================

Previous Month: 3,960,000

  • Actual: 3,860,000
======================

  •  Change from Previous Month: -2.53% (-100,000 homes)

  •  Change from A Year Ago: -4.22% (-170,000 homes)
==========

Inventory: 1,350,000 (4.2 months supply.)

==========

The yellow-highlighted, "actual" figure above represents the preliminary, seasonally adjusted annualized sales count of existing homes, co-ops and condominiums for the indicated month. The "predicted" figure is what economists were expecting, while the "actual" is the true or real figure.

------------------------------------------------------

  • Median Price: $416,700

  • Price Change from A Year Ago: +3.09% (+$12,500)

------------------------------------------------------ 

==========

==========

From Today's Report:

"...'Home sales were disappointing again in August, but the recent development of lower mortgage rates coupled with increasing inventory is a powerful combination that will provide the environment for sales to move higher in future months,' said NAR Chief Economist Lawrence Yun. 'The home-buying process, from the initial search to getting the house keys, typically takes several months.'

'The rise in inventory -- and, more technically, the accompanying months’ supply -- implies home buyers are in a much-improved position to find the right home and at more favorable prices,' Yun added. 'However, in areas where supply remains limited, like many markets in the Northeast, sellers still appear to hold the upper hand.'..
."

==================

INFOGRAPHIC: Existing Home Sales - AUGUST  2024 UPDATE
INFOGRAPHIC: Existing Home Sales

AUGUST 2024 UPDATE
==================


==================

Labels: , , , , , , , ,


--> www.FedPrimeRate.com Privacy Policy <--

>  SITEMAP  <

Friday, August 23, 2024

New Home Sales During July, 2024

The July, 2024 New Home Sales report was released by the Commerce Department this morning:

------------------------------------------------------

Previous Month (revised): 668,000

  • Actual New Home Sales: 739,000

------------------------------------------------------

  • Change from 1 Month Previous: +71,000 units (+10.63%)

  • Change from 1 Year Previous: +39,000 units (+5.57%)


------------------------------------------------------

Median Price for a New Home
During July, 2024: $429,800
 

***************************

Average Price for a New Home
During July, 2024: $514,800

------------------------------------------------------

Inventory: 462,000 (7.5 months supply at current sales rate; seasonally‐adjusted estimate.)

------------------------------------------------------

================================

CHART: New Home Sales - JULY, 2024 Update
CHART: New Home Sales
JULY, 2024 Update

================================


================================


Compiled jointly by the U.S. Commerce Department and the U.S. Department of Housing and Urban Development, the yellow-highlighted figure above is the seasonally adjusted and annualized number of newly-built homes with committed buyers for the indicated month.

The "predicted" figure is what economists were expecting, while the "actual" is the true or real figure.

The New Home Sales report is watched by economists and investors because it offers insight into the state of the U.S. housing market, and also provides data that can be used to predict sales of large household furniture and appliances like refrigerators, air conditioners, microwave ovens, etc.


================================

================================ 


Labels: , , , , , , , ,


--> www.FedPrimeRate.com Privacy Policy <--

>  SITEMAP  <

Thursday, August 22, 2024

Existing Home Sales During July 2024

Existing Home Sales report for July 2024 was released by The National Association of Realtors® (NAR®) this morning:

======================

Previous Month: 3,900,000

  • Actual: 3,950,000
======================

  •  Change from Previous Month: +1.28% (+50,000 homes)

  •  Change from A Year Ago: -2.47% (-100,000 homes)
==========

Inventory: 1,330,000 (4.0 months supply.)

==========

The yellow-highlighted, "actual" figure above represents the preliminary, seasonally adjusted annualized sales count of existing homes, co-ops and condominiums for the indicated month. The "predicted" figure is what economists were expecting, while the "actual" is the true or real figure.

------------------------------------------------------

  • Median Price: $422,600

  • Price Change from A Year Ago: +4.19% (+$17,000)

------------------------------------------------------ 

==========

==========

From Today's Report:

"..."Despite the modest gain, home sales are still sluggish," said NAR Chief Economist Lawrence Yun. "But consumers are definitely seeing more choices, and affordability is improving due to lower interest rates."..."

==================

INFOGRAPHIC: Existing Home Sales - JULY UPDATE
INFOGRAPHIC: Existing Home Sales
JULY UPDATE
==================


==================

Labels: , , , , , , , ,


--> www.FedPrimeRate.com Privacy Policy <--

>  SITEMAP  <

Monday, July 29, 2024

New Home Sales During June, 2024

The June, 2024 New Home Sales report was released by the Commerce Department this morning:

------------------------------------------------------

Previous Month (revised): 621,000

  • Actual New Home Sales: 617,000

------------------------------------------------------

  • Change from 1 Month Previous: -4,000 units (-0.644%)

  • Change from 1 Year Previous: -49,000 units (-7.36%)


------------------------------------------------------

Median Price for a New Home
During June, 2024: $417,300
 

***************************

Average Price for a New Home
During June, 2024: $487,200

------------------------------------------------------

Inventory: 480,000 (9.1 months supply at current sales rate; seasonally‐adjusted estimate.)

------------------------------------------------------

================================

CHART: New Home Sales - June, 2024 Update
CHART: New Home Sales
June, 2024 Update

================================


================================


Compiled jointly by the U.S. Commerce Department and the U.S. Department of Housing and Urban Development, the yellow-highlighted figure above is the seasonally adjusted and annualized number of newly-built homes with committed buyers for the indicated month.

The "predicted" figure is what economists were expecting, while the "actual" is the true or real figure.

The New Home Sales report is watched by economists and investors because it offers insight into the state of the U.S. housing market, and also provides data that can be used to predict sales of large household furniture and appliances like refrigerators, air conditioners, microwave ovens, etc.


================================

================================ 

Labels: , , , , , , , ,


--> www.FedPrimeRate.com Privacy Policy <--

>  SITEMAP  <

Wednesday, July 24, 2024

Existing Home Sales During June 2024

Existing Home Sales report for June 2024 was released by The National Association of Realtors® (NAR®) this morning:

======================

Previous Month: 4,110,000

  • Actual: 3,890,000
======================

  •  Change from Previous Month: -5.35% (-220,000 homes)

  •  Change from A Year Ago: -5.35% (-220,000 homes)
==========

Inventory: 1,320,000 (4.1 months supply.)

==========

The yellow-highlighted, "actual" figure above represents the preliminary, seasonally adjusted annualized sales count of existing homes, co-ops and condominiums for the indicated month. The "predicted" figure is what economists were expecting, while the "actual" is the true or real figure.

------------------------------------------------------

  • Median Price: $426,900

  • Price Change from A Year Ago: +4.097% (+$16,800)

------------------------------------------------------ 

==========

==========

From Today's Report:

"...Existing-home sales fell in June as the median sales price climbed to the highest price ever recorded for the second consecutive month, according to the National Association of REALTORS®. All four major U.S. regions posted sales declines. Year-over-year, sales waned in the Northeast, Midwest and South but were unchanged in the West.

'We're seeing a slow shift from a seller's market to a buyer's market,' said NAR Chief Economist Lawrence Yun. 'Homes are sitting on the market a bit longer, and sellers are receiving fewer offers. More buyers are insisting on home inspections and appraisals, and inventory is definitively rising on a national basis.'

Total housing inventory registered at the end of June was 1.32 million units, up 3.1% from May and 23.4% from one year ago (1.07 million). Unsold inventory sits at a 4.1-month supply at the current sales pace, up from 3.7 months in May and 3.1 months in June 2023. The last time unsold inventory posted a four-month supply was May 2020 (4.5 months.)

The median existing-home price for all housing types in June was $426,900, an all-time high and an increase of 4.1% from one year ago ($410,100). All four U.S. regions registered price gains.

'Even as the median home price reached a new record high, further large accelerations are unlikely,' Yun added. 'Supply and demand dynamics are nearing a balanced market condition. The months supply of inventory reached its highest level in more than four years.'..
."


==================

INFOGRAPHIC: Existing Home Sales JUNE UPDATE
INFOGRAPHIC: Existing Home Sales

JUNE UPDATE

==================


==================

Labels: , , , , , , , ,


--> www.FedPrimeRate.com Privacy Policy <--

>  SITEMAP  <

Monday, May 27, 2024

New Home Sales During April, 2024

The April, 2024 New Home Sales report was released by the Commerce Department this morning:

------------------------------------------------------

Previous Month (revised): 665,000

  • Actual New Home Sales: 634,000

------------------------------------------------------

  • Change from 1 Month Previous: -31,000 units (-4.66%)

  • Change from 1 Year Previous: -53,000 units (-7.71%)


------------------------------------------------------

Median Price for a New Home
During April, 2024: $433,500
 

***************************

Average Price for a New Home
During April, 2024: $505,700

------------------------------------------------------

Inventory: 480,000 (9.1 months supply at current sales rate; seasonally‐adjusted estimate.)

------------------------------------------------------

================================


CHART: New Home Sales - April, 2024 Update
CHART: New Home Sales
April, 2024 Update

================================


================================


Compiled jointly by the U.S. Commerce Department and the U.S. Department of Housing and Urban Development, the yellow-highlighted figure above is the seasonally adjusted and annualized number of newly-built homes with committed buyers for the indicated month.

The "predicted" figure is what economists were expecting, while the "actual" is the true or real figure.

The New Home Sales report is watched by economists and investors because it offers insight into the state of the U.S. housing market, and also provides data that can be used to predict sales of large household furniture and appliances like refrigerators, air conditioners, microwave ovens, etc.


================================

================================

Labels: , , , , , , , ,


--> www.FedPrimeRate.com Privacy Policy <--

>  SITEMAP  <

Thursday, May 23, 2024

Existing Home Sales During April 2024

Existing Home Sales report for April 2024 was released by The National Association of Realtors® (NAR®) this morning:

======================

Previous Month: 4,220,000

  • Actual: 4,140,000
======================

  •  Change from Previous Month: -1.9% (-80,000 homes)

  •  Change from A Year Ago: -1.9% (-80,000 homes)
==========

Inventory: 1,210,000 (3.5 months supply.)

==========

The yellow-highlighted, "actual" figure above represents the preliminary, seasonally adjusted annualized sales count of existing homes, co-ops and condominiums for the indicated month. The "predicted" figure is what economists were expecting, while the "actual" is the true or real figure.

------------------------------------------------------

  • Median Price: $407,600

  • Price Change from A Year Ago: +5.65% (+$21,800)


------------------------------------------------------ 

==========


==========

From Today's Report:

"...According to Freddie Mac, the 30-year fixed-rate mortgage averaged 7.02% as of May 16. That's down from 7.09% the previous week but up from 6.39% one year ago..."


==================

 INFOGRAPHIC: Existing Home Sales - APRIL 2024 UPDATE

INFOGRAPHIC: Existing Home Sales
APRIL 2024 UPDATE
==================


==================
 

Labels: , , , , , , , , ,


--> www.FedPrimeRate.com Privacy Policy <--

>  SITEMAP  <

Tuesday, February 27, 2024

New Home Sales During January, 2024

The January, 2024 New Home Sales report was released by the Commerce Department this morning:

------------------------------------------------------

Previous Month (revised): 651,000

  • Actual New Home Sales: 661,000

------------------------------------------------------

  • Change from 1 Month Previous: +10,000 units (+1.54%)

  • Change from 1 Year Previous: +12,000 units (+1.85%)


------------------------------------------------------

Median Price for a New Home
During January, 2024: $420,700
 

***************************

Average Price for a New Home
During January, 2024: $534,300

------------------------------------------------------

Inventory: 456,000 (8.3 months supply at current sales rate; seasonally‐adjusted estimate.)

------------------------------------------------------

================================

CHART: New Home Sales - January, 2024 Update
CHART: New Home Sales
January, 2024 Update

================================


================================


Compiled jointly by the U.S. Commerce Department and the U.S. Department of Housing and Urban Development, the yellow-highlighted figure above is the seasonally adjusted and annualized number of newly-built homes with committed buyers for the indicated month.

The "predicted" figure is what economists were expecting, while the "actual" is the true or real figure.

The New Home Sales report is watched by economists and investors because it offers insight into the state of the U.S. housing market, and also provides data that can be used to predict sales of large household furniture and appliances like refrigerators, air conditioners, microwave ovens, etc.


================================

================================

Labels: , , , , , , , ,


--> www.FedPrimeRate.com Privacy Policy <--

>  SITEMAP  <

Thursday, October 26, 2023

New Home Sales During September 2023

The September 2023 New Home Sales report was released by the Commerce Department this morning:

------------------------------------------------------

Previous Month (revised): 676,000
  • Actual New Home Sales: 759,000

------------------------------------------------------

  • Change from 1 Month Previous: +83,000 units (+12.28%)

  • Change from 1 Year Previous: +192,000 units (+33.86%)


------------------------------------------------------

Median Price for a New Home
During September 2023: $418,800 
 

***************************

Average Price for a New Home
During September 2023: $503,900

------------------------------------------------------

Inventory: 435,000 (6.9 months supply at current sales rate; seasonally‐adjusted estimate.)

------------------------------------------------------

================================

CHART: New Home Sales - September 2023 Update
CHART: New Home Sales
September 2023 Update

================================


================================


Compiled jointly by the U.S. Commerce Department and the U.S. Department of Housing and Urban Development, the yellow-highlighted figure above is the seasonally adjusted and annualized number of newly-built homes with committed buyers for the indicated month.

The "predicted" figure is what economists were expecting, while the "actual" is the true or real figure.

The New Home Sales report is watched by economists and investors because it offers insight into the state of the U.S. housing market, and also provides data that can be used to predict sales of large household furniture and appliances like refrigerators, air conditioners, microwave ovens, etc.


================================

================================

Labels: , , , , , , , ,


--> www.FedPrimeRate.com Privacy Policy <--

>  SITEMAP  <

Wednesday, August 23, 2023

New Home Sales During July 2023

The July 2023 New Home Sales report was released by the Commerce Department this morning:

------------------------------------------------------

Previous Month (revised): 684,000
  • Actual New Home Sales: 714,000

------------------------------------------------------

  • Change from 1 Month Previous: +30,000 units (+4.39%)

  • Change from 1 Year Previous: +171,000 units (+31.49%)


------------------------------------------------------

Median Price for a New Home
During July 2023: $436,700 
 

***************************

Average Price for a New Home
During July 2023: $513,000

------------------------------------------------------

Inventory: 437,000 (7.3 months supply at current sales rate; seasonally‐adjusted estimate.)

------------------------------------------------------

================================

CHART: New Home Sales - July 2023 Update
CHART: New Home Sales
July 2023 Update

================================


================================


Compiled jointly by the U.S. Commerce Department and the U.S. Department of Housing and Urban Development, the yellow-highlighted figure above is the seasonally adjusted and annualized number of newly-built homes with committed buyers for the indicated month.

The "predicted" figure is what economists were expecting, while the "actual" is the true or real figure.

The New Home Sales report is watched by economists and investors because it offers insight into the state of the U.S. housing market, and also provides data that can be used to predict sales of large household furniture and appliances like refrigerators, air conditioners, microwave ovens, etc.


================================

================================


Labels: , , , , , , , ,


--> www.FedPrimeRate.com Privacy Policy <--

>  SITEMAP  <

Tuesday, August 22, 2023

Existing Home Sales During July 2023

The Existing Home Sales report for July 2023 was released by The National Association of Realtors® (NAR®) this morning:

======================

Previous Month: 4,160,000

  • Actual: 4,070,000
======================

  •  Change from Previous Month: -2.16% (-9,000 homes)

  •  Change from A Year Ago: -16.6% (-81,000 homes)
==========

Inventory: 1,110,000 (3.3 months supply.)

==========

The yellow-highlighted, "actual" figure above represents the preliminary, seasonally adjusted annualized sales count of existing homes, co-ops and condominiums for the indicated month. The "predicted" figure is what economists were expecting, while the "actual" is the true or real figure.

------------------------------------------------------

  • Median Price: $406,700

  • Price Change from A Year Ago: +1.93% (+$7,000)


------------------------------------------------------ 

==========


==========

From Today's Report:

"...'Two factors are driving current sales activity – inventory availability and mortgage rates,' said NAR Chief Economist Lawrence Yun. 'Unfortunately, both have been unfavorable to buyers.'

'Most homeowners continue to enjoy large wealth gains from recent years with little concern about home price declines,' Yun said. 'However, many renters are concerned as they’re facing growing affordability challenges because of high interest rates.'

According to Freddie Mac, the 30-year fixed-rate mortgage averaged 7.09% as of August 17. That’s up from 6.96% the prior week and 5.13% one year ago.
.."

==================


==================

INFOGRAPHIC: Existing Home Sales - July 2023 UPDATE

INFOGRAPHIC: Existing Home Sales
July 2023 UPDATE


==================


==================

Labels: , , , , , , , , ,


--> www.FedPrimeRate.com Privacy Policy <--

>  SITEMAP  <

Thursday, July 27, 2023

New Home Sales During June 2023

The June 2023 New Home Sales report was released by the Commerce Department this morning:

------------------------------------------------------

Predicted: 710,000
  • Actual New Home Sales: 697,000

------------------------------------------------------

  • Change from 1 Month Previous: -18,000 units (-2.517%)

  • Change from 1 Year Previous: +134,000 units (+23.801%)


------------------------------------------------------

Median Price for a New Home
During June 2023: $415,400 
 

***************************

Average Price for a New Home
During June 2023: $494,700

------------------------------------------------------

Inventory: 432,000 (7.4 months supply at current sales rate; seasonally‐adjusted estimate.)

------------------------------------------------------

================================

 CHART: New Home Sales - June 2023 Update

CHART: New Home Sales
June 2023 Update

================================


================================


Compiled jointly by the U.S. Commerce Department and the U.S. Department of Housing and Urban Development, the yellow-highlighted figure above is the seasonally adjusted and annualized number of newly-built homes with committed buyers for the indicated month.

The "predicted" figure is what economists were expecting, while the "actual" is the true or real figure.

The New Home Sales report is watched by economists and investors because it offers insight into the state of the U.S. housing market, and also provides data that can be used to predict sales of large household furniture and appliances like refrigerators, air conditioners, microwave ovens, etc.


================================

================================


Labels: , , , , , , , ,


--> www.FedPrimeRate.com Privacy Policy <--

>  SITEMAP  <

Wednesday, June 28, 2023

New Home Sales During May 2023

The May 2023 New Home Sales report was released by the Commerce Department this morning:

------------------------------------------------------

Predicted: 700,000
  • Actual New Home Sales: 763,000

------------------------------------------------------

  • Change from One Month Previous: +83,000 units (+12.206%)

  • Change from One Year Previous: +127,000 units (+19.97%)


------------------------------------------------------

Median Price for a New Home
During May 2023: $416,300 
 

***************************

Average Price for a New Home
During May 2023: $487,300

------------------------------------------------------

Inventory: 428,000 (6.7 months supply at current sales rate; seasonally‐adjusted estimate.)

------------------------------------------------------

================================

 CHART: New Home Sales - May 2023 Update
CHART: New Home Sales
May 2023 Update

================================


================================


Compiled jointly by the U.S. Commerce Department and the U.S. Department of Housing and Urban Development, the yellow-highlighted figure above is the seasonally adjusted and annualized number of newly-built homes with committed buyers for the indicated month.

The "predicted" figure is what economists were expecting, while the "actual" is the true or real figure.

The New Home Sales report is watched by economists and investors because it offers insight into the state of the U.S. housing market, and also provides data that can be used to predict sales of large household furniture and appliances like refrigerators, air conditioners, microwave ovens, etc.


================================

================================

Labels: , , , , , , , ,


--> www.FedPrimeRate.com Privacy Policy <--

>  SITEMAP  <

Friday, May 26, 2023

Chicago Fed National Activity Index (CFNAI) for April 2023

Federal Reserve Bank of Chicago released its National Activity Index (CFNAI) for April 2023:

==================

Predicted: -0.20
  • Actual (CFNAI): +0.07

==================

  • Previous Month (revised): -0.37
  • 3-Month Moving Average (CFNAI-MA3): -0.22
==================

The CFNAI is a weighted average of 85 indicators of growth in national economic activity drawn from four broad categories of data:

  • Production and income;
  • Employment, unemployment, and hours;
  • Personal consumption and housing; and
  • Sales, orders, and inventories.

The "predicted" figure is what economists were expecting, while the yellow-highlighted figure is what was reported.

==================
 
CHART: CFNAI-MA3 with Inflation Cycles - April 2023 Update

 CHART: CFNAI-MA3 with Inflation Cycles
April 2023 Update

====================


Understanding The CFNAI:

A zero value for the monthly index has been associated with the national economy expanding at its historical trend (average) rate of growth; negative values with below-average growth (in standard deviation units); and positive values with above-average growth.

Periods of economic expansion have historically been associated with values of the CFNAI-MA3 above -0.70 and the CFNAI Diffusion Index above -0.35. Conversely, periods of economic contraction have historically been associated with values of the CFNAI-MA3 below -0.70 and the CFNAI Diffusion Index below -0.35.

An increasing likelihood of a period of sustained increasing inflation has historically been associated with values of the CFNAI-MA3 above +0.70 more than two years into an economic expansion. Similarly, a substantial likelihood of a period of sustained increasing inflation has historically been associated with values of the CFNAI-MA3 above +1.00 more than two years into an economic expansion.

==================


==================
 

Labels: , , , , , , , , , , , , ,


--> www.FedPrimeRate.com Privacy Policy <--

>  SITEMAP  <

bing

bing


SCAMS!

FedPrimeRate.com
Entire Website © 2024 FedPrimeRate.comSM


This website is neither affiliated nor associated with The United States Federal Reserve
in any way. Information in this website is provided for educational purposes only. The owners
of this website make no warranties with respect to any and all content contained within this
website. Consult a financial professional before making important decisions related to any
investment or loan product, including, but not limited to, business loans, personal loans,
education loans, first or second mortgages, credit cards, car loans or any type of insurance.