.comment-link {margin-left:.6em;}

Economy

Economic Data (USA)

Friday, February 15, 2019

All 3 Major Indexes Advanced On The Week

Summary of U.S. Markets for the Week Ending February 15, 2019:

===================================

Dow Jones Industrial Average (DJIA) closed @ 25,883.25:

- added 776.92 points (+3.095%) on the week.
- lost 945.14 points (-3.523%) since the October 3, 2018 record-high close (26,828.39.)

---------------------------
S and P 500 Index closed @ 2,775.60:

- gained 67.72 points (+2.501%) on the week.
- lost 155.15 points (-5.294%) since the September 20, 2018 record-high close (2,930.75.)

--------------------------- 

NASDAQ Composite Index closed @ 7,472.41:

- added 174.21 points (+2.387%) on the week.
- lost 637.28 points (-7.858%) since the August 29, 2018 record-high close (8,109.69.)

===================================

- NYMEX Crude Oil for Future Delivery closed @ $55.59 per barrel

- Comex Gold for April 2019 delivery closed @ $1,322.10 per troy ounce

- In New York, a U.S. dollar buys 0.885 euros

- In New York, a Euro buys 1.1298 U.S. dollars

- The United States Prime Rate is 5.50%

- The Target Range for the Fed Funds Rate is 2.25% - 2.50%

- The yield on the 10-Year Treasury Note is currently @ 2.66%


===================================


Labels: , , , , , , , , , , ,


--> www.FedPrimeRate.com Privacy Policy <--

>  SITEMAP  <

Saturday, January 26, 2019

The S&P 500 Index Lost 0.223% On The Week

Summary of U.S. Markets for the Week Ending January 25, 2019:

===================================

Dow Jones Industrial Average (DJIA) closed @ 24,737.20:

- added 30.85 points (+0.125%) on the week.
- lost 2,091.19 points (-7.795%) since the October 3, 2018 record-high close (26,828.39.)

---------------------------

S and P 500 Index closed @ 2,664.76:

- gave up 5.95 points (-0.223%) on the week.
- lost 265.99 points (-9.076%) since the September 20, 2018 record-high close (2,930.75.)

--------------------------- 

NASDAQ Composite Index closed @ 7,164.86:

- gained 7.63 points (+0.107%) on the week.
- lost 944.83 points (-11.651%) since the August 29, 2018 record-high close (8,109.69.)

===================================

- NYMEX Crude Oil for Future Delivery closed @ $53.69 per barrel

- Comex Gold for April 2019 delivery closed @ $1,304.20 per troy ounce

- In New York, a U.S. dollar buys 0.8766 euros

- In New York, a Euro buys 1.1412 U.S. dollars

- The United States Prime Rate is 5.50%

- The Target Range for the Fed Funds Rate is 2.25% - 2.50%

- The yield on the 10-Year Treasury Note is currently @ 2.76%

===================================


Labels: , , , , , , , , , , ,


--> www.FedPrimeRate.com Privacy Policy <--

>  SITEMAP  <

Friday, October 12, 2018

All 3 Major Stock Market Indices Lost Ground On The Week

Summary of U.S. Markets for the Week Ending October 12, 2018:

===================================

Dow Jones Industrial Average (DJIA) closed @ 25,339.99:

- lost 1,107.06 points (-4.186%) on the week.
- lost 1,488.40  points (-5.548%) since the October 3, 2018 record-high close (26,828.39.)

---------------------------

S and P 500 Index closed @ 2,767.13:

- lost 118.44 points (-4.105%) on the week.
- lost 163.62 points (-5.583%) since the September 20, 2018 record-high close (2,930.75.)

--------------------------- 

NASDAQ Composite Index closed @ 7,496.89:

- lost 291.56 points (-3.743%) on the week.
- lost 612.80 points (-7.556%) since the August 29, 2018 record-high close (8,109.69.)

===================================

- NYMEX Crude Oil for Future Delivery closed @ $71.34 per barrel

- Comex Gold for December 2018 delivery closed @ $1,222.00 per troy ounce

- In New York, a U.S. dollar buys 0.8651 euros

- In New York, a Euro buys 1.1560 U.S. dollars

- The United States Prime Rate is 5.25%

- The Target Range for the Fed Funds Rate is 2.00% - 2.25%

- The yield on the 10-Year Treasury Note is currently @ 3.15%


===================================

Chart: Standard and Poor's 500 Index - October 12, 2018 Update

===================================

Closing Currency Cross Rates - October 12, 2018

===================================


Labels: , , , , , , , , , , ,


--> www.FedPrimeRate.com Privacy Policy <--

>  SITEMAP  <

Friday, May 18, 2018

All 3 Major Stock Market Indexes Declined On The Week

Summary of U.S. Markets for the Week Ending May 18, 2018:

===================================

Dow Jones Industrial Average (DJIA) closed @ 24,715.09:

- lost 116.08 points (-0.467%) on the week.
- lost 1,901.62 points (-7.144%) since the January 26, 2018 record-high close (26,616.71.)

---------------------------

S and P 500 Index closed @ 2,712.97:

- lost 14.75 points (-0.541%) on the week.
- lost 159.90 points (-5.566%) since the January 26, 2018 record-high close (2,872.87.)

--------------------------- 

NASDAQ Composite Index closed @ 7,354.34:

- lost 48.54 points (-0.656%) on the week.
- lost 233.98 points (-3.083%) since the March 12, 2018 record-high close (7,588.32.)

===================================

- NYMEX Crude Oil for Future Delivery closed @ $71.28 per barrel

- Comex Gold for June delivery closed @ $1,291.30 per ounce

- In New York, the U.S. dollar buys 0.84962 euros

- In New York, the euro buys 1.1770 U.S. dollars

- The United States Prime Rate is 4.75%

- The Target Range for the Fed Funds Rate is 1.50% - 1.75%

- The yield on the 10-Year Treasury Note is currently @ 3.06%


===================================

Standard and Poor's 500 Index Chart Through May 18, 2018

===================================

Closing Currency Cross Rates - May 18, 2018

===================================


Labels: , , , , , , , , , , ,


--> www.FedPrimeRate.com Privacy Policy <--

>  SITEMAP  <

Saturday, April 14, 2018

All 3 Major Stock Market Indices Advanced On The Week

Summary of U.S. Markets for the Week Ending April 13, 2018:

===================================

Dow Jones Industrial Average (DJIA) closed @ 24,360.14:

- added 427.38 points (+1.786%) on the week.
- lost 2,256.57 points (-8.478%) since the January 26, 2018 record-high close (26,616.71.)

---------------------------

S and P 500 Index closed @ 2,656.30:

- added 51.83 points (+1.99%) on the week.
- lost 216.57 points (-7.538%) since the January 26, 2018 record-high close (2,872.87.)

--------------------------- 

NASDAQ Composite Index closed @ 7,106.65:

- added 191.54 points (+2.77%) on the week.
- lost 481.67 points (-6.348%) since the March 12, 2018 record-high close (7,588.32.)

===================================

- NYMEX Crude Oil for Future Delivery closed @ $67.39 per barrel

- Comex Gold for April delivery closed @ $1,347.90 per ounce

- In New York, the U.S. dollar buys 0.81103 euros

- In New York, the euro buys 1.2330 U.S. dollars

- The United States Prime Rate is 4.75%

- The Target Range for the Fed Funds Rate is 1.50% - 1.75%

- The yield on the 10-Year Treasury Note is currently @ 2.82%


===================================

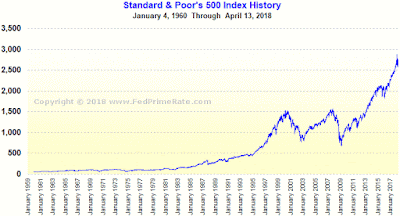
Standard and Poor's 500 Index Chart Through April 13, 2018

===================================

Labels: , , , , , , , , ,


--> www.FedPrimeRate.com Privacy Policy <--

>  SITEMAP  <

Friday, April 06, 2018

All 3 Major Stock Market Indices Lost Ground On The Week

Summary of U.S. Markets for the Week Ending April 6, 2018:

===================================

Dow Jones Industrial Average (DJIA) closed @ 23,932.76:

- lost 170.35 points (-0.7068%) on the week.
- lost 2,683.95 points (-10.084%) since the January 26, 2018 record-high close (26,616.71.)

---------------------------
S and P 500 Index closed @ 2,604.47:

- lost 36.40 points (-1.378%) on the week.
- lost 268.40 points (-9.343%) since the January 26, 2018 record-high close (2,872.87.)

--------------------------- 

NASDAQ Composite Index closed @ 6,915.11:

- lost 148.33 points (-2.1%) on the week.
- lost 673.21 points (-8.872%) since the March 12, 2018 record-high close (7,588.32.)

===================================

- NYMEX Crude Oil for Future Delivery closed @ $62.06 per barrel

- Comex Gold for April delivery closed @ $1,336.10 per ounce

- In New York, the U.S. dollar buys 0.81420 euros

- In New York, the euro buys 1.2282 U.S. dollars

- The United States Prime Rate is 4.75%

- The Target Range for the Fed Funds Rate is 1.50% - 1.75%

- The yield on the 10-Year Treasury Note is currently @ 2.77%


===================================

Standard and Poor's 500 Index Chart Through April 6, 2018

===================================

Labels: , , , , , , , , ,


--> www.FedPrimeRate.com Privacy Policy <--

>  SITEMAP  <

Friday, March 23, 2018

Sharp Declines For All 3 Major Stock Market Indexes On The Week

Summary of U.S. Markets for the Week Ending March 23, 2018:

===================================

Dow Jones Industrial Average (DJIA) closed @ 23,533.20:

- lost 1,413.31 points (-5.665%) on the week.
- lost 3,083.51  points (-11.585%) since the January 26, 2018 record-high close (26,616.71.)

---------------------------
S and P 500 Index closed @ 2,588.26:

- lost 163.75 points (-5.95%) on the week.
- lost 284.61 points (-9.907%) since the January 26, 2018 record-high close (2,872.87.)

--------------------------- 

NASDAQ Composite Index closed @ 6,992.67:

- lost 489.32 points (-6.54%) on the week.
- lost 595.65 points (-7.85%) since the March 12, 2018 record-high close (7,588.32.)

===================================

- NYMEX Crude Oil for Future Delivery closed @ $65.88 per barrel

- Comex Gold for April delivery closed @ $1,355.70 per ounce

- In New York, the U.S. dollar buys 0.80939 euros

- In New York, the euro buys 1.2355 U.S. dollars

- The United States Prime Rate is 4.75%

- The Target Range for the Fed Funds Rate is 1.50% - 1.75%

- The yield on the 10-Year Treasury Note is currently @ 2.82%


===================================

Standard and Poor's 500 Index Chart Through March 23, 2018

===================================

Labels: , , , , , , , , ,


--> www.FedPrimeRate.com Privacy Policy <--

>  SITEMAP  <

Friday, March 16, 2018

All 3 Major Stock Market Indexes Declined On The Week

Summary of U.S. Markets for the Week Ending March 16, 2018:

===================================

Dow Jones Industrial Average (DJIA) closed @ 24,946.51:

- lost 389.23 points (-1.536%) on the week.
- lost 1,670.20 points (-6.275%) since the January 26, 2018 record-high close (26,616.71.)

---------------------------
S and P 500 Index closed @ 2,752.01:

- lost 34.56 points (-1.24%) on the week.
- lost 120.86 points (-4.207%) since the January 26, 2018 record-high close (2,872.87.)

--------------------------- 

NASDAQ Composite Index closed @ 7,481.99:

- lost 78.82 points (-1.042%) on the week.
- lost 106.33 points (-1.401%) since the March 12, 2018 record-high close (7,588.32.)

===================================

- NYMEX Crude Oil for Future Delivery closed @ $62.34 per barrel

- Comex Gold for April delivery closed @ $1,312.30 per ounce

- In New York, the U.S. dollar buys 0.81367 euros

- In New York, the euro buys 1.229 U.S. dollars

- The United States Prime Rate is 4.50%

- The Target Range for the Fed Funds Rate is 1.25% - 1.50%

- The yield on the 10-Year Treasury Note is currently @ 2.85%


===================================

Standard and Poor's 500 Index Chart Through March 16, 2018

===================================


Labels: , , , , , , , , ,


--> www.FedPrimeRate.com Privacy Policy <--

>  SITEMAP  <

Friday, February 23, 2018

All 3 Major Stock Market Indexes Advanced On The Week

Summary of U.S. Markets for the Week Ending February 23, 2018:

===================================

Dow Jones Industrial Average (DJIA) closed @ 25,309.99:

- gained 347.51 points (+1.392%) on the day.
- gained 90.61 points (+0.359%) on the week.
- lost 1,306.72 points (-4.909%) since the January 26, 2018 record-high close (26,616.71.)

---------------------------
S and P 500 Index: closed @ 2,747.30:

- gained 43.34 points (+1.603%) on the day.
- added 15.08 points (+0.552%) on the week.
- lost 125.57 points (-4.371%) since the January 26, 2018 record-high close (2,872.87.)

--------------------------- 

NASDAQ Composite Index closed @ 7,337.39:

- added 127.31 points (+1.766%) on the day.
- gained 97.92 points (+1.353%) on the week.
- lost 168.38 points (-2.243%) since the January 26, 2018 record-high close (7,505.77.)

===================================

- NYMEX Crude Oil for Future Delivery closed @ $63.55 per barrel

- Comex Gold for April delivery closed @ $1,330.30 per ounce

- In New York, the U.S. dollar buys 0.81321 euros

- In New York, the euro buys 1.2297 U.S. dollars

- The United States Prime Rate is 4.50%

- The Target Range for the Fed Funds Rate is 1.25% - 1.50%

- The yield on the 10-Year Treasury Note is currently @ 2.88%


===================================

Standard and Poor's 500 Index Chart Through February 23, 2018

===================================

Labels: , , , , , , , , ,


--> www.FedPrimeRate.com Privacy Policy <--

>  SITEMAP  <

Friday, February 16, 2018

All 3 Major Stock Market Indices Rose On The Week

Summary of U.S. Markets for the Week Ending February 16, 2018:

===================================

Dow Jones Industrial Average (DJIA) closed @ 25,219.38:

- added 19.01 points (+0.0754%) on the day.
- gained 1,028.48 points (+4.252%) on the week.
- lost 1,397.33 points (-5.25%) since the January 26, 2018 record-high close (26,616.71.)

---------------------------
S and P 500 Index: closed @ 2,732.22:

- gained 1.02 points (+0.0373%) on the day.
- added 112.67 points (+4.301%) on the week.
- lost 140.65 points (-4.896%) since the January 26, 2018 record-high close (2,872.87.)

--------------------------- 

NASDAQ Composite Index closed @ 7,239.47:

- lost 16.96 points (-0.234%) on the day.
- gained 364.98 points (+5.309%) on the week.
- lost 266.30 points (-3.548%) since the January 26, 2018 record-high close (7,505.77.)

===================================

NYMEX Crude Oil for Future Delivery closed @ $61.68 per barrel

Comex Gold for April Delivery closed @ $1,356.20 per ounce

In New York, the U.S. dollar buys 0.80593 euros

In New York, the euro buys 1.2408 U.S. dollars

The United States Prime Rate is 4.50%

The Target Range for the Fed Funds Rate is 1.25% - 1.50%

10-Year Treasury Note Yield is currently @ 2.87%


===================================


Standard and Poor's 500 Index Chart

===================================


Labels: , , , , , , , , ,


--> www.FedPrimeRate.com Privacy Policy <--

>  SITEMAP  <

Friday, February 09, 2018

All 3 Major Stock Market Indices Retreated On The Week

Summary of U.S. Markets for the Week Ending February 9, 2018:

===================================

Dow Jones Industrial Average (DJIA) closed @ 24,190.90:

- added 330.44 points (+1.385%) on the day.

- lost 1,330.06 points (-5.212%) on the week.

- lost 2,425.81 points (-9.114%) since the January 26, 2018 record-high close (26,616.71.)

---------------------------

S and P 500 Index: closed @ 2,619.55:

- added 38.55 points (+1.494%) on the day.

- lost 142.58 points (-5.162%) on the week.

- lost 253.32 points (-8.818%) since the January 26, 2018 record-high close (2,872.87.)

--------------------------- 

NASDAQ Composite Index closed @ 6,874.49:

- gained 97.33 points (+1.436%) on the day.

- lost 366.46 points (-5.061%) on the week.

- lost 631.28 points (-8.411%) since the January 26, 2018 record-high close (7,505.77.)

===================================

NYMEX Crude Oil for Future Delivery closed @ $59.20 per barrel

Comex Gold for April Delivery closed @ $1,315.70 per ounce

In New York, the U.S. dollar buys 0.81626 euros

In New York, the euro buys 1.2251 U.S. dollars

The United States Prime Rate is 4.50%

The Target Range for the Fed Funds Rate is 1.25% - 1.50%

10-Year Treasury Note Yield is currently @ 2.83%


===================================

Dow Jones Industrial Average (DJIA) Chart

===================================

Labels: , , , , , , , , ,


--> www.FedPrimeRate.com Privacy Policy <--

>  SITEMAP  <

Friday, May 15, 2009

All 3 Majors Sank Lower On The Week

All 3 major indexes sank lower on the week.

For the week, the DJIA lost 306.01 points (-3.569%), the NASDAQ Composite Index fell by 58.86 points (-3.385%), and the S and P 500 Index gave up 46.35 points (-4.988%).

Summary of The U.S. Markets for Today:

----------------------------------------------------------

DJIA: Closed @ 8,268.64 (-62.68)

NASDAQ: Closed @ 1,680.14 (-9.07)

S and P 500: Closed @ 882.88 (-10.19)

----------------------------------------------------------

- NYMEX Crude Oil for Future Delivery closed @ $56.34/barrel

- NY Spot Gold closed @ $930.90/ounce

- In New York, The U.S. Dollar buys 0.741 Euros

- In New York, The Euro buys 1.3495 U.S. Dollars

- The United States Prime Rate is 3.25%

- The Target Range for the Fed Funds Rate is 0% - 0.25%

- Ten-Year Treasury Note Yield is currently @ 3.123%

Labels: , , , , , ,


--> www.FedPrimeRate.com Privacy Policy <--

>  SITEMAP  <

Friday, May 08, 2009

The S&P 500 Gained Just Under Six Percent on The Week

Each of the 3 major indexes advanced on the week despite news that the national unemployment rate jumped to 8.9% last month. Yesterday, the Federal Reserve released the results of the Supervisory Capital Assessment Program (SCAP).

For the week, the DJIA added 362.24 points (+4.411%), the NASDAQ Composite Index rose by 19.80 points (+1.152%), and the S and P 500 Index gained 51.71 points (+5.893%).

Summary of The U.S. Markets for Today:

----------------------------------------------------------

DJIA: Closed @ 8,574.65 (+164.80)

NASDAQ: Closed @ 1,739.00 (+22.76)

S and P 500: Closed @ 929.23 (+21.84)

----------------------------------------------------------

NYMEX Crude Oil for Future Delivery closed @ $58.63/barrel

NY Spot Gold closed @ $916.20/ounce

In New York, The U.S. Dollar buys 0.7335 Euros

In New York, The Euro buys 1.3634 U.S. Dollars

The Target Range for the Fed Funds Rate is 0% - 0.25%

Ten-Year Treasury Note Yield is currently @ 3.293%

Labels: , , , , ,


--> www.FedPrimeRate.com Privacy Policy <--

>  SITEMAP  <

Friday, May 01, 2009

All Three Majors Gained More Than 1% On The Week

Each of the 3 major indexes advanced by more than one percent on the week. On Wednesday, the Federal Open Market Committee (FOMC) of the Federal Reserve, with a unanimous vote, opted to keep short-term rates at current levels.

For the week, the DJIA added 136.12 points (+1.685%), the NASDAQ Composite Index rose by 24.91 points (+1.47%), and the S and P 500 Index gained 11.29 points (+1.303%).

Summary of The U.S. Markets for Today:

----------------------------------------------------------

DJIA: Closed @ 8,212.41 (+44.29)

NASDAQ: Closed @ 1,719.20 (+1.90)

S and P 500: Closed @ 877.52 (+4.71)

----------------------------------------------------------

NYMEX Crude Oil for Future Delivery closed @ $53.20/barrel

NY Spot Gold closed @ $885.80/ounce

In New York, The U.S. Dollar buys 0.7535 Euros

In New York, The Euro buys 1.3272 U.S. Dollars

The Target Range for the Fed Funds Rate is 0% - 0.25%

Ten-Year Treasury Note Yield is currently @ 3.174%

Labels: , , , , ,


--> www.FedPrimeRate.com Privacy Policy <--

>  SITEMAP  <

Friday, April 24, 2009

The DJIA and S&P 500 Declined On The Week

The Dow Jones Industrial Average (DJIA) and the S&P 500 both declined on the week, while the NASDAQ Composite advanced.

For the week, the DJIA lost 55.04 points (-0.677%), the NASDAQ Composite Index rose by 21.22 points (+1.268%), and the S and P 500 Index shed 3.37 points (-0.388%).

Summary of The U.S. Markets for Today:

----------------------------------------------------------

DJIA: Closed @ 8,076.29 (+119.23)

NASDAQ: Closed @ 1,694.29 (+42.08)

S and P 500: Closed @ 866.23 (+14.31)

----------------------------------------------------------

NYMEX Crude Oil Future closed @ $51.55/barrel

NY Spot Gold closed @ $913.00/ounce

In New York, The U.S. Dollar buys 0.7551 Euros

In New York, The Euro buys 1.3242 U.S. Dollars

The Target Range for the Fed Funds Rate is 0% - 0.25%

Ten-Year Treasury Note Yield is currently @ 2.996%

Labels: , , , , ,


--> www.FedPrimeRate.com Privacy Policy <--

>  SITEMAP  <

Friday, April 17, 2009

All 3 Majors Rose On The Week

Each of the 3 major indices edged higher on the week.

For the week, the DJIA gained 47.95 points (+0.593%), the NASDAQ Composite Index rose by 20.53 points (+1.242%), and the S and P 500 Index added 13.04 points (+1.522%).

Summary of The U.S. Markets for Today:

----------------------------------------------------------

DJIA: Closed @ 8,131.33 (+5.90)

NASDAQ: Closed @ 1,673.07 (+2.63)

S and P 500: Closed @ 869.60 (+4.30)

----------------------------------------------------------

NYMEX Crude Oil for Future Delivery closed @ $50.33/barrel

NY Spot Gold closed @ $868.70/ounce

In New York, The U.S. Dollar buys 0.7666 Euros

In New York, The Euro buys 1.3044 U.S. Dollars

The Target Range for the Fed Funds Rate is 0% - 0.25%

Ten-Year Treasury Note Yield is currently @ 2.93%

Labels: , , , , ,


--> www.FedPrimeRate.com Privacy Policy <--

>  SITEMAP  <

Friday, April 10, 2009

All 3 Majors Edged Higher On The Four-Day Trading Week

Each of the 3 major indices advanced on the holiday-shortened, 4-day trading week.

For the week, the DJIA added 65.79 points (+0.821%), the NASDAQ Composite Index added 30.67 points (+1.891%), and the S and P 500 Index gained 14.06 points (+1.669%).

Summary of The U.S. Markets for Today:

----------------------------------------------------------

DJIA: Closed @ 8,083.38 (+246.27)

NASDAQ: Closed @ 1,652.54 (+61.88)

S and P 500: Closed @ 856.56 (+31.40)

----------------------------------------------------------

NYMEX Crude Oil for Future Delivery closed @ $52.24/barrel

NY Spot Gold closed @ $879.20/ounce

In New York, The U.S. Dollar buys 0.7583 Euros

In New York, The Euro buys 1.3188 U.S. Dollars

The Target Range for the Fed Funds Rate is 0% - 0.25%

Ten-Year Treasury Note Yield is currently @ 2.926%

Labels: , , , , ,


--> www.FedPrimeRate.com Privacy Policy <--

>  SITEMAP  <

Friday, April 03, 2009

All 3 Majors Gained More Than Three Percent On The Week

Each of the 3 major indices moved higher by more than 3 percent on the week despite news that non-farm payrolls shrank by 663,000 last month, and the unemployment rate climbed to 8.5%.

For the week, the DJIA added 241.41 points (+3.104%), the NASDAQ Composite Index added 76.67 points (+4.962%), and the S and P 500 Index gained 26.56 points (+3.255%).

Summary of The U.S. Markets for Today:

----------------------------------------------------------

DJIA: Closed @ 8,017.59 (+39.51)

NASDAQ: Closed @ 1,621.87 (+19.24)

S and P 500: Closed @ 842.50 (+8.12)

----------------------------------------------------------

NYMEX Crude Oil for Future Delivery closed @ $52.51/barrel

NY Spot Gold closed @ $893.80/ounce

In New York, The U.S. Dollar buys 0.7416 Euros

In New York, The Euro buys 1.3484 U.S. Dollars

The Target Range for the Fed Funds Rate is 0% - 0.25%

Ten-Year Treasury Note Yield is currently @ 2.907%

Labels: , , , , ,


--> www.FedPrimeRate.com Privacy Policy <--

>  SITEMAP  <

Friday, March 27, 2009

All 3 Majors Gained More Than 6% On The Week

Each of the 3 major indices advanced by more than six percent on the week.

For the week, the DJIA added 497.80 points (+6.839%), the NASDAQ Composite Index advanced by 87.93 points (+6.034%), and the S&P 500 Index gained 47.40 points (+6.168%).

Bear Market Update: Since closing with record highs on October 9, 2007, the DJIA is now down 6,388.35 points (45.101%), while the S + P 500 Index is down 749.21 points (47.868%). The record high for the DJIA is 14,164.53; for the S + P 500 Index it's 1,565.15.

For the year, the DJIA is down 1,000.21 points (11.397%), while the S&P 500 is down 87.31 points (9.666%).

Summary of The U.S. Markets for Today:

----------------------------------------------------------

DJIA: Closed @ 7,776.18 (-148.38)

NASDAQ: Closed @ 1,545.20 (-41.80)

S + P 500: Closed @ 815.94 (-16.92)

----------------------------------------------------------

NYMEX Crude Oil Future closed @ $52.38/barrel

NY Spot Gold closed @ $923.10/ounce

In New York, The U.S. Dollar buys 0.7524 Euros

In New York, The Euro buys 1.329 U.S. Dollars

The Target Range for the Fed Funds Rate is 0% - 0.25%

10-Year Treasury Note Yield is currently @ 2.761%

Labels: , , , , ,


--> www.FedPrimeRate.com Privacy Policy <--

>  SITEMAP  <

Friday, March 20, 2009

All 3 Majors Edged Higher On The Week

Each of the 3 major indexes advanced on the week. On Wednesday, the Federal Open Market Committee (FOMC) of the Federal Reserve opted keep short-term rates at current levels, and announced plans to buy up to $300 billion of long-term Treasury securities.

For the week, the DJIA added 54.40 points (+0.753%), the NASDAQ Composite Index advanced by 25.77 points (+1.8%), and the S and P 500 Index gained 11.99 points (+1.585%).


Summary of The U.S. Markets for Today:

----------------------------------------------------------

DJIA: Closed @ 7,278.38 (-122.42)

NASDAQ: Closed @ 1,457.27 (-26.21)

S and P 500: Closed @ 768.54 (-15.50)

----------------------------------------------------------

NYMEX Crude Oil for Future Delivery closed @ $52.07/barrel

NY Spot Gold closed @ $952.60/ounce

In New York, The U.S. Dollar buys 0.7363 Euros

In New York, The Euro buys 1.3582 U.S. Dollars

The Target Range for the Fed Funds Rate is 0% - 0.25%

Ten-Year Treasury Note Yield is currently @ 2.625%

Labels: , , , , ,


--> www.FedPrimeRate.com Privacy Policy <--

>  SITEMAP  <

bing

bing

www.FedPrimeRate.com
Entire Website © 2024 FedPrimeRate.comSM


This website is neither affiliated nor associated with The United States Federal Reserve
in any way. Information in this website is provided for educational purposes only. The owners
of this website make no warranties with respect to any and all content contained within this
website. Consult a financial professional before making important decisions related to any
investment or loan product, including, but not limited to, business loans, personal loans,
education loans, first or second mortgages, credit cards, car loans or any type of insurance.