.comment-link {margin-left:.6em;}

Economy

Economic Data (USA)

Wednesday, April 29, 2020

Gross Domestic Product (GDP): First Estimate for Q1, 2020

Earlier this morning, the Commerce Department's Bureau of Economic Analysis (BEA) released its first estimate for U.S. Real Gross Domestic Product (GDP) for the first quarter of 2020:

Predicted: -5.0%
Actual: -4.8%

The yellow-highlighted percentage represents the first estimate of the quarter-to-quarter change for Real Gross Domestic Product for the entire United States.


============

From Today's Report: Coronavirus (COVID-19) Impact on First-Quarter 2020 GDP

Real GDP decreased 4.8 percent (annual rate) in the first quarter of 2020, following a 2.1 percent increase in the fourth quarter of 2019. The decline in first quarter GDP was, in part, due to the response to the spread of COVID-19, as governments issued “stay-at-home” orders in March. This led to rapid changes in demand, as businesses and schools switched to remote work or canceled operations, and consumers canceled, restricted, or redirected their spending. The full economic effects of the COVID-19 pandemic cannot be quantified in the GDP estimate for the first quarter of 2020

============

The GDP is a very broad measure of economic activity for the entire United States, covering all sectors of the economy. The Commerce Department defines real GDP as, "the output of goods and services produced by labor and property located in the United States."

============

Chart: GDP - Q1 2020 - First Estimate

============


============

Labels: , , , , ,


--> www.FedPrimeRate.com Privacy Policy <--

>  SITEMAP  <

Crude Oil Inventories Report for Week of April 24, 2020

Crude Oil Inventories

The U.S. Crude Oil Inventories report for the week that ended on April 24, 2020 was released this morning:

-- Change from Last Week: +9,000,000 Barrels

-- Change from A Year Ago (Y/Y): +57,100,000 Barrels

-- Current U.S. Crude Oil Stocks: 527,600,000 Barrels

Diminishing crude oil inventories often translate to higher crude oil prices (and vice versa), but not always.

The report is produced by the U.S. Energy Information Administration (EIA).


Labels: , , , , , , ,


--> www.FedPrimeRate.com Privacy Policy <--

>  SITEMAP  <

Tuesday, April 28, 2020

Consumer Confidence Index (CCI) for April 2020

The Consumer Confidence Index® (CCI) for this month (April 2020) was released by The Conference Board® this morning:

================

Predicted: 90.0
  • Actual: 86.9

================

Previous Month (revised): 118.8
 
  • Change from Previous Month: -26.852% (-31.9 points)
================

The "predicted" figure is what economists were expecting, while the "actual" is the true or real figure.

From Today's Report:

"...'Consumer confidence weakened significantly in April, driven by a severe deterioration in current conditions,' said Lynn Franco, Senior Director of Economic Indicators at The Conference Board. 'The 90-point drop in the Present Situation Index, the largest on record, reflects the sharp contraction in economic activity and surge in unemployment claims brought about by the COVID-19 crisis. Consumers’ short-term expectations for the economy and labor market improved, likely prompted by the possibility that stay-at-home restrictions will loosen soon, along with a re-opening of the economy. However, consumers were less optimistic about their financial prospects and this could have repercussions for spending as the recovery takes hold. The uncertainty of the economic effects of COVID-19 will likely cause expectations to fluctuate in the months ahead.'..."

Every month, The Conference Board sends a questionnaire to 5,000 U.S. households. Survey participants are polled about their feelings regarding the U.S. economy, current and future, and about their own fiscal circumstances. On average, 3,500 participants complete and return the 5-question survey.

  • The baseline "100" score for the CCI is associated with 1985 survey data.

When consumers feel good about the economy, they tend to do more spending, and vice versa.

Based in New York City, The Conference Board is a private, not-for-profit organization with a mission to, "create and disseminate knowledge about management and the marketplace to help businesses strengthen their performance and better serve society."

The CCI is usually released on the last Tuesday of the month.

================

================


Labels: , , , , , , , ,


--> www.FedPrimeRate.com Privacy Policy <--

>  SITEMAP  <

Friday, April 24, 2020

Consumer Sentiment: Final Result for April 2020

The University of Michigan's Index of Consumer Sentiment (ICS) - Final Result for April 2020 was released today:

Predicted: 68.0
Actual: 71.8

  • Change from Previous Month: -19.416% (-17.3 points)
  • Change from 12 Months Previous: -26.132% (-25.4 points)

=========

  • Final ICS Reading for March 2020: 89.1

  • Final ICS Reading for April 2019: 97.2

=========

From today's report:

"...April's final Sentiment Index reading remained largely unchanged from the mid-month figure (+0.8 points), and households with below median incomes expressed the same level of confidence as those with above median incomes (71.9). This merging reflects somewhat larger April declines among households with above median incomes (-19.8 points) compared with those with below median incomes (-14.0). The seven-day moving average of the Index of Consumer Sentiment indicated a second larger improvement that was quickly reversed (see the featured chart); its cause could not be linked to any direct judgements about the coronavirus.

The notable divergence between the two main components of the Sentiment Index remained large. The Current Conditions Index fell by 29.4 points in the past month and by 40.5 points in the past two months, whereas the Expectations Index has posted smaller declines of 9.6 points in the past month and 22.0 points from February.

While the decline in both indices indicates an ongoing recession, the gap reflects the anticipated cyclical nature of the coronavirus. In the weeks ahead, as several states reopen their economies, more information will reach consumers about how reopening could cause a resurgence in coronavirus infections. Consumers' reactions to relaxing restrictions will be critical, either putting further pressure on states to reopen their economies, or exerting added pressure to extend the restrictions even if it has negative consequences for economic prospects. The risks associated with these decisions are not equally balanced, with an incorrect decision to reopen having serious repercussions. The necessity to reimpose restrictions could cause a deeper and more lasting pessimism across all consumers, even those in states that did not relax their restrictions..."

=========


The ICS is derived from the following five survey questions:


  1. "We are interested in how people are getting along financially these days. Would you say that you (and your family living there) are better off or worse off financially than you were a year ago?"


  2. "Now looking ahead, do you think that a year from now you (and your family living there) will be better off financially, or worse off, or just about the same as now?"


  3. "Now turning to business conditions in the country as a whole, do you think that during the next twelve months we'll have good times financially, or bad times, or what?"


  4. "Looking ahead, which would you say is more likely: that in the country as a whole we'll have continuous good times during the next five years or so, or that we will have periods of widespread unemployment or depression, or what?"


  5. "About the big things people buy for their homes, such as furniture, a refrigerator, stove, television, and things like that. Generally speaking, do you think now is a good or bad time for people to buy major household items?"

=========


=========

The ICS uses a 1966 baseline, i.e. for 1966, the ICS = 100. So any number that is below the 1966 baseline of 100 means that the folks who were polled recently aren't as optimistic about the U.S. economy as the sample that was polled back in 1966.

The ICS is similar to the Consumer Confidence Index in that they both measure consumer attitudes and offer valuable insight into consumer spending.

=========

The "predicted" figure is what economists were expecting, while the "actual" is the true or real figure.

=========


=========


Labels: , , , , ,


--> www.FedPrimeRate.com Privacy Policy <--

>  SITEMAP  <

Durable Goods Orders During March 2020

The Durable Goods Orders report for March 2020 was released by the Commerce Department this morning:

================

Predicted: -11.7%
  • Actual: $213,184,000,000 (-$35,983,000,000 [-14.441%)

================

  • February 2020 (revised): $249,167,000,000 (+$2,609,000,000 [+1.058%])
 
================


Chart: Durable Goods Orders - March 2020 Update

================

The yellow-highlighted figures represent the dollar amount of new orders for durable or hard goods for immediate or future delivery from U.S. manufacturers, along with both the dollar and month-to-month percentage change.

Examples of durable goods: cars, airplanes, computers, furniture -- items that are built to last at least three years.

================


 ================


Labels: , , , , ,


--> www.FedPrimeRate.com Privacy Policy <--

>  SITEMAP  <

Thursday, April 23, 2020

New Unemployment Insurance Claims for The Week of April 18, 2020

Jobless Claims
Jobless Claims

Earlier today, the Labor Department released its weekly report on New Jobless Insurance Claims for the week that ended on April 18, 2020:

====================

Predicted: 4,250,000

  • Actual: 4,427,000
====================

The yellow-highlighted figure represents the number of first-time claims for unemployment benefits for the entire United States. The "predicted" figure is what economists were expecting, while the "actual" is the true or real figure.

  • Previous Week (revised): 5,237,000
  • 4-Week Moving Average: 5,786,500

====================

From This Morning's Report:

"...The COVID-19 virus continues to impact the number of initial claims and insured unemployment...

...The advance seasonally adjusted insured unemployment rate was 11.0 percent for the week ending April 11, an increase of 2.8 percentage points from the previous week's unrevised rate. This marks the highest level of the seasonally adjusted insured unemployment rate in the history of the seasonally adjusted series. The advance number for seasonally adjusted insured unemployment during the week ending April 11 was 15,976,000, an increase of 4,064,000 from the previous week's revised level. This marks the highest level of seasonally adjusted insured unemployment in the history of the seasonally adjusted series. The previous week's level was revised down by 64,000 from 11,976,000 to 11,912,000. The 4-week moving average was 9,598,250, an increase of 3,548,000 from the previous week's revised average. The previous week's average was revised down by 16,000 from 6,066,250 to 6,050,250..."

====================


====================


Labels: , , , , , , , , ,


--> www.FedPrimeRate.com Privacy Policy <--

>  SITEMAP  <

New Home Sales During March 2020

The March 2020 New Home Sales report was released by the Commerce Department this morning:

Predicted: 643,000
Actual New Home Sales: 627,000

------------------------------------------------------

  • Change from One Month Previous: -114,000 units (-15.385%)

  • Change from One Year Previous: -66,000 units (-9.524%)

------------------------------------------------------

Median Price for a New Home
during March 2020: $321,400

***************************

Average Price for a New Home
during March 2020: $375,300


------------------------------------------------------

Inventory: 333,000 (6.4 months supply at current sales rate; seasonally‐adjusted.)

------------------------------------------------------

================================


================================


Compiled jointly by the U.S. Commerce Department and the U.S. Department of Housing and Urban Development, the yellow-highlighted figure above is the seasonally adjusted and annualized number of newly-built homes with committed buyers for the indicated month.

The "predicted" figure is what economists were expecting, while the "actual" is the true or real figure.

The New Home Sales report is watched by economists and investors because it offers insight into the state of the U.S. housing market, and also provides data that can be used to predict sales of large household furniture and appliances like refrigerators, air conditioners, microwave ovens, etc.


================================

================================

Labels: , , , ,


--> www.FedPrimeRate.com Privacy Policy <--

>  SITEMAP  <

Wednesday, April 22, 2020

Crude Oil Inventories Report for Week of April 17, 2020

Crude Oil Inventories

The U.S. Crude Oil Inventories report for the week that ended on April 17, 2020 was released this morning:

-- Change from Last Week: +15,000,000 Barrels

-- Change from A Year Ago (Y/Y): +58,000,000 Barrels

-- Current U.S. Crude Oil Stocks: 518,600,000 Barrels

Diminishing crude oil inventories often translate to higher crude oil prices (and vice versa), but not always.

The report is produced by the U.S. Energy Information Administration (EIA).


Labels: , , , , , , ,


--> www.FedPrimeRate.com Privacy Policy <--

>  SITEMAP  <

Tuesday, April 21, 2020

Existing Home Sales During March 2020

The Existing Home Sales report for March 2020 was released by The National Association of  Realtors® (NAR®) this morning:

Predicted: 5,335,000
Actual: 5,270,000

  •  Change from Previous Month: -8.507% (-490,000 homes)

  •  Change from One Year Previous: +0.765% (+40,000 homes)
==========

Inventory: 1,500,000 (3.4 months supply)

==========

The yellow-highlighted, "actual" figure above represents the preliminary, seasonally adjusted annualized sales count of existing homes, co-ops and condominiums for the indicated month. The "predicted" figure is what economists were expecting, while the "actual" is the true or real figure.

------------------------------------------------------

Median Price for A Used Home During March 2020: $280,600

Change from One Year Previous: +8.048% (+$20,900)

---------

Average Price for A Used Home During March 2020: $316,000

Change from One Year Previous: +6.218% (+$18,500)


------------------------------------------------------ 

==========


==========

From Today's Report:


"...'Unfortunately, we knew home sales would wane in March due to the coronavirus outbreak,' said Lawrence Yun, NAR’s chief economist. 'More temporary interruptions to home sales should be expected in the next couple of months, though home prices will still likely rise.'

'Earlier in the year, we watched inventory gradually tick upward but with the current quarantine recommendations in place, fewer sellers are listing homes, which will limit buyer choices,' Yun said. 'Significantly more listings are needed and more will come on to the market once the economy steadily reopens.'

'Despite the social distancing restrictions, with many Realtors® conducting virtual open home tours and with
mortgage rates on the decline, a number of first-time buyers were still able to purchase housing last month,' Yun said.


'It is NAR’s top priority to continue to aid and assist Realtors® during these unpredicted, trying times,' said NAR President Vince Malta, broker at Malta & Co., Inc., in San Francisco, Calif. 'We have played an instrumental role on Capitol Hill as Congress secured multiple federal relief packages, and we will continue fighting on behalf of our 1.4 million members, American consumers and the nation’s economy as these conversations persist.'

'We have seen an increase in virtual home tours, e-signings and other innovative and secure methods that comply with social distancing directives,' Malta continued. 'I am confident that Realtors® and brokerages will adapt, evolve and fight, ensuring the real estate industry will be at the forefront of our nation’s upcoming economic recovery.'.
.."

==================


==================


Labels: , , , , , , , , , ,


--> www.FedPrimeRate.com Privacy Policy <--

>  SITEMAP  <

Monday, April 20, 2020

Chicago Fed National Activity Index (CFNAI) for March 2020

The Federal Reserve Bank of Chicago released its National Activity Index (CFNAI) for March 2020:

==================

  • Actual (CFNAI): -4.19

==================

  • Previous Month (revised): +0.06
  • 3-Month Moving Average (CFNAI-MA3): -1.47
==================


The CFNAI is a weighted average of 85 indicators of growth in national economic activity drawn from four broad categories of data:

  • Production and income;
  • Employment, unemployment, and hours;
  • Personal consumption and housing; and
  • Sales, orders, and inventories.

The "predicted" figure is what economists were expecting, while the yellow-highlighted figure is what was reported.

==================

Chart: Chicago Fed National Activity Index with Business Cycles - March 2020 Update
Chart: Chicago Fed National Activity Index with Business Cycles

March 2020 Update

==================

From Today's Report 


"...Index Suggests Economic Growth Decreased Substantially In March

Led by declines in production- and employment-related indicators, the Chicago Fed National Activity Index (CFNAI) fell to –4.19 in March from +0.06 in February. All four broad categories of indicators used to construct the index made negative contributions in March, and three of the four categories decreased from February. The index’s three-month moving average, CFNAI-MA3, decreased to –1.47 in March from –0.20 in February. Following a period of economic expansion, an increasing likelihood of a recession has historically been associated with a CFNAI-MA3 value below –0.70..
."

==================

Understanding The CFNAI:

A zero value for the monthly index has been associated with the national economy expanding at its historical trend (average) rate of growth; negative values with below-average growth (in standard deviation units); and positive values with above-average growth.

Periods of economic expansion have historically been associated with values of the CFNAI-MA3 above -0.70 and the CFNAI Diffusion Index above -0.35. Conversely, periods of economic contraction have historically been associated with values of the CFNAI-MA3 below -0.70 and the CFNAI Diffusion Index below -0.35.

An increasing likelihood of a period of sustained increasing inflation has historically been associated with values of the CFNAI-MA3 above +0.70 more than two years into an economic expansion. Similarly, a substantial likelihood of a period of sustained increasing inflation has historically been associated with values of the CFNAI-MA3 above +1.00 more than two years into an economic expansion.

==================


==================


Labels: , , , , , , , , ,


--> www.FedPrimeRate.com Privacy Policy <--

>  SITEMAP  <

Friday, April 17, 2020

Leading Economic Index for March 2020

The Conference Board® released its Leading Economic Index® (LEI) for March 2020 this morning:

==============

Index for March: 104.2 (The baseline 100 score is associated with 2016 data.)

==============

Predicted: -7.0%
  • Actual: -6.714% (-7.5 points)

==============

  • LEI for February 2020: 111.7
     
  • LEI for January 2020: 111.9

  • LEI for December 2019: 111.4

  • LEI for November 2019: 111.5

  • LEI for October 2019: 111.4

  • LEI for September 2019: 111.6

==============

The yellow-highlighted percentage is the month-to-month change for the index.  The "predicted" figure is what economists were expecting, while the "actual" is the true or real figure.

The LEI is a composite of 10 of the nation's economic data releases that's put together by The Conference Board. Statistically, the components listed below have shown a significant increase or decrease before national economic upturns or downturns:

  1. The Standard + Poor's 500 Index

  2. Average weekly claims for unemployment insurance

  3. Building permits for new private housing

  4. The interest rate spread between the yield on the benchmark 10-Year Treasury Note and Federal Funds

  5. ISM® Index of New Orders

  6. Manufacturer's new orders for consumer goods or materials

  7. Manufacturers' new orders, nondefense capital goods excluding aircraft orders

  8. Average weekly manufacturing hours

  9. Average consumer expectations for business conditions

  10. Leading Credit Index™

==============

Chart: Leading Economic Index - March 2020 Update

==============

 
From Today's Report:

"...Largest Decline in Index’s 60-Year History

The Conference Board Leading Economic Index® (LEI) for the U.S. declined 6.7 percent in March to 104.2 (2016 = 100), following a 0.2 percent decrease in February, and a 0.4 percent increase in January.

'In March, the US LEI registered the largest decline in its 60-year history,' said Ataman Ozyildirim, Senior Director of Economic Research at The Conference Board. 'The unprecedented and sudden deterioration was broad based, with the largest negative contributions coming from initial claims for unemployment insurance and stock prices. The sharp drop in the LEI reflects the sudden halting in business activity as a result of the global pandemic and suggests the US economy will be facing a very deep contraction.'..."

==============


==============

Labels: , , , , , ,


--> www.FedPrimeRate.com Privacy Policy <--

>  SITEMAP  <

Thursday, April 16, 2020

Housing Starts During March 2020

The U.S. Commerce Department this morning released its Housing Starts report for March 2020:

---------------------------------------------------

Housing Starts:
Predicted: 1,350,000
Actual: 1,216,000

Change From Previous Month: -22.251% (-348,000 units)
Change From One Year Previous: +1.418% (+17,000 units)

---------------------------------------------------

Building Permits:
Predicted: 1,300,000
Actual: 1,353,000

Change From Previous Month: -6.818% (-99,000 units)
Change From One Year Previous: +5.047% (+65,000 units)

----------------------------------------------------

Housing Starts: The top, yellow-highlighted figure is a measure of initial construction of single and multi-family residential units in the United States for the indicated month. Seasonally adjusted annual rate. The "predicted" figure is what economists were expecting, while the "actual" is the true or real figure.

If you're wondering about the demand for new homes in the United States, or about the American residential construction industry in general, then you should pay attention to the monthly Housing Starts report. This report also offers insight into specific types of consumer spending: when housing starts are up, demand for the stuff that a consumer would purchase for a new home (large appliances, consumer electronics, furniture, etc.) tends to also rise -- and vice versa.


=================

Chart: Housing Starts - March 2020 Update
=================


================


Labels: , , , , , , ,


--> www.FedPrimeRate.com Privacy Policy <--

>  SITEMAP  <

New Unemployment Insurance Claims for The Week of April 11, 2020

Jobless Claims
Jobless Claims

Earlier today, the Labor Department released its weekly report on New Jobless Insurance Claims for the week that ended on April 11, 2020:

====================

Predicted: 6,000,000

  • Actual: 5,245,000
====================

The yellow-highlighted figure represents the number of first-time claims for unemployment benefits for the entire United States. The "predicted" figure is what economists were expecting, while the "actual" is the true or real figure.

  • Previous Week (revised): 6,615,000
  • 4-Week Moving Average: 5,508,000

====================

From This Morning's Report:

"...COVID-19 Impact: The COVID-19 virus continues to impact the number of initial claims and insured unemployment...

...The advance seasonally adjusted insured unemployment rate was 8.2 percent for the week ending April 4, an increase of 3.1 percentage points from the previous week's unrevised rate. This marks the highest level of the seasonally adjusted insured unemployment rate in the history of the seasonally adjusted series. The previous high was 7.0 percent in May of 1975.
.."

====================


====================

Labels: , , , , , , , , ,


--> www.FedPrimeRate.com Privacy Policy <--

>  SITEMAP  <

Wednesday, April 15, 2020

Industrial Production + Manufacturing + Capacity Utilization During March 2020

The Industrial Production, Manufacturing and Capacity Utilization numbers for March 2020 were released by the Federal Reserve this morning:

Industrial Production:
Predicted: -4.2%
Actual: -5.4%

Manufacturing:
Predicted: -4.0%
Actual: -6.3%

The yellow-highlighted percentages represent the month-to-month change in manufacturing, and physical output from mining operations, utility plants and factories for the entire United States.

Capacity Utilization Rate:
Predicted: 74.0%
Actual: 72.7

The Capacity Utilization Rate represents the use of available resources at mining operations, utility plants and factories for the entire United States last month.

The "predicted" figures are what economists were expecting, while the "actual" is the true or real figure.

From today's report:

"...Total industrial production fell 5.4 percent in March, as the COVID-19 (coronavirus disease 2019) pandemic led many factories to suspend operations late in the month. Manufacturing output fell 6.3 percent; most major industries posted decreases, with the largest decline registered by motor vehicles and parts. The decreases for total industrial production and for manufacturing were their largest since January 1946 and February 1946, respectively. The indexes for utilities and mining declined 3.9 percent and 2.0 percent, respectively. At 103.7 percent of its 2012 average, the level of total industrial production in March was 5.5 percent lower than a year earlier. Capacity utilization for the industrial sector decreased 4.3 percentage points to 72.7 percent in March, a rate that is 7.1 percentage points below its long-run (1972–2019) average.

The estimates in this release incorporated data on stay-at-home orders as well as other information on industrial activity for late in the month. An explanation of the methods used to construct the estimates is available on the Federal Reserve Board's website at www.federalreserve.gov/releases/g17/g17_technical_qa.htm#covid2020.
.."

===============


===============


Labels: , , , , , ,


--> www.FedPrimeRate.com Privacy Policy <--

>  SITEMAP  <

Crude Oil Inventories Report for Week of April 10, 2020

Crude Oil Inventories

The U.S. Crude Oil Inventories report for the week that ended on April 10, 2020 was released this morning:

-- Change from Last Week: +19,200,000 Barrels

-- Change from A Year Ago (Y/Y): +48,500,000 Barrels

-- Current U.S. Crude Oil Stocks: 503,600,000 Barrels

Diminishing crude oil inventories often translate to higher crude oil prices (and vice versa), but not always.

The report is produced by the U.S. Energy Information Administration (EIA).


Labels: , , , , , , ,


--> www.FedPrimeRate.com Privacy Policy <--

>  SITEMAP  <

U.S. Retail And Food Services Sales Report for March 2020

The Commerce Department this morning released advance estimates of U.S. Retail and Food Services Sales for March 2020:

Predicted: -7.3%
Actual: -8.728% (-$46,196,000,000)

The yellow-highlighted percentage represents the month-to-month change in total sales receipts for retailers that sell durable and non-durable goods, and retailers that provide food and beverage services.

=================

  • Estimated Retail Sales During March 2020: $483,066,000,000
  • Change From 12 Months Previous: -6.167% (-$31,747,000,000)

=================

Chart: Retail Sales - March 2020 Update
=================


=================


Labels: , , , , ,


--> www.FedPrimeRate.com Privacy Policy <--

>  SITEMAP  <

Tuesday, April 14, 2020

Import and Export Price Indexes for March 2020

The Labor Department's Bureau of Labor Statistics this morning released its report on U.S. Import and Export Price Indexes for March 2020:

===============

Import Prices
Predicted: -3.1%
Actual: -2.3%

Change From 12 Months Previous: -4.1%

===============

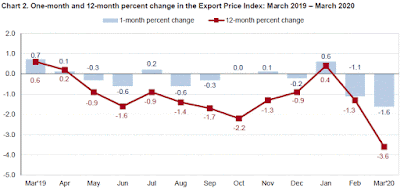
Export Prices
Predicted: -2.0%
Actual: -1.6%

Change From 12 Months Previous: -3.6%

===============
 
The above percentages, highlighted in yellow, represent the month-to-month change in prices for:

  • Imports: the cost of goods produced in other countries and sold in the United States.
  • Exports: the cost of goods produced in the USA and sold in other countries.

Together, these indexes offer insight into the status of inflation in the United States, and for the global economy as well. The "predicted" figure is what economists were expecting, while the "actual" is the true or real figure.


===============

Chart: Import Price Index - March 2020 Update


===============


Chart: Export Price Index - March 2020 Update

===============


===============


Labels: , , , ,


--> www.FedPrimeRate.com Privacy Policy <--

>  SITEMAP  <

Friday, April 10, 2020

Consumer Price Index (CPI) for March 2020

Earlier this morning, the Labor Department's Bureau of Labor Statistics released the Consumer Price Index (CPI) for March 2020:

=========================================

Predicted: -0.3%
Actual: -0.4%

  • Change From 12 Months Previous: +1.5%

=========================================

Below is the CPI when food and energy are removed, also known as core CPI:

Predicted: +0.1%
Actual: -0.1%

  • Change From 12 Months Previous: +2.1%

=========================================

The above, yellow-highlighted figures represent the seasonally adjusted, month-to-month change in prices for a specific group of goods and services that consumers buy, and is, therefore, a very important part of the overall inflation picture for the country.

The "predicted" figure is what economists were expecting, while the "actual" is the true or real figure.

General categories that constitute the CPI are:

  • Healthcare
  • Housing
  • Clothing
  • Communications
  • Education
  • Transportation
  • Food and Beverages
  • Recreation
  • Miscellaneous Goods and Services (grooming expenses, etc.)

=========================================

From Today's Report:

"...The Consumer Price Index for All Urban Consumers (CPI-U) declined 0.4 percent in March on a seasonally adjusted basis, the largest monthly decline since January 2015, the U.S. Bureau of Labor Statistics reported today. Over the last 12 months, the all items index increased 1.5 percent before seasonal adjustment.

A sharp decline in the gasoline index was a major cause of the monthly decrease in the seasonally adjusted all items index, with decreases in the indexes for airline fares, lodging away from home, and apparel also contributing. The energy index fell 5.8 percent as the gasoline index decreased 10.5 percent. The food index rose in March, increasing 0.3 percent as the food at home index rose 0.5 percent.

The index for all items less food and energy fell 0.1 percent in March, its first monthly decline since January 2010. Along with the indexes for airline fares, lodging away from home, and apparel, the index for new vehicles declined in March. The index for shelter was unchanged, with increases in the indexes for rent and for owners’ equivalent rent offsetting the aforementioned decline in the index for lodging away from home. Indexes that increased in March include medical care, used cars and trucks, motor vehicle insurance, and education. 

The all items index increased 1.5 percent for the 12 months ending March, a notably smaller increase than the 2.3-percent increase for the period ending February. The index for all items less food and energy rose 2.1 percent over the last 12 months. The food index rose 1.9 percent over the last 12 months, while the energy index declined 5.7 percent..."

 
=========================================

Chart: Consumer Price Index (CPI) - March 2020 Update

========================================= 


=========================================


Labels: , , , , ,


--> www.FedPrimeRate.com Privacy Policy <--

>  SITEMAP  <

Thursday, April 09, 2020

New Unemployment Insurance Claims for The Week of April 4, 2020

Jobless Claims
Jobless Claims

Earlier today, the Labor Department released its weekly report on New Jobless Insurance Claims for the week that ended on April 4, 2020:

====================

Predicted: 3,350,000

  • Actual: 6,606,000
====================

The yellow-highlighted figure represents the number of first-time claims for unemployment benefits for the entire United States. The "predicted" figure is what economists were expecting, while the "actual" is the true or real figure.

  • Previous Week (revised): 6,867,000
  • 4-Week Moving Average: 4,265,500

====================

From This Morning's Report:

"...The COVID-19 virus continues to impact the number of initial claims and its impact is also reflected in the increasing levels of insured unemployment..."

====================


====================


Labels: , , , , , , , ,


--> www.FedPrimeRate.com Privacy Policy <--

>  SITEMAP  <

Producer Price Index - Final Demand (PPI-FD) for March 2020

The Producer Price Index - Final Demand (PPI-FD) for March 2020 was released this morning:

Predicted: -0.3%
Actual: -0.2%

Change from 12 months previous:  +0.7%

=============

Below is the PPI-FD when food, energy and trade services are removed:

Predicted: -0.1%
Actual: -0.2%

Change from 12 months previous:  +1.0%

=============

The above, yellow-highlighted percentages represent the month-to-month change in prices received by domestic producers of goods and services, for goods, services and construction in the United States, for final demand.

Final Demand = personal consumption (consumers), exports, government purchases and capital investment.

The PPI-FD is released by the Labor Department's Bureau of Labor Statistics.

The "predicted" figure is what economists were expecting, while the "actual" is the true or real figure.


==============


==============

Labels: , , , , , ,


--> www.FedPrimeRate.com Privacy Policy <--

>  SITEMAP  <

Wednesday, April 08, 2020

NFIB Small Business Optimism Index for March 2020

The National Federation of Independent Business® (NFIB®) released its Small Business Optimism Index (SBOI) for March 2020:

=========

Predicted: 95.0
Actual: 96.4

=========

  • Change from Previous Month: -7.751% (-8.1 points)
  • Change from 12 Months Previous: -5.305% (-5.4 points)

=========

  • The February 2020 SBOI reading was 104.5

  • The March 2019 SBOI reading was 101.8

=========

Chart: NFIB Small Business Optimism Index - March 2020 Update
Chart: NFIB Small Business Optimism Index
March 2020 Update

=========

From Today's Report:


"...Abrupt Turn in Small Business Optimism Ends 39-Month Historic Run

The NFIB Small Business Optimism Index fell 8.1 points in March to 96.4, the largest monthly decline in the survey’s history. Nine of the 10 Index components declined, which is evidence that economic disruptions are escalating on Main Street as small businesses struggle to keep their doors open. The small business sector is anticipating and bracing for continued economic disruptions going forward.

'Small businesses are living through the coronavirus pandemic right now and it’s hard to say what the severity of the disruption will be, but we do know they’re feeling the urgency,' said NFIB Chief Economist William Dunkelberg. 'It is vital that these businesses have access to federal funds that are made available through the CARES Act to keep the doors open on Main Street.'

The financial markets saw substantial change in March, with the stock market indices losing 22% of their value and jobless claims rising to a record 10 million in the last two weeks of the month. The NFIB survey collected the majority of responses in the first half of the month, so the sharp decline in employment is not reflected in the March survey data.

The Main Takeaways from the March Survey Include:
  • The NFIB Uncertainty Index rose 12 points in March to 92, the highest level since March 2017.

  • Reports of better business conditions in the next six months declined 17 points to a net 5%, which is the largest monthly decline since November 2012.
  • Real sales expectations in the next six months declined 31 points to a net negative 12%, the largest monthly decline in the survey’s history.

  • Thirteen percent of firms thought it was a good time to expand, a decline of 13 points from last month.
     
  • Job openings fell three points to 35%.
   
As reported in NFIB’s monthly jobs report, prior to the COVID-19 outbreak, the small business labor market reported strong hiring, elevated levels of open positions, and historically high employee compensation. However, hiring plans experienced a significant drop from February yet finding qualified workers remains the top issue for 24% of small employers who reported this as their No. 1 problem.

Down two points from February, 60% of owners reported capital outlays. Of those making expenditures, 43% reported spending on new equipment, 26% acquired vehicles, 16% improved or expanded facilities, 6% acquired new buildings or land for expansion, and 12% spend money for new fixtures and furniture. Twenty-one percent of owners are planning capital outlays in the next few months, a sign that small business owners are scaling back spending as economic conditions started to disrupt the nation.

Sales held strong in March, with a seasonally adjusted net 8% of all owners reporting higher nominal sales in the past three months. As actual sales volumes remained strong, expectations of the future of sales growth deteriorated significantly. It is clear owners felt the pending economic shift as state officials began to shut down non-essential businesses and issue stay-at-home orders in response to coronavirus.

A net negative three percent of owners are planning to expand inventory holdings. Small business owners are bracing themselves for a significant reduction in consumer spending and future orders.

The frequency of reports of positive profit trends fell two points to a net negative 6% reporting quarter-on-quarter profits. Among the owners reporting weaker profits, 32% blamed weaker sales, 26% blamed usual seasonal change, 9% cited price changes, 7% cited labor costs, and 7% cited material costs. For those reporting higher profits, 53% credited sales volumes and 22% credited usual seasonal change.

NFIB released surveys in March on how COVID-19 is impacting small businesses. The latest survey showed 92% of small employers are negatively impacted by the outbreak and about half of small employers said they can survive for no more than two months under the current business conditions..."


 =========

  • Small business survey questions can be found at the end of today's report.
  • The baseline "100" score is associated with 1986 survey data.
=========


=========


Labels: , , , , , , , , ,


--> www.FedPrimeRate.com Privacy Policy <--

>  SITEMAP  <

Crude Oil Inventories Report for Week of April 3, 2020

Crude Oil Inventories

The U.S. Crude Oil Inventories report for the week that ended on April 3, 2020 was released this morning:

-- Change from Last Week: +15,200,000 Barrels

-- Change from A Year Ago (Y/Y): +27,800,000 Barrels

-- Current U.S. Crude Oil Stocks: 484,400,000 Barrels

Diminishing crude oil inventories often translate to higher crude oil prices (and vice versa), but not always.

The report is produced by the U.S. Energy Information Administration (EIA).


Labels: , , , ,


--> www.FedPrimeRate.com Privacy Policy <--

>  SITEMAP  <

Friday, April 03, 2020

Employment Situation Report for March 2020

The Employment Situation Report for March 2020 was released by The Department of Labor's Bureau of Labor Statistics this morning:

Nonfarm Payrolls (month-to-month change)
Predicted: -150,000
Actual: -701,000


U-3 Unemployment Rate (Headline)
Actual: 4.4%
Previous Month: 3.5%
12 Months Previous: 3.8%

U-6 Unemployment Rate*
Actual: 8.7%
Previous Month: 7.0%
12 Months Previous: 7.4%

Average Hourly Earnings (month-to-month change)
Predicted: +0.2%
Actual: +0.386% (+$0.11)

Average Hourly Earnings (year-on-year change)
Predicted: +3.0%
Actual: +3.098% (+$0.86)

Average Weekly Earnings (month-to-month change)
Actual: -0.198% (-$1.94)


Average Weekly Earnings (year-on-year change)
Actual: +2.201% (+$21.08)

Civilian Labor Force Participation Rate: 62.7%
Previous Month: 63.4%
12 Months Previous: 63.0%

Average Workweek
Predicted: 34.1 hours
Actual: 34.2 hours

Economist, academics, central bankers and investors pay very close attention to the monthly Employment Situation report as it offers penetrating insight as to the current and near-future state of the overall U.S. economy. If a) Americans are earning more money and b) the economy is creating new jobs, this typically translates to more money being pumped into the economy (and vice versa.)

The "predicted" figure is what economists were expecting, while the "actual" is the true or real figure.

From today's report:

"...
In March, average hourly earnings for all employees on private nonfarm payrolls increased by 11 cents to $28.62 [+0.386%]. Over the past 12 months, average hourly earnings have increased by [+3.098%.]   Average hourly earnings of private-sector production and nonsupervisory employees increased by 10 cents to $24.07 [+0.417%] in March.

The change in total nonfarm payroll employment for January was revised down by 59,000 from +273,000 to +214,000, and the change for February was revised up by 2,000 from +273,000 to +275,000. With these revisions, employment gains in January and February combined were 57,000 lower than previously reported. (Monthly revisions result from additional reports received from businesses and government agencies since the last published estimates and from the recalculation of seasonal factors.) After revisions, job gains averaged
245,000 per month for January and February..." [Establishment Survey Data]
======

 * =  The U-6 Unemployment Rate is defined as:

"Total unemployed, plus all persons marginally attached to the labor force, plus total employed part time for economic reasons, as a percent of the civilian labor force plus all persons marginally attached to the labor force."


===================


 ===================


Labels: , , , , , , , , ,


--> www.FedPrimeRate.com Privacy Policy <--

>  SITEMAP  <

bing

bing

www.FedPrimeRate.com
Entire Website © 2024 FedPrimeRate.comSM


This website is neither affiliated nor associated with The United States Federal Reserve
in any way. Information in this website is provided for educational purposes only. The owners
of this website make no warranties with respect to any and all content contained within this
website. Consult a financial professional before making important decisions related to any
investment or loan product, including, but not limited to, business loans, personal loans,
education loans, first or second mortgages, credit cards, car loans or any type of insurance.