.comment-link {margin-left:.6em;}

Economy

Economic Data (USA)

Saturday, May 18, 2024

Import and Export Price Indexes for April 2024

The Labor Department's Bureau of Labor Statistics this morning released its report on U.S. Import and Export Price Indexes for April 2024:

===============

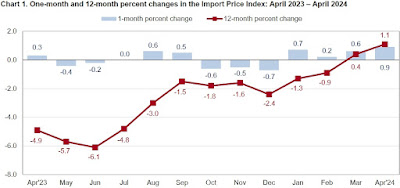
Import Prices
Previous Reading: +0.6% (revised)
Actual: +0.9%

Change From 12 Months Previous: +1.1%

===============

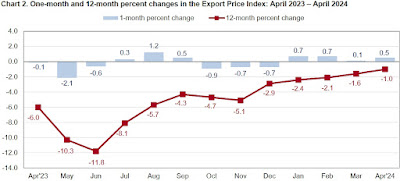
Export Prices
Previous Reading: +0.1% (revised)
Actual: +0.5%

Change From 12 Months Previous: -1.0%

===============
 
The above percentages, highlighted in yellow, represent the month-to-month change in prices for:

  • Imports: the cost of goods produced in other countries and sold in the United States.
  • Exports: the cost of goods produced in the USA and sold in other countries.


Together, these indexes offer insight into the status of inflation in the United States, and for the global economy as well. The "predicted" figure is what economists were expecting, while the "actual" is the true or real figure.

=================


CHART: Import Price Index - April 2024 Update

CHART: Import Price Index
April 2024 Update

================= 

CHART: Export Price Index - April 2024 Update

CHART: Export Price Index
April 2024 Update

===
============


===============


Labels: , , , , , , , , , ,


--> www.FedPrimeRate.com Privacy Policy <--

>  SITEMAP  <

Thursday, May 16, 2024

Consumer Price Index (CPI) for April 2024

Earlier this morning, the Labor Department's Bureau of Labor Statistics released the Consumer Price Index (CPI) for April 2024:


=========================================

CPI During April 2024: 313.548

=========================================

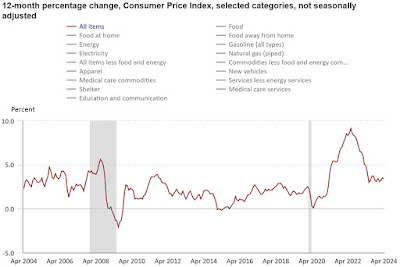
Consumer Price Index, Headline

Predicted: +0.5%

->  Actual: +0.39% (+1.216 points) M/M

 > Year-on-Year Change: +3.36% (+10.185 points)


=========================================

Consumer Price Index, Minus Food + Energy (Core CPI)

Predicted: +0.5%

 - > Actual: +0.28% (+0.89 point) M/M

Year-on-Year Change: +3.61% (+11.079 points)


=========================================

The above, yellow-highlighted figures represent month-to-month change (not seasonally adjusted) in prices for a specific group of goods and services that consumers buy, and is, therefore, a very important part of the overall inflation picture for the country.

The "predicted" figure is what economists were expecting, while the "actual" is the true or real figure.

General categories that constitute the CPI are:

  • Healthcare
  • Housing
  • Clothing
  • Communications
  • Education
  • Transportation
  • Food and Beverages
  • Recreation
  • Miscellaneous Goods and Services (grooming expenses, etc.)

========================================

CPI During April 2023: 303.363

========================================

CHART: Consumer Price Index 12-Month Percentage Change - APRIL 2024 Update
 CHART: Consumer Price Index
12-Month Percentage Change
APRIL 2024 Update

========================================

=========================================


Labels: , , , , , , , , , ,


--> www.FedPrimeRate.com Privacy Policy <--

>  SITEMAP  <

Wednesday, May 15, 2024

Producer Price Index - Final Demand (PPI-FD) for April 2024

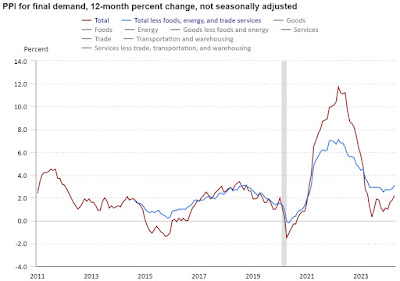
The Producer Price Index - Final Demand (PPI-FD) for April 2024 was released this morning:

Previous Month (unrevised): +0.2%
  • > Actual: +0.5%

Change from 12 months previous:  +2.2%  (prior = +2.1%)

=============

Below is the PPI-FD when food, energy and trade services are removed:

Previous Month (unrevised): +0.2%
  • > Actual: +0.4%
Change from 12 months previous:  +3.1%  (prior = +2.8%)

=============

The above, yellow-highlighted percentages represent the month-to-month change in prices received by domestic producers of goods and services, for goods, services and construction in the United States, for final demand.

Final Demand = personal consumption (consumers), exports, government purchases and capital investment.

The PPI-FD is released by the Labor Department's Bureau of Labor Statistics.

The "predicted" figure is what economists were expecting, while the "actual" is the true or real figure.


 ==============

CHART: Producer Price Index   Final Demand (PPI-FD) 12-Month Percent Change - APRIL 2024 Update
CHART: Producer Price Index
  Final Demand (PPI-FD)
12-Month Percent Change
APRIL 2024 Update
==============

Labels: , , , , , , , , ,


--> www.FedPrimeRate.com Privacy Policy <--

>  SITEMAP  <

Friday, May 10, 2024

Crude Oil Inventories Report for Week of May 3, 2024

Crude Oil Inventories


The U.S. Crude Oil Inventories report for the week that ended on May 3, 2024 was released this morning:

-- Change from Last Week: -1,400,000 Barrels

-- Change from A Year Ago (Y/Y): -3,100,000 Barrels

-- Current U.S. Crude Oil Stocks: 459,500,000 Barrels

Diminishing crude oil inventories often translate to higher crude oil and fuel prices (and vice versa), but not always.

The report is produced by the U.S. Energy Information Administration (EIA).

Labels: , , , , , , , ,


--> www.FedPrimeRate.com Privacy Policy <--

>  SITEMAP  <

New Unemployment Insurance Claims for The Week of May 4, 2024

Jobless Claims
Jobless Claims


Earlier today, the Labor Department released its weekly report on New Jobless Insurance Claims for the week that ended on May 4, 2024:

====================

Predicted: 220,000

  • Actual: 231,000
====================

The yellow-highlighted figure represents the number of first-time claims for unemployment benefits for the entire United States. The "predicted" figure is what economists were expecting, while the "actual" is the true or real figure.

  • Previous Week (revised): 209,000
  • 4-Week Moving Average: 215,000

====================

Labels: , , , , , , , , , , , ,


--> www.FedPrimeRate.com Privacy Policy <--

>  SITEMAP  <

Friday, May 03, 2024

Employment Situation Report for April 2024

Employment Situation Report for April 2024 was released by The Department of Labor's Bureau of Labor Statistics this morning:

Nonfarm Payrolls (month-to-month change)
Actual: +175,000
Previous Month (Revised): 315,000
One Year Previous: 278,000

U-3 Unemployment Rate (Headline)
Actual: 3.9%
Previous Month: 3.8%
12 Months Previous: 3.4%

U-6 Unemployment Rate*
Actual: 7.4%
Previous Month: 7.3%
12 Months Previous: 6.6%

Average Hourly Earnings (month-to-month change)
Predicted: +0.4%
Actual: +0.202% (+$0.07)

Average Hourly Earnings (year-on-year change)
Predicted: +4.1%
Actual: +3.92% (+$1.31)

Average Weekly Earnings (month-to-month change)
Actual: -0.09% (-$1.06)


Average Weekly Earnings (year-on-year change)
Actual: +3.92% (+$44.94)

Civilian Labor Force Participation Rate: 62.7%
Previous Month: 62.7%
12 Months Previous: 62.6%

Average Workweek: 34.3 hours
Previous Month: 34.4 hours
One Year Previous: 34.3 hours

Economist, academics, central bankers and investors pay very close attention to the monthly Employment Situation report as it offers penetrating insight as to the current and near-future state of the overall U.S. economy. If a) Americans are earning more money and b) the economy is creating new jobs, this typically translates to more money being pumped into the economy (and vice versa.)

The "predicted" figure is what economists were expecting, while the "actual" is the true or real figure.

===================
 

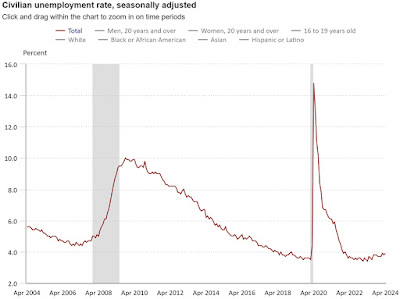
CHART: Civilian Unemployment Rate April 2004 THRU April 2024

CHART: Civilian Unemployment Rate
April 2004 THRU April 2024

   ===================

 * =  The U-6 Unemployment Rate is defined as:

"Total unemployed, plus all persons marginally attached to the labor force, plus total employed part time for economic reasons, as a percent of the civilian labor force plus all persons marginally attached to the labor force."

===================


===================

Labels: , , , , , , , , , , , , , , , , , , ,


--> www.FedPrimeRate.com Privacy Policy <--

>  SITEMAP  <

Wednesday, May 01, 2024

Job Openings and Labor Turnover Survey (JOLTS) for March 2024

Job Openings and Labor Turnover Survey (JOLTS*) for March 2024 was released by the Labor Department this morning:

=============

Job Openings

Predicted: 8,500,000
  • Actual:   8,488,000
-------------------------
  • Previous Month (revised): 8,813,000

  • One Year Previous: 9,623,000

  • Change from one year previous: -11.79% (-1,135,000)


=============

HIRES: 5,500,000

HIRES vs. 12 Months Previous: -7.64% (-455,000)

-----------

QUITS: 3,329,000

QUITS vs. 12 Months Previous: -12.6% (-480,000)


-----------

LAYOFFS + DISCHARGES: 1,526,000 

LAYOFFS + DISCHARGES vs. 12 Months Previous: -16.38% (-299,000)

-----------

TOTAL SEPARATIONS §: 5,200,000

TOTAL SEPARATIONS vs. 12 Months Previous: -12.12% (-717,000)

=============
 

§ = Here's How The Labor Department Defines Total Separations:


"Total separations includes quits, layoffs and discharges, and other separations. Total separations is referred to as turnover. Quits are generally voluntary separations initiated by the employee. Therefore, the quits rate can serve as a measure of workers’ willingness or ability to leave jobs. Layoffs and discharges are involuntary separations initiated by the employer. Other separations includes separations due to retirement, death, disability, and transfers to other locations of the same firm."

=============


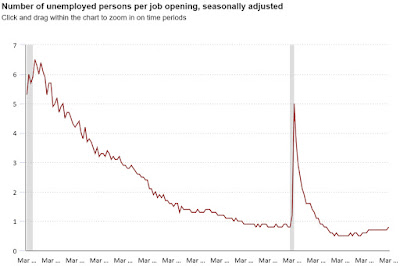
CHART: Number of Jobless People per Job Opening - MARCH 2024 UPDATE
CHART: Number of Jobless People
per Job Opening
MARCH 2024 UPDATE

=============

============= 

Labels: , , , , , , , , , , , , ,


--> www.FedPrimeRate.com Privacy Policy <--

>  SITEMAP  <

bing

bing

www.FedPrimeRate.com
Entire Website © 2024 FedPrimeRate.comSM


This website is neither affiliated nor associated with The United States Federal Reserve
in any way. Information in this website is provided for educational purposes only. The owners
of this website make no warranties with respect to any and all content contained within this
website. Consult a financial professional before making important decisions related to any
investment or loan product, including, but not limited to, business loans, personal loans,
education loans, first or second mortgages, credit cards, car loans or any type of insurance.