.comment-link {margin-left:.6em;}

Economy

Economic Data (USA)

Thursday, September 30, 2021

New Unemployment Insurance Claims for The Week of September 25, 2021

Jobless Claims
Jobless Claims

Earlier today, the Labor Department released its weekly report on New Jobless Insurance Claims for the week that ended on September 25, 2021:

====================

Predicted: 360,000

  • Actual: 362,000
====================

The yellow-highlighted figure represents the number of first-time claims for unemployment benefits for the entire United States. The "predicted" figure is what economists were expecting, while the "actual" is the true or real figure.

  • Previous Week (unrevised): 351,000
  • 4-Week Moving Average: 340,000

====================


====================


Labels: , , , , , , , , , , ,


--> www.FedPrimeRate.com Privacy Policy <--

>  SITEMAP  <

Wednesday, September 29, 2021

Crude Oil Inventories Report for Week of September 24, 2021

Crude Oil Inventories

The U.S. Crude Oil Inventories report for the week that ended on September 24, 2021 was released this morning:

-- Change from Last Week: +4,600,000 Barrels

-- Change from A Year Ago (Y/Y): -73,900,000 Barrels

-- Current U.S. Crude Oil Stocks: 418,500,000 Barrels

Diminishing crude oil inventories often translate to higher crude oil prices (and vice versa), but not always.

The report is produced by the U.S. Energy Information Administration (EIA).


Labels: , , , , , , , , , ,


--> www.FedPrimeRate.com Privacy Policy <--

>  SITEMAP  <

Tuesday, September 28, 2021

Consumer Confidence Index (CCI) for September 2021

The Consumer Confidence Index® (CCI) for this month (September 2021) was released by The Conference Board® this morning:

================

Predicted: 110.0
  • Actual: 109.3

================

Previous Month (revised): 115.2

  • Change from Previous Month: -5.122% (-5.9 points)
================

The "predicted" figure is what economists were expecting, while the "actual" is the true or real figure.

From Today's Report:

"...'Consumer confidence dropped in September as the spread of the Delta variant continued to dampen optimism,' said Lynn Franco, Senior Director of Economic Indicators at The Conference Board. 'Concerns about the state of the economy and short-term growth prospects deepened, while spending intentions for homes, autos, and major appliances all retreated again. Short-term inflation concerns eased somewhat, but remain elevated. Consumer confidence is still high by historical levels -- enough to support further growth in the near-term -- but the Index has now fallen 19.6 points from the recent peak of 128.9 reached in June. These back-to-back declines suggest consumers have grown more cautious and are likely to curtail spending going forward.'..."

Every month, The Conference Board sends a questionnaire to 5,000 U.S. households. Survey participants are polled about their feelings regarding the U.S. economy, current and future, and about their own fiscal circumstances. On average, 3,500 participants complete and return the 5-question survey.

  • The baseline "100" score for the CCI is associated with 1985 survey data.

When consumers feel good about the economy, they tend to do more spending, and vice versa.

Based in New York City, The Conference Board is a private, not-for-profit organization with a mission to, "create and disseminate knowledge about management and the marketplace to help businesses strengthen their performance and better serve society."

The CCI is usually released on the last Tuesday of the month.

================

================


Labels: , , , , , , , , ,


--> www.FedPrimeRate.com Privacy Policy <--

>  SITEMAP  <

Thursday, September 23, 2021

New Unemployment Insurance Claims for The Week of September 18, 2021

Jobless Claims
Jobless Claims

Earlier today, the Labor Department released its weekly report on New Jobless Insurance Claims for the week that ended on September 18, 2021:

====================

Predicted: 350,000

  • Actual: 351,000
====================

The yellow-highlighted figure represents the number of first-time claims for unemployment benefits for the entire United States. The "predicted" figure is what economists were expecting, while the "actual" is the true or real figure.

  • Previous Week (revised): 335,000
  • 4-Week Moving Average: 335,750

====================


====================


Labels: , , , , , , , , , , ,


--> www.FedPrimeRate.com Privacy Policy <--

>  SITEMAP  <

Leading Economic Index for August 2021

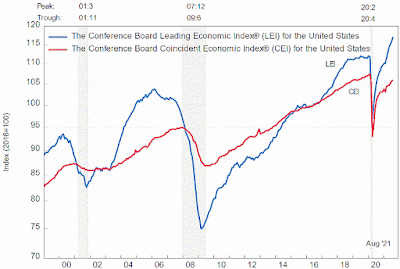
The Conference Board® released its Leading Economic Index® (LEI) for August 2021 this morning:

==============

Index for August 2021: 117.1 (The baseline 100 score is associated with 2016 data.)

==============

Predicted: +0.7%
  • Actual: +0.948% (+1.1 points)

==============

  • LEI for July 2021: 116.0

  • LEI for June 2021: 115.1

  • LEI for May 2021: 114.4

  • LEI for April 2021: 113.0

  • LEI for March 2021: 111.5

  • LEI for February 2021: 110.1
     
  • LEI for January 2021: 110.1

  • LEI for December 2020: 109.6

==============

The yellow-highlighted percentage is the month-to-month change for the index.  The "predicted" figure is what economists were expecting, while the "actual" is the true or real figure.

The LEI is a composite of 10 of the nation's economic data releases that's put together by The Conference Board. Statistically, the components listed below have shown a significant increase or decrease before national economic upturns or downturns:

  1. The Standard + Poor's 500 Index

  2. Average weekly claims for unemployment insurance

  3. Building permits for new private housing

  4. The interest rate spread between the yield on the benchmark 10-Year Treasury Note and Federal Funds

  5. ISM® Index of New Orders

  6. Manufacturer's new orders for consumer goods or materials

  7. Manufacturers' new orders, nondefense capital goods excluding aircraft orders

  8. Average weekly manufacturing hours

  9. Average consumer expectations for business conditions

  10. Leading Credit Index™

==============


Chart: Leading Economic Index - August 2021 Update

Chart: Leading Economic Index
August 2021 Update

==============


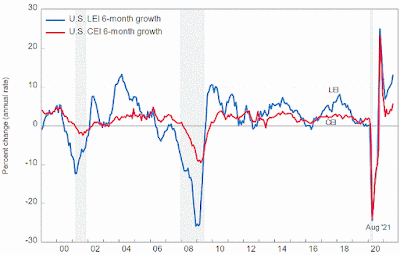
Chart: Leading Economic Index - Six-Month Growth - August 2021 Update

Chart: Leading Economic Index
Six-Month Growth
August 2021 Update
 
==============
 
From Today's Report:

"...'The U.S. LEI rose sharply in August and remains on a rapidly rising trajectory,' said Ataman Ozyildirim, Senior Director of Economic Research at The Conference Board. 'While the Delta variant -- alongside rising inflation fears -- could create headwinds for labor markets and the consumer spending outlook in the near term, the trend in the LEI is consistent with robust economic growth in the reminder of the year. Real GDP growth for 2021 is expected to reach nearly 6.0 percent year-over-year, before easing to a still-robust 4.0 percent for 2022.'..."

==============


============== 


Labels: , , , , , , ,


--> www.FedPrimeRate.com Privacy Policy <--

>  SITEMAP  <

Thursday, September 16, 2021

U.S. Retail And Food Services Sales Report for August 2021

The Commerce Department this morning released advance estimates of U.S. Retail and Food Services Sales for August 2021:

Predicted: Unchanged
Actual: +0.7102% (+$4,363,000,000)

The yellow-highlighted percentage above represents the month-to-month change in total sales receipts for retailers that sell durable and non-durable goods, and retailers that provide food and beverage services.

=================

  • Estimated Retail Sales During August 2021: $618,676,000,000
  • Change From 12 Months Previous: +15.055% (+$80,956,000,000)

=================

 
CHART: Retail Sales - August 2021 Update

CHART: Retail Sales - August 2021 Update
 
=================

================= 


Labels: , , , , , , , , , ,


--> www.FedPrimeRate.com Privacy Policy <--

>  SITEMAP  <

Tuesday, September 14, 2021

Consumer Price Index (CPI) for August 2021

Earlier this morning, the Labor Department's Bureau of Labor Statistics released the Consumer Price Index (CPI) for August 2021:

=========================================

CPI During August 2021: 273.567

=========================================


Predicted: +0.5%
Actual: +0.207% (+0.564 point)

  • Change From 12 Months Previous: +5.251% (+13.649 points)

=========================================

The above, yellow-highlighted figures represent the seasonally adjusted, month-to-month change in prices for a specific group of goods and services that consumers buy, and is, therefore, a very important part of the overall inflation picture for the country.

The "predicted" figure is what economists were expecting, while the "actual" is the true or real figure.

General categories that constitute the CPI are:

  • Healthcare
  • Housing
  • Clothing
  • Communications
  • Education
  • Transportation
  • Food and Beverages
  • Recreation
  • Miscellaneous Goods and Services (grooming expenses, etc.)

 =========================================

CHART: Consumer Price Index (CPI) - 12 Month Percentage Change - August 2021 Update

CHART: Consumer Price Index (CPI)
12 Month Percentage Change
August 2021 Update
  =========================================

CPI During July 2021: 273.003

=========================================


=========================================


Labels: , , , , , , , , ,


--> www.FedPrimeRate.com Privacy Policy <--

>  SITEMAP  <

Friday, September 10, 2021

Producer Price Index - Final Demand (PPI-FD) for August 2021

The Producer Price Index - Final Demand (PPI-FD) for August 2021 was released this morning:

Predicted: +0.8%
Actual: +0.7%

Change from 12 months previous:  +8.3%

=============

Below is the PPI-FD when food, energy and trade services are removed:

Predicted: +0.5%
Actual: +0.3%

Change from 12 months previous:  +6.3%

=============

The above, yellow-highlighted percentages represent the month-to-month change in prices received by domestic producers of goods and services, for goods, services and construction in the United States, for final demand.

Final Demand = personal consumption (consumers), exports, government purchases and capital investment.

The PPI-FD is released by the Labor Department's Bureau of Labor Statistics.

The "predicted" figure is what economists were expecting, while the "actual" is the true or real figure.


==============

CHART: Producer Price Index - Final Demand (PPI-FD) 12 Month Percent Changes August 2021 Update

CHART: Producer Price Index - Final Demand (PPI-FD)
12 Month Percent Changes
August 2021 Update

==============

From Today's Report:

 "...On an unadjusted basis, the final demand index rose 8.3 percent for the 12 months ended in August, the largest advance since 12-month data were first calculated in November 2010... "

==============


Labels: , , , , , , , , , ,


--> www.FedPrimeRate.com Privacy Policy <--

>  SITEMAP  <

Thursday, September 09, 2021

New Unemployment Insurance Claims for The Week of September 4, 2021

Jobless Claims
Jobless Claims

Earlier today, the Labor Department released its weekly report on New Jobless Insurance Claims for the week that ended on September 4, 2021:

====================

Predicted: 350,000

  • Actual: 310,000
====================

The yellow-highlighted figure represents the number of first-time claims for unemployment benefits for the entire United States. The "predicted" figure is what economists were expecting, while the "actual" is the true or real figure.

  • Previous Week (revised): 345,000
  • 4-Week Moving Average: 339,500

====================


====================


Labels: , , , , , , , , , ,


--> www.FedPrimeRate.com Privacy Policy <--

>  SITEMAP  <

Job Openings and Labor Turnover Survey (JOLTS) for July 2021

The Job Openings and Labor Turnover Survey (JOLTS*) for July 2021 was released by the Labor Department this morning:

============

Job Openings

Predicted: 10,300,000
Actual:    10,934,000 (New Record High)

  • Previous Month (revised): 10,185,000

  • One Year Previous: 6,717,000

  • Change from one year previous: +62.781% (+4,217,000)

=============

Hires: 6,667,000 

Total Separations §: 5,786,000 

=============

From Today's Release:

"...Job Openings: On the last business day of July, the number and rate of job openings increased to series highs of 10.9 million (+749,000) and 6.9 percent, respectively. Job openings increased in several industries, with the largest increases in health care and social assistance (+294,000); finance and insurance (+116,000); and accommodation and food services (+115,000). The number of job openings increased in the Northeast, South, and West regions..."

"...Collection Mode: Data collection for JOLTS was affected by the COVID-19 pandemic. Prior to the pandemic, JOLTS collected 42 percent of data by phone at the JOLTS data collection center on average. Most phone respondents were asked to report electronically. However, data collection was adversely affected by the inability to reach some respondents that normally respond by phone..."


=============
 
CHART: Hires and Total Separations Rates - July 2021 Update

CHART: Hires and Total Separations Rates
July 2021 Update
  
=============

§ = Here's How The Labor Department Defines Total Separations:

"Total separations includes quits, layoffs and discharges, and other separations. Total separations is referred to as turnover. Quits are generally voluntary separations initiated by the employee. Therefore, the quits rate can serve as a measure of workers’ willingness or ability to leave jobs. Layoffs and discharges are involuntary separations initiated by the employer. Other separations includes separations due to retirement, death, disability, and transfers to other locations of the same firm."

=============

=============


Labels: , , , , , , , , , , , ,


--> www.FedPrimeRate.com Privacy Policy <--

>  SITEMAP  <

Friday, September 03, 2021

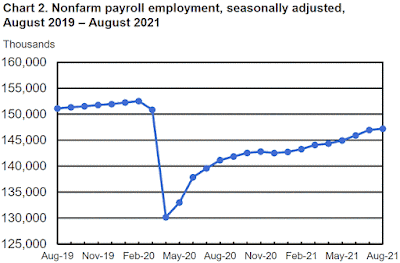
Employment Situation Report for August 2021

The Employment Situation Report for August 2021 was released by The Department of Labor's Bureau of Labor Statistics this morning:

Nonfarm Payrolls (month-to-month change)
Predicted: +800,000
Actual: +235,000


U-3 Unemployment Rate (Headline)
Actual: 5.2%
Previous Month: 5.4%
12 Months Previous: 8.4%

U-6 Unemployment Rate*
Actual: 8.8%
Previous Month: 9.2%
12 Months Previous: 14.2%

Average Hourly Earnings (month-to-month change)
Predicted: +0.3%
Actual: +0.542% (+$0.14)

Average Hourly Earnings (year-on-year change)
Predicted: +3.5%
Actual: +4.756% (+$1.18)

Average Weekly Earnings (month-to-month change)
Actual: +0.542% (+$4.79)


Average Weekly Earnings (year-on-year change)
Actual: +5.373% (+$45.32)

Civilian Labor Force Participation Rate: 61.7%
Previous Month: 61.7%
12 Months Previous: 61.7%

Average Workweek
Predicted: 34.7 hours
Actual: 34.7 hours

Economist, academics, central bankers and investors pay very close attention to the monthly Employment Situation report as it offers penetrating insight as to the current and near-future state of the overall U.S. economy. If a) Americans are earning more money and b) the economy is creating new jobs, this typically translates to more money being pumped into the economy (and vice versa.)

The "predicted" figure is what economists were expecting, while the "actual" is the true or real figure.

===================

From Today's Report:

 "...In August, 13.4 percent of employed persons teleworked because of the coronavirus pandemic, little changed from the prior month. These data refer to employed persons who teleworked or worked at home for pay at some point in the last 4 weeks specifically because of the pandemic.
 
In August, 5.6 million persons reported that they had been unable to work because their employer closed or lost business due to the pandemic -- that is, they did not work at all or worked fewer hours at some point in the last 4 weeks due to the pandemic. This measure is up from 5.2 million in July. Among those who reported in August that they were unable to work because of pandemic-related closures or lost business, 13.9 percent received at least some pay from their employer for the hours not worked, up from 9.1 percent in the prior month. Among those not in the labor force in August, 1.5 million persons were prevented from looking for work due to the pandemic, little changed from July. (To be counted as unemployed, by definition, individuals must be either actively looking for work or on temporary layoff.)   These supplemental data come from questions added to the household survey beginning in May 2020 to help gauge the effects of the pandemic on the labor market. The data are not seasonally adjusted. Tables with estimates from the supplemental questions for all months are available online at www.bls.gov/cps/effects-of-the-coronavirus-covid-19-pandemic.htm.

Average hourly earnings for all employees on private nonfarm payrolls rose by 17 cents to $30.73 in August, following increases in the prior 4 months. In August, average hourly earnings of private-sector production and nonsupervisory employees rose by 14 cents to $25.99. The data for recent months suggest that the rising demand for labor associated with the recovery from the pandemic may have put upward pressure on wages. However, because average hourly earnings vary widely across industries, the large employment fluctuations since February 2020 complicate the analysis of recent trends in average hourly earnings. In August, the average workweek for all employees on private nonfarm payrolls was 34.7 hours for the third consecutive month. In manufacturing, the average workweek fell by 0.2 hour over the month to 40.3 hours, and overtime remained at 3.2 hours. The average workweek for production and nonsupervisory employees on private nonfarm payrolls was unchanged at 34.2 hours. The change in total nonfarm payroll employment for June was revised up by 24,000, from +938,000 to +962,000, and the change for July was revised up by 110,000, from +943,000 to +1,053,000. With these revisions, employment in June and July combined is 134,000 higher than previously reported. (Monthly revisions result from additional reports received from businesses and government agencies since the last published estimates and from the recalculation of seasonal factors.)..."

===================

CHART: Nonfarm Payroll Employment August 2021 Update

CHART: Nonfarm Payroll Employment
August 2021 Update

===================

CHART: U-3 (Headline) Unemployment Rate August 2021 Update

CHART: U-3 (Headline) Unemployment Rate
August 2021 Update

 ===================

 * =  The U-6 Unemployment Rate is defined as:

"Total unemployed, plus all persons marginally attached to the labor force, plus total employed part time for economic reasons, as a percent of the civilian labor force plus all persons marginally attached to the labor force."


===================


 ===================


Labels: , , , , , , , , , , , , ,


--> www.FedPrimeRate.com Privacy Policy <--

>  SITEMAP  <

U.S. Factory Orders During July 2021

The U.S. Census Bureau this morning released their report on Manufacturers' Shipments, Inventories and Orders -- also known as Factory Orders -- for July 2021:

======== 

 
Predicted: +0.5%
Actual: +0.382% (+$1,934,000,000)

  • July 2021 New Orders: $508,062,000,000.

  • June 2021 New Orders: $506,128,000,000.

========

The yellow-highlighted percentage is the month-to-month change in orders for both durable and nondurable goods made by U.S. manufacturers. The "predicted" figure is what economists were expecting, while the "actual" is the true or real figure.

=============

CHART: U.S. Factory Orders - July 2021 Update

CHART: U.S. Factory Orders - July 2021 Update


=============


=============


Labels: , , , , , , , , ,


--> www.FedPrimeRate.com Privacy Policy <--

>  SITEMAP  <

bing

bing

www.FedPrimeRate.com
Entire Website © 2024 FedPrimeRate.comSM


This website is neither affiliated nor associated with The United States Federal Reserve
in any way. Information in this website is provided for educational purposes only. The owners
of this website make no warranties with respect to any and all content contained within this
website. Consult a financial professional before making important decisions related to any
investment or loan product, including, but not limited to, business loans, personal loans,
education loans, first or second mortgages, credit cards, car loans or any type of insurance.