.comment-link {margin-left:.6em;}

Economy

Economic Data (USA)

Friday, June 26, 2020

PCE Price Index + Personal Income + Consumer Spending Report for May 2020

The Commerce Department's Bureau of Economic Analysis (BEA) released its report on The PCE Price Index, Consumer Spending and Personal Income for May 2020:

=============

Consumer Spending (Personal Consumption Expenditures)

Predicted: +5.0%

  • Actual: +8.2%
  • Actual (2012 Chained* Dollars): +8.1%
=============

Personal Income

Predicted: -5.0%
  • Actual: -4.2%
=============

  • Disposable Personal Income, Current Dollars: -4.9%
  • Disposable Personal Income (2012 Chained* Dollars): -5.0%

=============

The above highlighted percentages represent the month-to-month change in Consumer Spending (aka Personal Consumption Expenditures), Personal Income and Disposable Personal Income for the entire United States.

=============

=====================
=====================

=====================

Personal Consumption Expenditures (PCE) Price Index
Predicted: Unchanged
Actual: +0.1%

  • Change from 12 months previous: +0.5%
=====================

Core PCE Price Index
( = PCE Price Index minus food and energy)
Predicted: Unchanged
Actual: +0.1%

  • Change from 12 months previous: +1.0%
=====================

The yellow-highlighted percentages represent the month-to-month change in the prices associated with domestic personal consumption.  The PCE Price Index is different from the Consumer Price Index (CPI) in that it is a very broad measure of the prices associated with domestic products and services, while the CPI measures a more limited fixed basket of goods and services.

The broad nature of the PCE Price Index is key to why it is the Federal Reserve's preferred measure of inflation.  The Federal Open Market Committee (FOMC) pays very close attention to it.

=====================

The "predicted" figures are what economists were expecting, while the "actual" figures are the true or real figure.


=====================

From Today's Report:


"...Coronavirus (COVID-19) Impact on May 2020 Personal Income and Outlays

The May estimate for personal income and outlays was impacted by the response to the spread of
COVID-19. Federal economic recovery payments continued but were at a lower level than in April, and government “stay-at-home” orders were partially lifted in May. The full economic effects of the COVID-19 pandemic cannot be quantified in the personal income and outlays estimate for May because the impacts are generally embedded in source data and cannot be separately identified. For more information, see the “highlights” file and the Effects of Selected Federal Pandemic Response Programs on Personal Income table..."

=====================


CHART: Month-to-Month Change In Personal Income - May 2020 Update
CHART: Month-to-Month Change In Personal Income
May 2020 Update

=====================

 =====================

*Chained dollars is a method of adjusting real dollar amounts for inflation over time, so as to allow comparison of figures from different years. The Commerce Department introduced the chained-dollar measure in 1996. Chained dollars generally reflect dollar figures computed with 2012 as the base year.

Labels: , , , , , , , , , , , ,


--> www.FedPrimeRate.com Privacy Policy <--

>  SITEMAP  <

Tuesday, June 23, 2020

New Home Sales During May 2020

The May 2020 New Home Sales report was released by the Commerce Department this morning:

Predicted: 600,000
Actual New Home Sales: 676,000

------------------------------------------------------

  • Change from One Month Previous: +96,000 units (+16.552%)

  • Change from One Year Previous: +76,000 units (+12.667%)

------------------------------------------------------

Median Price for a New Home
during May 2020: $317,900

***************************

Average Price for a New Home
during May 2020: $368,800


------------------------------------------------------

Inventory: 318,000 (5.6 months supply at current sales rate; seasonally‐adjusted.)

------------------------------------------------------

================================


================================


Compiled jointly by the U.S. Commerce Department and the U.S. Department of Housing and Urban Development, the yellow-highlighted figure above is the seasonally adjusted and annualized number of newly-built homes with committed buyers for the indicated month.

The "predicted" figure is what economists were expecting, while the "actual" is the true or real figure.

The New Home Sales report is watched by economists and investors because it offers insight into the state of the U.S. housing market, and also provides data that can be used to predict sales of large household furniture and appliances like refrigerators, air conditioners, microwave ovens, etc.


================================

================================

Labels: , , , , , , ,


--> www.FedPrimeRate.com Privacy Policy <--

>  SITEMAP  <

Monday, June 22, 2020

Existing Home Sales During May 2020

The Existing Home Sales report for May 2020 was released by The National Association of  Realtors® (NAR®) this morning:

Predicted: 4,100,000
Actual: 3,910,000

  •  Change from Previous Month: -9.7% (-420,000 homes)

  •  Change from One Year Previous: -26.642% (-1,420,000 homes)
==========

Inventory: 1,550,000 (4.8 months supply)

==========

The yellow-highlighted, "actual" figure above represents the preliminary, seasonally adjusted annualized sales count of existing homes, co-ops and condominiums for the indicated month. The "predicted" figure is what economists were expecting, while the "actual" is the true or real figure.

------------------------------------------------------

Median Price for A Used Home During May 2020: $284,600

Change from One Year Previous: +2.301% (+$6,400)

---------

Average Price for A Used Home During May 2020: $319,300

Change from One Year Previous: +1.494% (+$4,700)


------------------------------------------------------ 

==========


==========

From Today's Report:


"...Existing-home sales fell in May, marking a three-month decline in sales as a result of the coronavirus outbreak, according to the National Association of Realtors®. Each of the four major regions witnessed dips in month-over-month and year-over-year sales, with the Northeast experiencing the greatest month-over-month drop.

'Sales completed in May reflect contract signings in March and April – during the strictest times of the pandemic lockdown and hence the cyclical low point,' said
Lawrence Yun, NAR’s chief economist. 'Home sales will surely rise in the upcoming months with the economy reopening, and could even surpass one-year-ago figures in the second half of the year.'

The median existing-home price for all housing types in May was $284,600, up 2.3% from May 2019 ($278,200), as prices increased in every region. May’s national price increase marks 99 straight months of year-over-year gains.

'New home construction needs to robustly ramp up in order to meet rising housing demand,' Yun said. 'Otherwise, home prices will rise too fast and hinder first-time buyers, even at a time of record-low mortgage rates.'

Properties typically remained on the market for 26 days in May, seasonally down from 27 days in April, but equal to 26 days in May 2019. Fifty-eight percent of homes sold in May 2020 were on the market for less than a month.

First-time buyers were responsible for 34% of sales in May, down from 36% in April 2020 and up from 32% in May 2019. NAR’s 2019 Profile of Home Buyers and Sellers – released in late 20194 – revealed that the annual share of first-time buyers was 33%.

'Although the real estate industry faced some very challenging circumstances over the last several months, we’re seeing signs of improvement and growth, and I’m hopeful the worst is behind us,' said NAR President Vince Malta, broker at Malta & Co., Inc., in San Francisco, Calif. 'NAR, along with our partners and 1.4 million members, are already working to reignite America’s real estate industry, which will be a key driver in our nation’s economic recovery.'

According to Freddie Mac, the average commitment rate (link is external) for a 30-year, conventional, fixed-rate mortgage decreased to 3.23% in May, down from 3.31% in April. The average commitment rate across all of 2019 was 3.94%.
.."

==================


==================

Labels: , , , , , , , , , ,


--> www.FedPrimeRate.com Privacy Policy <--

>  SITEMAP  <

Chicago Fed National Activity Index (CFNAI) for May 2020

The Federal Reserve Bank of Chicago released its National Activity Index (CFNAI) for May 2020:

==================

Predicted: -5.00
  • Actual (CFNAI): +2.61

==================

  • Previous Month (revised): -17.89
  • 3-Month Moving Average (CFNAI-MA3): -6.65
==================


The CFNAI is a weighted average of 85 indicators of growth in national economic activity drawn from four broad categories of data:

  • Production and income;
  • Employment, unemployment, and hours;
  • Personal consumption and housing; and
  • Sales, orders, and inventories.

The "predicted" figure is what economists were expecting, while the yellow-highlighted figure is what was reported.

==================


Chart: Chicago Fed National Activity Monthly Index - May 2020 Update
Chart: Chicago Fed National Activity Monthly Index
May 2020 Update

==================

From Today's Report

"...Index Suggests Economic Growth Increased Substantially In May

Led by improvements in production- and employment-related indicators, the Chicago Fed National Activity Index (CFNAI) rose to +2.61 in May from –17.89 in April. All four broad categories of indicators used to construct the index made positive contributions in May, and all four categories increased from April. The index’s three-month moving average, CFNAI-MA3, moved up to –6.65 in May from –7.50 in April..
."

==================

Understanding The CFNAI:

A zero value for the monthly index has been associated with the national economy expanding at its historical trend (average) rate of growth; negative values with below-average growth (in standard deviation units); and positive values with above-average growth.

Periods of economic expansion have historically been associated with values of the CFNAI-MA3 above -0.70 and the CFNAI Diffusion Index above -0.35. Conversely, periods of economic contraction have historically been associated with values of the CFNAI-MA3 below -0.70 and the CFNAI Diffusion Index below -0.35.

An increasing likelihood of a period of sustained increasing inflation has historically been associated with values of the CFNAI-MA3 above +0.70 more than two years into an economic expansion. Similarly, a substantial likelihood of a period of sustained increasing inflation has historically been associated with values of the CFNAI-MA3 above +1.00 more than two years into an economic expansion.

==================


==================


Labels: , , , , , , , , ,


--> www.FedPrimeRate.com Privacy Policy <--

>  SITEMAP  <

Thursday, June 18, 2020

Leading Economic Index for May 2020

The Conference Board® released its Leading Economic Index® (LEI) for May 2020 this morning:

==============

Index for May 2020: 99.8 (The baseline 100 score is associated with 2016 data.)

==============

Predicted: +2.0%
  • Actual: +2.781% (+2.7 points)

==============

  • LEI for April 2020: 97.1
     
  • LEI for March 2020: 103.4

  • LEI for February 2020: 111.8
     
  • LEI for January 2020: 112.0

  • LEI for December 2019: 111.4

  • LEI for November 2019: 111.6

  • LEI for October 2019: 111.4

  • LEI for September 2019: 111.6

==============

The yellow-highlighted percentage is the month-to-month change for the index.  The "predicted" figure is what economists were expecting, while the "actual" is the true or real figure.

The LEI is a composite of 10 of the nation's economic data releases that's put together by The Conference Board. Statistically, the components listed below have shown a significant increase or decrease before national economic upturns or downturns:

  1. The Standard + Poor's 500 Index

  2. Average weekly claims for unemployment insurance

  3. Building permits for new private housing

  4. The interest rate spread between the yield on the benchmark 10-Year Treasury Note and Federal Funds

  5. ISM® Index of New Orders

  6. Manufacturer's new orders for consumer goods or materials

  7. Manufacturers' new orders, nondefense capital goods excluding aircraft orders

  8. Average weekly manufacturing hours

  9. Average consumer expectations for business conditions

  10. Leading Credit Index™

==============

Chart: Leading Economic Index - May 2020 Update

==============

Chart: Leading Economic Index - Six-Month Growth - May 2020 Update
Chart: Leading Economic Index - Six-Month Growth
May 2020 Update
 
==============
 
From Today's Report:

"...Initial shock to the economy may be behind us, but recovery path remains highly uncertain..."

"...'In May, the US LEI showed a partial recovery from its sharp decline over the previous three months, as economic activity began to pick up again,' said Ataman Ozyildirim, Senior Director of Economic Research at The Conference Board. 'The relative improvement in unemployment insurance claims is responsible for about two-thirds of the gain in the index. The improvements in labor markets, housing permits, and stock prices also buoyed the LEI, but new orders in manufacturing, consumers’ outlook on the economy, and the Leading Credit Index™ still point to weak economic conditions. The breadth and depth of the decline in the LEI between February and April suggest the economy at large will remain in recession territory in the near term.'..."

"...May’s job report was much more positive than expectations. Employment increased by 2.5 million, and the unemployment rate dropped to 13.3 percent from 14.7 in April. The unemployment rate does not fully reflect the size of the labor market slack, as many workers experienced a significant cut in weekly hours, and many of those who lost jobs have left the labor market all together.

The increase in the number of jobs simply reflects the opening of the economies in many states. Just to put things in perspective, the number of jobs in the US is still almost 20 million below the February level.

The increase in employment was across most industries, with the most notable exception being the government. The number of jobs in government dropped by 585,000 in May after a 963,000 drop in April. The decline in tax revenue in state and local governments is forcing them to shed workers.

The number of jobs is likely to sharply grow further in the next 2-3 months as states continue to relax social distancing restrictions. The big question is how willing consumers will be to spend on consumption categories that pose a contagion risk. They will probably spend less on categories that both pose a high contagion risk and could more easily be avoided for a while, such as entertainment and flights. A full recovery in employment is unlikely to occur in the next 12 months..."

==============


==============

Labels: , , , , , ,


--> www.FedPrimeRate.com Privacy Policy <--

>  SITEMAP  <

New Unemployment Insurance Claims for The Week of June 13, 2020

Jobless Claims
Jobless Claims

Earlier today, the Labor Department released its weekly report on New Jobless Insurance Claims for the week that ended on June 13, 2020:

====================

Predicted: 1,300,000

  • Actual: 1,508,000
====================

The yellow-highlighted figure represents the number of first-time claims for unemployment benefits for the entire United States. The "predicted" figure is what economists were expecting, while the "actual" is the true or real figure.

  • Previous Week (revised): 1,566,000
  • 4-Week Moving Average: 1,773,500

====================

From This Morning's Report:

"...The COVID-19 virus continues to impact the number of initial claims and insured unemployment. This report includes information on claimants filing Pandemic Unemployment Assistance and Pandemic Emergency Unemployment Compensation claims..."

====================


====================

Labels: , , , , , , , , ,


--> www.FedPrimeRate.com Privacy Policy <--

>  SITEMAP  <

Wednesday, June 17, 2020

Housing Starts During May 2020

The U.S. Commerce Department this morning released its Housing Starts report for May 2020:

---------------------------------------------------

Housing Starts:
Predicted: 1,000,000
Actual: 974,000

Change From Previous Month: +4.283% (+40,000 units)
Change From One Year Previous: -23.186% (-294,000 units)

---------------------------------------------------

Building Permits:
Predicted: 1,300,000
Actual: 1,220,000

Change From Previous Month: +14.447% (+154,000 units)
Change From One Year Previous: -8.819% (-118,000 units)

----------------------------------------------------

Housing Starts: The top, yellow-highlighted figure is a measure of initial construction of single and multi-family residential units in the United States for the indicated month. Seasonally adjusted annual rate. The "predicted" figure is what economists were expecting, while the "actual" is the true or real figure.

If you're wondering about the demand for new homes in the United States, or about the American residential construction industry in general, then you should pay attention to the monthly Housing Starts report. This report also offers insight into specific types of consumer spending: when housing starts are up, demand for the stuff that a consumer would purchase for a new home (large appliances, consumer electronics, furniture, etc.) tends to also rise -- and vice versa.


=================

CHART: Housing Starts - May 2020 Update

=================


================


Labels: , , , , , , ,


--> www.FedPrimeRate.com Privacy Policy <--

>  SITEMAP  <

Crude Oil Inventories Report for Week of June 12, 2020

Crude Oil Inventories

The U.S. Crude Oil Inventories report for the week that ended on June 12, 2020 was released this morning:

-- Change from Last Week: +1,200,000 Barrels

-- Change from A Year Ago (Y/Y): +56,900,000 Barrels

-- Current U.S. Crude Oil Stocks: 539,300,000 Barrels

Diminishing crude oil inventories often translate to higher crude oil prices (and vice versa), but not always.

The report is produced by the U.S. Energy Information Administration (EIA).


Labels: , , , ,


--> www.FedPrimeRate.com Privacy Policy <--

>  SITEMAP  <

Tuesday, June 16, 2020

Industrial Production + Manufacturing + Capacity Utilization During May 2020

The Industrial Production, Manufacturing and Capacity Utilization numbers for May 2020 were released by the Federal Reserve this morning:

Industrial Production:
Predicted: +3.0%
Actual: +1.4%

Manufacturing:
Predicted: +4.0%
Actual: +3.8%

The yellow-highlighted percentages represent the month-to-month change in manufacturing, and physical output from mining operations, utility plants and factories for the entire United States.

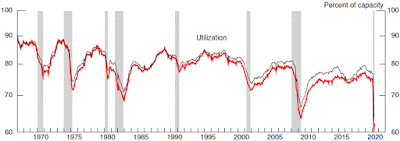
Capacity Utilization Rate:
Predicted: 65.0%
Actual: 64.8

The Capacity Utilization Rate represents the use of available resources at mining operations, utility plants and factories for the entire United States last month.

The "predicted" figures are what economists were expecting, while the "actual" is the true or real figure.

From Today's Report:

"...Total industrial production increased 1.4 percent in May, as many factories resumed at least partial operations following suspensions related to COVID-19. Even so, total industrial production in May was 15.4 percent below its pre-pandemic level in February. Manufacturing output -- which fell sharply in March and April -- rose 3.8 percent in May; most major industries posted increases, with the largest gain registered by motor vehicles and parts. The indexes for mining and utilities declined 6.8 percent and 2.3 percent, respectively. At 92.6 percent of its 2012 average, the level of total industrial production was 15.3 percent lower in May than it was a year earlier. Capacity utilization for the industrial sector increased 0.8 percentage point to 64.8 percent in May, a rate that is 15.0 percentage points below its long-run (1972 - 2019) average and 1.9 percentage points below its trough during the Great Recession..."

===============
 
CHART: Utilization Rate - May 2020 Update

===============


===============


Labels: , , , , , ,


--> www.FedPrimeRate.com Privacy Policy <--

>  SITEMAP  <

U.S. Retail And Food Services Sales Report for May 2020

The Commerce Department this morning released advance estimates of U.S. Retail and Food Services Sales for May 2020:

Predicted: +5.0%
Actual: +17.686% (+$72,969,000,000)

The yellow-highlighted percentage above represents the month-to-month change in total sales receipts for retailers that sell durable and non-durable goods, and retailers that provide food and beverage services.

=================

  • Estimated Retail Sales During May 2020: $485,545,000,000
  • Change From 12 Months Previous: -6.078% (-$31,420,000,000)

=================

Chart: Retail Sales - May 2020 Update

=================


=================


Labels: , , , , ,


--> www.FedPrimeRate.com Privacy Policy <--

>  SITEMAP  <

Monday, June 15, 2020

Empire State Manufacturing Survey for June 2020

Earlier today, the Federal Reserve Bank of New York  (NY Fed) released the Empire State Manufacturing Survey for this month (June 2020):

===========

Expected: -10.0
  • Actual: -0.2

Any figure below zero implies that manufacturing in the region is contracting, and vice versa.

===========

The May 2020 Figure: -48.5 

===========

CHART: Empire State Manufacturing Survey - June 2020 Update

===========

From Today's Report:

"...Business activity steadied in New York State, according to firms responding to the June 2020 Empire State Manufacturing Survey. After breaching record lows in April and May, the headline general business conditions index climbed forty-eight points to -0.2. New orders were unchanged from last month, and shipments inched higher. Delivery times and inventories were little changed. Employment levels edged slightly lower and the average workweek continued to decline. Input price increases picked up, and selling prices stabilized. Firms were notably more optimistic that conditions would be better in six months, with the index for future business conditions rising to its highest level in more than a decade..."
 
===========

About This Survey, From The NY Fed Website:


"...Participants from across the state in a variety of industries respond to a questionnaire and report the change in a variety of indicators from the previous month. Respondents also state the likely direction of these same indicators six months ahead..."

===========


===========


===========

Labels: , , , , ,


--> www.FedPrimeRate.com Privacy Policy <--

>  SITEMAP  <

Friday, June 12, 2020

Import and Export Price Indexes for May 2020

The Labor Department's Bureau of Labor Statistics this morning released its report on U.S. Import and Export Price Indexes for May 2020:

===============

Import Prices
Predicted: +0.8%
Actual: +1.0%

Change From 12 Months Previous: -6.0%

===============

Export Prices
Predicted: +0.7%
Actual: +0.5%

Change From 12 Months Previous: -6.0%

===============
 
The above percentages, highlighted in yellow, represent the month-to-month change in prices for:

  • Imports: the cost of goods produced in other countries and sold in the United States.
  • Exports: the cost of goods produced in the USA and sold in other countries.

Together, these indexes offer insight into the status of inflation in the United States, and for the global economy as well. The "predicted" figure is what economists were expecting, while the "actual" is the true or real figure.


===============

CHART: Import Price Index - May 2020 Update

===============

CHART: Export Price Index - May 2020 Update

===============

From Today's Report:


Coronavirus (COVID-19) Pandemic Impact on May 2020 Import and Export Price Index Data

"...The Bureau of Labor Statistics did not make any changes to either the collection method or estimation methodology for the May release of U.S. Import and Export Price Indexes. Survey response rates for May were 4.5 percentage points lower than those in May 2019. A small number of indexes that are normally published were not published in May. Additional information is available at www.bls.gov/covid19/import-export-price-indexes-covid19-impacts-may-2020.htm..."
==============


===============


Labels: , , , , , , ,


--> www.FedPrimeRate.com Privacy Policy <--

>  SITEMAP  <

Thursday, June 11, 2020

Producer Price Index - Final Demand (PPI-FD) for May 2020

The Producer Price Index - Final Demand (PPI-FD) for May 2020 was released this morning:

Predicted: +0.1%
Actual: +0.4%

Change from 12 months previous:  -0.8%

=============

Below is the PPI-FD when food, energy and trade services are removed:

Predicted: -0.2%
Actual: +0.1%

Change from 12 months previous:  -0.4%

=============

The above, yellow-highlighted percentages represent the month-to-month change in prices received by domestic producers of goods and services, for goods, services and construction in the United States, for final demand.

Final Demand = personal consumption (consumers), exports, government purchases and capital investment.

The PPI-FD is released by the Labor Department's Bureau of Labor Statistics.

The "predicted" figure is what economists were expecting, while the "actual" is the true or real figure.


==============

CHART: Producer Price Index - Final Demand (PPI-FD) for May 2020
CHART: Producer Price Index - Final Demand (PPI-FD)
May 2020
==============

From Today's Report:

Coronavirus (COVID-19) Impact on May 2020 Producer Price Index Survey Data

"...The Producer Price Index (PPI) response rates for May were consistent with those of April and no changes in estimation procedures were necessary. Additional information is available at www.bls.gov/covid19/effects-of-covid-19-pandemic-on-producer-price-index.htm..."

==============


==============


Labels: , , , , , ,


--> www.FedPrimeRate.com Privacy Policy <--

>  SITEMAP  <

New Unemployment Insurance Claims for The Week of June 6, 2020

Jobless Claims
Jobless Claims

Earlier today, the Labor Department released its weekly report on New Jobless Insurance Claims for the week that ended on June 6, 2020:

====================

Predicted: 1,570,000

  • Actual: 1,542,000
====================

The yellow-highlighted figure represents the number of first-time claims for unemployment benefits for the entire United States. The "predicted" figure is what economists were expecting, while the "actual" is the true or real figure.

  • Previous Week (revised): 1,897,000
  • 4-Week Moving Average: 2,002,000

====================

From This Morning's Report:

"...The COVID-19 virus continues to impact the number of initial claims and insured unemployment. This report includes information on claimants filing Pandemic Unemployment Assistance and Pandemic Emergency Unemployment Compensation claims..."

====================


====================


Labels: , , , , , , , , ,


--> www.FedPrimeRate.com Privacy Policy <--

>  SITEMAP  <

Wednesday, June 10, 2020

Crude Oil Inventories Report for Week of June 5, 2020

Crude Oil Inventories

The U.S. Crude Oil Inventories report for the week that ended on June 5, 2020 was released this morning:

-- Change from Last Week: +5,700,000 Barrels

-- Change from A Year Ago (Y/Y): +52,600,000 Barrels

-- Current U.S. Crude Oil Stocks: 538,100,000 Barrels

Diminishing crude oil inventories often translate to higher crude oil prices (and vice versa), but not always.

The report is produced by the U.S. Energy Information Administration (EIA).


    Labels: , , , ,


    --> www.FedPrimeRate.com Privacy Policy <--

    >  SITEMAP  <

    Consumer Price Index (CPI) for May 2020

    Earlier this morning, the Labor Department's Bureau of Labor Statistics released the Consumer Price Index (CPI) for May 2020:

    =========================================

    Predicted: Unchanged
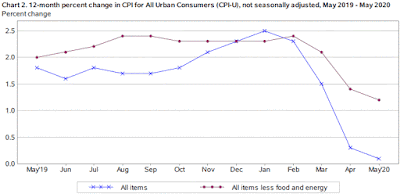
    Actual: -0.1%

    • Change From 12 Months Previous: +0.1%

    =========================================

    Below is the CPI when food and energy are removed, also known as core CPI:

    Predicted: +0.1%
    Actual: -0.1%

    • Change From 12 Months Previous: +1.2%

    =========================================

    The above, yellow-highlighted figures represent the seasonally adjusted, month-to-month change in prices for a specific group of goods and services that consumers buy, and is, therefore, a very important part of the overall inflation picture for the country.

    The "predicted" figure is what economists were expecting, while the "actual" is the true or real figure.

    General categories that constitute the CPI are:

    • Healthcare
    • Housing
    • Clothing
    • Communications
    • Education
    • Transportation
    • Food and Beverages
    • Recreation
    • Miscellaneous Goods and Services (grooming expenses, etc.)

    =========================================

    From Today's Report:

    "...Declines in the indexes for motor vehicle insurance, energy, and apparel more than offset increases in food and shelter indexes to result in the monthly decrease in the seasonally adjusted all items index. The gasoline index declined 3.5 percent in May, leading to a 1.8-percent decline in the energy index. The food index, in contrast, increased 0.7 percent in May as the index for food at home rose 1.0 percent.


    The index for all items less food and energy fell 0.1 percent in May, its third consecutive monthly decline. This is the first time this index has ever declined in three consecutive months. Along with motor vehicle insurance and apparel, the indexes for airline fares and used cars and trucks declined in May. The indexes for shelter, recreation, medical care, household furnishings and operations, and new vehicles all increased.


    The all items index increased 0.1 percent for the 12 months ending May. The index for all items less food and energy increased 1.2 percent over the last 12 months; this compares to a 2.4-percent increase a few months ago (the period ending February). The energy index fell 18.9 percent over the last year. The food index increased 4.0 percent over the last 12 months, with the index for food at home rising 4.8 percent.

    =============

    Coronavirus (
    COVID-19) Pandemic Impact on May 2020 Consumer Price Index Data

    Data collection by personal visit for the Consumer Price Index (CPI) program has been suspended since March 16, 2020. When possible, data normally collected by personal visit were collected either online or by phone. Additionally, data collection in May was affected by the temporary closing or limited operations of certain types of establishments. These factors resulted in an increase in the number of prices considered temporarily unavailable and imputed. While the CPI program attempted to collect as much data as possible, many indexes are based on smaller amounts of collected prices than usual, and a small number of indexes that are normally published were not published this month. Additional information is available at www.bls.gov/covid19/effects-of-covid-19-pandemic-on-consumer-price-index.htm..."

     
    =========================================

    Chart: Consumer Price Index (CPI) - May 2020 Update
    Chart: Consumer Price Index (CPI) - May 2020 Update

    ========================================= 


    =========================================


    Labels: , , , , , , , ,


    --> www.FedPrimeRate.com Privacy Policy <--

    >  SITEMAP  <

    Tuesday, June 09, 2020

    Latest GDPNow Real Gross Domestic Product Forecast for Q2:2020

    The Federal Reserve Bank of Atlanta released its latest GDPNow forecast for the growth rate of real gross domestic product (GDP) for the second quarter of 2020.

    ==============

    Latest Forecast for Q2, 2020: -48.5%

    ==============

    Previous Reading (June 4, 2020): -53.8%)

    ==============

    Chart: GDPNow Forecast - Q2 | 2020 - June 9, 2020
    Chart: GDPNow Forecast - Q2 | 2020 - June 9, 2020

    ==============


    From Today's Report:

    "...The GDPNow model estimate for real GDP growth (seasonally adjusted annual rate) in the second quarter of 2020 is -48.5 percent on June 9, up from -53.8 percent on June 4. After last Friday’s employment release from the U.S. Bureau of Labor Statistics and this morning’s wholesale trade release from the U.S. Census Bureau, increases in the nowcasts of second-quarter real personal consumption expenditure growth and real gross private domestic investment growth were partly offset by decreases in the nowcasts of real government spending growth and real net exports.

    The next GDPNow update is Tuesday, June 16, 2020..."

    About The GDPNow Forecast Model:


    "...GDPNow is not an official forecast of the Atlanta Fed. Rather, it is best viewed as a running estimate of real GDP growth based on available data for the current measured quarter. There are no subjective adjustments made to GDPNow the estimate is based solely on the mathematical results of the model. In particular, it does not capture the impact of COVID-19 beyond its impact on GDP source data and relevant economic reports that have already been released. It does not anticipate the impact of COVID-19 on forthcoming economic reports beyond the standard internal dynamics of the model..."

    ============== 


    ==============

     
    ==============

    Labels: , , , , , , , ,


    --> www.FedPrimeRate.com Privacy Policy <--

    >  SITEMAP  <

    Job Openings and Labor Turnover Survey (JOLTS) for April 2020

    The Job Openings and Labor Turnover Survey (JOLTS*) for April 2020 was released by the Labor Department this morning:

    ============

    Job Openings

    Predicted: 5,700,000
    Actual:    5,046,000

    • Previous Month (revised): 6,011,000

    • One Year Previous:7,284,000

    =============

    Hires: 3,524,000 

    Total Separations: 9,888,000 

    =============

    The above, yellow-highlighted percentage represents the estimated number of job openings in the United States during the indicated month. The "predicted" figure is what economists were expecting, while the "actual" is the true or real figure.

    =============

    From Today's Release:

    "...The number of total separations decreased by 4.8 million to 9.9 million in April, the U.S. Bureau of Labor Statistics reported today. Despite the over the month decline, the total separations level is the second highest in series history. Within separations, the quits rate fell to 1.4 percent and the layoffs and discharges rate decreased to 5.9 percent. Job openings decreased to 5.0 million on the last business day of April. Over the month, hires declined to 3.5 million, a series low. The changes in these measures reflect the effects of the coronavirus (COVID-19) pandemic and efforts to contain it. This release includes estimates of the number and rate of job openings, hires, and separations for the total nonfarm sector, by industry, and by four geographic regions.

     
    Job Openings

    On the last business day of April, the number of job openings declined to 5.0 million (-965,000). The job openings rate was little changed at 3.7 percent. Job openings fell in total private (-883,000) and in government (-82,000). Among the industries, the largest declines were in professional and business services (-309,000), health care and social assistance (-115,000), and retail trade (-113,000). The number of job openings decreased in all four regions.

    Hires
    In April, the number and rate of hires decreased to series lows of 3.5 million (-1,587,000) and 2.7 percent, respectively. The hires level decreased for total private (-1,439,000) and for government (-148,000). Hires decreased in a number of industries, with the largest declines in professional and business services (-422,000), accommodation and food services (-247,000), and construction (-196,000). The number of hires decreased in all four regions.

    Separations

    Total separations includes quits, layoffs and discharges, and other separations. Total separations is referred to as turnover. Quits are generally voluntary separations initiated by the employee. Therefore, the quits rate can serve as a measure of workers’ willingness or ability to leave jobs. Layoffs and discharges are involuntary separations initiated by the employer. Other separations includes separations due to retirement, death, disability, and transfers to other locations of the same firm.

    In April, the number and rate of total separations decreased to 9.9 million (-4,755,000) and 7.5 percent, respectively. Total separations decreased in many industries, with the largest decreases in accommodation and food services (-3,001,000), professional and business services (-473,000), and retail trade (-460,000). The number of total separations increased in real estate and rental and leasing (+47,000), state and local government, excluding education (+46,000), and information (+42,000). Total separations decreased in all four regions.

    In April, the number and rate of quits decreased to 1.8 million (-1,003,000) and 1.4 percent, respectively. Quits fell to 1.6 million (-976,000) for total private and 143,000 (-27,000) for government.
    Quits decreased in a number of industries, with the largest decreases in accommodation and food services (-249,000) and professional and business services (-216,000). The number of quits decreased in all four regions.

    The number and rate of layoffs and discharges decreased in April to 7.7 million (-3,773,000) and 5.9 percent, respectively. The number of layoffs and discharges decreased for total private to 7.5 million (-3,816,000) but increased for government to 216,000 (+43,000). The layoffs and discharges level decreased significantly in several industries. The majority of the decline occurred in accommodation and food services (-2,738,000) followed by retail trade (-338,000). Layoffs and discharges increased in construction (+85,000), information (+53,000), and wholesale trade (+50,000). The number of layoffs
    and discharges decreased in all four regions.

    The number of other separations was little changed in April. The other separations level was little changed for total private and for government. Other separations increased in professional and business
    services (+29,000) and health care and social assistance (+19,000). The number of other separations decreased in accommodation and food services (-15,000). Other separations were little changed in all
    four regions.

    Net Change in Employment

    Large numbers of hires and separations occur every month throughout the business cycle. Net employment change results from the relationship between hires and separations. When the number of hires exceeds the number of separations, employment rises, even if the hires level is steady or declining. Conversely, when the number of hires is less than the number of separations, employment declines, even if the hires level is steady or rising.

    Over the 12 months ending in April, hires totaled 67.2 million and separations totaled 81.1 million, yielding a net employment loss of 13.9 million. These totals include workers who may have been hired and separated more than once during the year..."

    =============

    Chart: Job Openings, Hires and Separations - April 2020 Update
    Chart: Job Openings, Hires and Separations
    April 2020 Update
    =============

    Here's How The Labor Department Defines Total Separations:

    "Total separations includes quits, layoffs and discharges, and other separations. Total separations is referred to as turnover. Quits are generally voluntary separations initiated by the employee. Therefore, the quits rate can serve as a measure of workers’ willingness or ability to leave jobs. Layoffs and discharges are involuntary separations initiated by the employer. Other separations includes separations due to retirement, death, disability, and transfers to other locations of the same firm."

    =============

    =============

    Labels: , , , , , , , , , ,


    --> www.FedPrimeRate.com Privacy Policy <--

    >  SITEMAP  <

    bing

    bing

    www.FedPrimeRate.com
    Entire Website © 2024 FedPrimeRate.comSM


    This website is neither affiliated nor associated with The United States Federal Reserve
    in any way. Information in this website is provided for educational purposes only. The owners
    of this website make no warranties with respect to any and all content contained within this
    website. Consult a financial professional before making important decisions related to any
    investment or loan product, including, but not limited to, business loans, personal loans,
    education loans, first or second mortgages, credit cards, car loans or any type of insurance.