.comment-link {margin-left:.6em;}

Economy

Economic Data (USA)

Tuesday, March 30, 2021

Consumer Confidence Index (CCI) for March 2021

The Consumer Confidence Index® (CCI) for this month (March 2021) was released by The Conference Board® this morning:

================

Predicted: 95.0
  • Actual: 109.7

================

Previous Month (revised): 90.4

  • Change from Previous Month: +21.35% (+19.3 points)
================

The "predicted" figure is what economists were expecting, while the "actual" is the true or real figure.

From Today's Report:

"...'Consumer Confidence increased to its highest level since the onset of the pandemic in March 2020,' said Lynn Franco, Senior Director of Economic Indicators at The Conference Board. 'Consumers’ assessment of current conditions and their short-term outlook improved significantly, an indication that economic growth is likely to strengthen further in the coming months. Consumers’ renewed optimism boosted their purchasing intentions for homes, autos and several big-ticket items. However, concerns of inflation in the short-term rose, most likely due to rising prices at the pump, and may temper spending intentions in the months ahead.'..."

Every month, The Conference Board sends a questionnaire to 5,000 U.S. households. Survey participants are polled about their feelings regarding the U.S. economy, current and future, and about their own fiscal circumstances. On average, 3,500 participants complete and return the 5-question survey.

  • The baseline "100" score for the CCI is associated with 1985 survey data.

When consumers feel good about the economy, they tend to do more spending, and vice versa.

Based in New York City, The Conference Board is a private, not-for-profit organization with a mission to, "create and disseminate knowledge about management and the marketplace to help businesses strengthen their performance and better serve society."

The CCI is usually released on the last Tuesday of the month.

================

================

Labels: , , , , , , , , ,


--> www.FedPrimeRate.com Privacy Policy <--

>  SITEMAP  <

Friday, March 26, 2021

PCE Price Index + Personal Income + Consumer Spending Report for February 2021

The Commerce Department's Bureau of Economic Analysis (BEA) released its report on The PCE Price Index, Consumer Spending and Personal Income for February 2021:

=============

Consumer Spending (Personal Consumption Expenditures)

Predicted: -0.5%

  • Actual: -1.0%
  • Actual (2012 Chained* Dollars): -1.2%
=============

Personal Income

Predicted: -5.0%
  • Actual: -7.1%
=============

  • Disposable Personal Income, Current Dollars: -8.0%
  • Disposable Personal Income (2012 Chained* Dollars): -8.2%

=============

The above highlighted percentages represent the month-to-month change in Consumer Spending (aka Personal Consumption Expenditures), Personal Income and Disposable Personal Income for the entire United States.

=============

===================== 

 
CHART: Month-to-Month Change in Consumer Spending February 2021 Update
CHART: Month-to-Month Change in Consumer Spending
February 2021 Update

=====================

=====================

Personal Consumption Expenditures (PCE) Price Index
Predicted: Unchanged
Actual: 0.2% 

  • Change from 12 months previous: +1.6%
=====================

Core PCE Price Index
( = PCE Price Index minus food and energy)
Predicted: 0.1%
Actual: 0.1%

  • Change from 12 months previous: +1.4%
=====================

The yellow-highlighted percentages represent the month-to-month change in the prices associated with domestic personal consumption.  The PCE Price Index is different from the Consumer Price Index (CPI) in that it is a very broad measure of the prices associated with domestic products and services, while the CPI measures a more limited fixed basket of goods and services.

The broad nature of the PCE Price Index is key to why it is the Federal Reserve's preferred measure of inflation.  The Federal Open Market Committee (FOMC) pays very close attention to it.

=====================

The "predicted" figures are what economists were expecting, while the "actual" figures are the true or real figure.


=====================

 =====================

*Chained dollars is a method of adjusting real dollar amounts for inflation over time, so as to allow comparison of figures from different years. The Commerce Department introduced the chained-dollar measure in 1996. Chained dollars generally reflect dollar figures computed with 2012 as the base year.


Labels: , , , , , , , , , , , , ,


--> www.FedPrimeRate.com Privacy Policy <--

>  SITEMAP  <

Wednesday, March 10, 2021

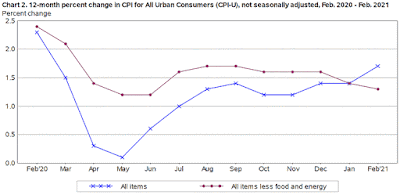
Consumer Price Index (CPI) for February 2021

Earlier this morning, the Labor Department's Bureau of Labor Statistics released the Consumer Price Index (CPI) for February 2021:

=========================================

Predicted: +0.4%
Actual: +0.4%

  • Change From 12 Months Previous: +1.7%

=========================================

Below is the CPI when food and energy are removed, also known as core CPI:

Predicted: 0.1%
Actual: 0.1%

  • Change From 12 Months Previous: +1.3%

=========================================

The above, yellow-highlighted figures represent the seasonally adjusted, month-to-month change in prices for a specific group of goods and services that consumers buy, and is, therefore, a very important part of the overall inflation picture for the country.

The "predicted" figure is what economists were expecting, while the "actual" is the true or real figure.

General categories that constitute the CPI are:

  • Healthcare
  • Housing
  • Clothing
  • Communications
  • Education
  • Transportation
  • Food and Beverages
  • Recreation
  • Miscellaneous Goods and Services (grooming expenses, etc.)

=========================================


Chart: Consumer Price Index (CPI) February 2021 Update
Chart: Consumer Price Index (CPI)
February 2021 Update 

 
========================================= 


=========================================


Labels: , , , , , , , , ,


--> www.FedPrimeRate.com Privacy Policy <--

>  SITEMAP  <

Tuesday, March 09, 2021

NFIB Small Business Optimism Index for February 2021

The National Federation of Independent Business® (NFIB®) released its Small Business Optimism Index (SBOI) for February 2021:

=========

Predicted: 95.0
Actual: 95.8

=========

  • Change from Previous Month: +0.842% (+ 0.8 point)
  • Change from 12 Months Previous: -8.325% (-8.7 points)

=========

  • The January 2021 SBOI reading was 95.0

  • The February 2020 SBOI reading was 104.5


=========


NFIB Small Business Optimism Index for February 2021
NFIB Small Business Optimism Index
February 2021 Update

=========

From Today's Report:


"...'Small business owners worked hard in February to overcome unexpected weather conditions along with the ongoing COVID-19 pandemic,' said NFIB Chief Economist Bill Dunkelberg. 'Capital spending has been strong, but not on Main Street. The economic recovery remains uneven for small businesses, especially those still managing state and local regulations and restrictions. Congress and the Biden administration must keep small businesses a priority as they plan future policy legislation.'..."

 =========

  • Small business survey questions can be found at the end of today's report.
  • The baseline "100" score is associated with 1986 survey data.
=========


=========


Labels: , , , , , , , , ,


--> www.FedPrimeRate.com Privacy Policy <--

>  SITEMAP  <

bing

bing

www.FedPrimeRate.com
Entire Website © 2024 FedPrimeRate.comSM


This website is neither affiliated nor associated with The United States Federal Reserve
in any way. Information in this website is provided for educational purposes only. The owners
of this website make no warranties with respect to any and all content contained within this
website. Consult a financial professional before making important decisions related to any
investment or loan product, including, but not limited to, business loans, personal loans,
education loans, first or second mortgages, credit cards, car loans or any type of insurance.