.comment-link {margin-left:.6em;}

Economy

Economic Data (USA)

Tuesday, September 29, 2020

Consumer Confidence Index (CCI) for September 2020

The Consumer Confidence Index® (CCI) for this month (September 2020) was released by The Conference Board® this morning:

================

Predicted: 90.0
  • Actual: 101.8

================

Previous Month (revised): 86.3
 
  • Change from Previous Month: +17.961% (+15.5 points)
================

The "predicted" figure is what economists were expecting, while the "actual" is the true or real figure.

From Today's Report:

"...'Consumer Confidence increased sharply in September, after back-to-back monthly declines, but remains below pre-pandemic levels,' said Lynn Franco, Senior Director of Economic Indicators at The Conference Board. 'A more favorable view of current business and labor market conditions, coupled with renewed optimism about the short-term outlook, helped spur this month’s rebound in confidence. Consumers also expressed greater optimism about their short-term financial prospects, which may help keep spending from slowing further in the months ahead.'..."

Every month, The Conference Board sends a questionnaire to 5,000 U.S. households. Survey participants are polled about their feelings regarding the U.S. economy, current and future, and about their own fiscal circumstances. On average, 3,500 participants complete and return the 5-question survey.

  • The baseline "100" score for the CCI is associated with 1985 survey data.

When consumers feel good about the economy, they tend to do more spending, and vice versa.

Based in New York City, The Conference Board is a private, not-for-profit organization with a mission to, "create and disseminate knowledge about management and the marketplace to help businesses strengthen their performance and better serve society."

The CCI is usually released on the last Tuesday of the month.

================

================

Labels: , , , , , , , ,


--> www.FedPrimeRate.com Privacy Policy <--

>  SITEMAP  <

Friday, September 11, 2020

Consumer Price Index (CPI) for August 2020

Earlier this morning, the Labor Department's Bureau of Labor Statistics released the Consumer Price Index (CPI) for August 2020:

=========================================

Predicted: +0.4%
Actual: +0.4%

  • Change From 12 Months Previous: +1.3%

=========================================

Below is the CPI when food and energy are removed, also known as core CPI:

Predicted: +0.4%
Actual: +0.4%

  • Change From 12 Months Previous: +1.7%

=========================================

The above, yellow-highlighted figures represent the seasonally adjusted, month-to-month change in prices for a specific group of goods and services that consumers buy, and is, therefore, a very important part of the overall inflation picture for the country.

The "predicted" figure is what economists were expecting, while the "actual" is the true or real figure.

General categories that constitute the CPI are:

  • Healthcare
  • Housing
  • Clothing
  • Communications
  • Education
  • Transportation
  • Food and Beverages
  • Recreation
  • Miscellaneous Goods and Services (grooming expenses, etc.)

=========================================

From Today's Report:

"...The Consumer Price Index for All Urban Consumers (CPI-U) increased 0.4 percent in August on a seasonally adjusted basis after rising 0.6 percent in July, the U.S. Bureau of Labor Statistics reported today. Over the last 12 months, the all items index increased 1.3 percent before seasonal adjustment.

The monthly increase in the seasonally adjusted all items index was broad-based; a sharp rise in the used cars and trucks index was the largest factor, but the indexes for gasoline, shelter, recreation, and household furnishings and operations also contributed. The energy index rose 0.9 percent in August as the gasoline index rose 2.0 percent. The food index rose 0.1 percent in August after falling in July; an increase in the food away from home index more than offset a slight decline in the food at home index.

The index for all items less food and energy rose 0.4 percent in August after increasing 0.6 percent in July. The sharp rise in the index for used cars and trucks accounted for over 40 percent of the increase; the indexes for shelter, recreation, household furnishings and operations, apparel, motor vehicle insurance, and airline fares also rose. The indexes for education and personal care were among the few to decline.

The all items index increased 1.3 percent for the 12 months ending August; this figure has been rising since the period ending May 2020, when the 12-month increase was 0.1 percent. The index for all items less food and energy increased 1.7 percent over the last 12 months. The food index increased 4.1 percent over the last 12 months, with the index for food at home rising 4.6 percent. Despite recent monthly
increases, the energy index fell 9.0 percent over the last 12 months..."
=============


=========================================

Chart: Consumer Price Index (CPI) - August 2020 Update

========================================= 


=========================================


Labels: , , , , , , , , ,


--> www.FedPrimeRate.com Privacy Policy <--

>  SITEMAP  <

Thursday, September 10, 2020

New Unemployment Insurance Claims for The Week of September 5, 2020

Jobless Claims
Jobless Claims

Earlier today, the Labor Department released its weekly report on New Jobless Insurance Claims for the week that ended on September 5, 2020:

====================

Predicted: 800,000

  • Actual: 884,000
====================

The yellow-highlighted figure represents the number of first-time claims for unemployment benefits for the entire United States. The "predicted" figure is what economists were expecting, while the "actual" is the true or real figure.

  • Previous Week (revised): 884,000
  • 4-Week Moving Average: 970,750

====================


====================
 
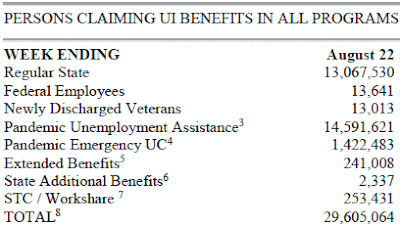
Persons Claiming UI Benefits In All Programs

 ====================

Labels: , , , , , , , , , ,


--> www.FedPrimeRate.com Privacy Policy <--

>  SITEMAP  <

Wednesday, September 09, 2020

Job Openings and Labor Turnover Survey (JOLTS) for July 2020

The Job Openings and Labor Turnover Survey (JOLTS*) for July 2020 was released by the Labor Department this morning:

============

Job Openings

Predicted: 6,400,000
Actual:    6,618,000

  • Previous Month (revised): 6,001,000

  • One Year Previous: 7,236,000

=============

Hires: 5,787,000 

Total Separations §: 5,007,000 

=============

The above, yellow-highlighted percentage represents the estimated number of job openings in the United States during the indicated month. The "predicted" figure is what economists were expecting, while the "actual" is the true or real figure.

=============

From Today's Release:

"...These changes in the labor market reflected an ongoing resumption of economic activity that had been curtailed due to the coronavirus (COVID-19) pandemic and efforts to contain it. This release includes estimates of the number and rate of job openings, hires, and separations for the total nonfarm sector, by industry, and by four geographic regions..."

=============

Chart: Total Nonfarm Hires and Separation Rates - July 2020 Update
Chart: Total Nonfarm Hires and Separation Rates

July 2020 Update
 
=============

§ = Here's How The Labor Department Defines Total Separations:

"Total separations includes quits, layoffs and discharges, and other separations. Total separations is referred to as turnover. Quits are generally voluntary separations initiated by the employee. Therefore, the quits rate can serve as a measure of workers’ willingness or ability to leave jobs. Layoffs and discharges are involuntary separations initiated by the employer. Other separations includes separations due to retirement, death, disability, and transfers to other locations of the same firm."

=============

=============

Labels: , , , , , , , , , , ,


--> www.FedPrimeRate.com Privacy Policy <--

>  SITEMAP  <

bing

bing

www.FedPrimeRate.com
Entire Website © 2024 FedPrimeRate.comSM


This website is neither affiliated nor associated with The United States Federal Reserve
in any way. Information in this website is provided for educational purposes only. The owners
of this website make no warranties with respect to any and all content contained within this
website. Consult a financial professional before making important decisions related to any
investment or loan product, including, but not limited to, business loans, personal loans,
education loans, first or second mortgages, credit cards, car loans or any type of insurance.