.comment-link {margin-left:.6em;}

Economy

Economic Data (USA)

Friday, September 30, 2022

Consumer Sentiment: Final Results for September 2022

The University of Michigan's Index of Consumer Sentiment (ICS) - Final Results for September 2022 was released today:

Predicted: 59.0
  • Actual: 58.6
=========

  • Change from Previous Month: +0.687% (+ 0.4 point)
  • Change from 12 Months Previous: -19.505% (-14.2 points)

=========

  • Final ICS Reading for August 2022: 58.2

  • Final ICS Reading for September 2021: 72.8

=========

From today's report:

"...Consumer sentiment confirmed the preliminary reading earlier this month and was essentially unchanged from the month prior, at less than one index point above August. Buying conditions for durables and the one-year economic outlook continued lifting from the extremely low readings earlier in the summer, but these gains were largely offset by modest declines in the long run outlook for business conditions. As seen in the chart, sentiment for consumers across the income distribution has declined in a remarkably close fashion for the last 6 months, reflecting shared concerns over the impact of inflation, even among higher-income consumers who have historically generated the lion's share of spending.

The median expected year-ahead inflation rate declined to 4.7%, the lowest reading since last September. At 2.7%, median long run inflation expectations fell below the 2.9-3.1% range for the first time since July 2021. Inflation expectations are likely to remain relatively unstable in the months ahead, as consumer uncertainty over these expectations remained high and is unlikely to wane in the face of continued global pressures on inflation..."

 =====================


CHART: Index of Consumer Sentiment History - 3 Month Moving Average - September 2022 UPDATE

CHART: Index of Consumer Sentiment History
3 Month Moving Average
September 2022 UPDATE

 =====================


The ICS is derived from the following five survey questions:


  1. "We are interested in how people are getting along financially these days. Would you say that you (and your family living there) are better off or worse off financially than you were a year ago?"


  2. "Now looking ahead, do you think that a year from now you (and your family living there) will be better off financially, or worse off, or just about the same as now?"


  3. "Now turning to business conditions in the country as a whole, do you think that during the next twelve months we'll have good times financially, or bad times, or what?"


  4. "Looking ahead, which would you say is more likely: that in the country as a whole we'll have continuous good times during the next five years or so, or that we will have periods of widespread unemployment or depression, or what?"


  5. "About the big things people buy for their homes, such as furniture, a refrigerator, stove, television, and things like that. Generally speaking, do you think now is a good or bad time for people to buy major household items?"

=========


=========

The ICS uses a 1966 baseline, i.e. for 1966, the ICS = 100. So any number that is below the 1966 baseline of 100 means that the folks who were polled recently aren't as optimistic about the U.S. economy as those polled back in 1966.

The ICS is similar to the Consumer Confidence Index in that they both measure consumer attitudes and offer valuable insight into consumer spending.

=========

The "predicted" figure is what economists were expecting, while the "actual" is the true or real figure.

=========


=========


Labels: , , , , , ,


--> www.FedPrimeRate.com Privacy Policy <--

>  SITEMAP  <

PCE Price Index + Personal Income + Consumer Spending Report for August 2022

The Commerce Department's Bureau of Economic Analysis (BEA) released its report on The PCE Price Index, Consumer Spending and Personal Income for August 2022:

=============

Consumer Spending (Personal Consumption Expenditures)

Predicted: +0.3

  • Actual: +0.4%
  • Actual (2012 Chained* Dollars): +0.1%
=============

Personal Income

Predicted: +0.3
  • Actual: +0.3%
=============

  • Disposable Personal Income, Current Dollars: +0.4%
  • Disposable Personal Income (2012 Chained* Dollars): +0.1%

=============

The above highlighted percentages represent the month-to-month change in Consumer Spending (aka Personal Consumption Expenditures), Personal Income and Disposable Personal Income for the entire United States.

=============

Personal Consumption Expenditures (PCE) Price Index
Predicted: +0.2%
Actual: +0.3% 

  • Change from 12 months previous: +6.2%
=====================

Core PCE Price Index
( = PCE Price Index minus food and energy)
Predicted: 0.5%
Actual: +0.6%

  • Change from 12 months previous: +4.9%
=====================

The yellow-highlighted percentages represent the month-to-month change in the prices associated with domestic personal consumption.  The PCE Price Index is different from the Consumer Price Index (CPI) in that it is a very broad measure of the prices associated with domestic products and services, while the CPI measures a more limited fixed basket of goods and services.

The broad nature of the PCE Price Index is key to why it is the Federal Reserve's preferred measure of inflation.  The Federal Open Market Committee (FOMC) pays very close attention to it.

=====================

The "predicted" figures are what economists were expecting, while the "actual" figures are the true or real figure.


=====================

 =====================

*Chained dollars is a method of adjusting real dollar amounts for inflation over time, so as to allow comparison of figures from different years. The Commerce Department introduced the chained-dollar measure in 1996. Chained dollars generally reflect dollar figures computed with 2012 as the base year.


Labels: , , , , , , , , , , , , ,


--> www.FedPrimeRate.com Privacy Policy <--

>  SITEMAP  <

Thursday, September 29, 2022

New Unemployment Insurance Claims for The Week of September 24, 2022

Jobless Claims
Jobless Claims

Earlier today, the Labor Department released its weekly report on New Jobless Insurance Claims for the week that ended on September 24, 2022:

====================

Predicted: 219,000

  • Actual: 193,000
====================

The yellow-highlighted figure represents the number of first-time claims for unemployment benefits for the entire United States. The "predicted" figure is what economists were expecting, while the "actual" is the true or real figure.

  • Previous Week (revised): 209,000
  • 4-Week Moving Average: 207,000

====================

From Today's Report

"...The highest insured unemployment rates in the week ending September 10 were in New Jersey (1.9), California (1.8), Puerto Rico (1.6), New York (1.5), Alaska (1.2), Massachusetts (1.2), Nevada (1.2), Pennsylvania (1.2), Rhode Island (1.2).


The largest increases in initial claims for the week ending September 17 were in Michigan (+6,102), Georgia (+1,837), New York (+1,709), New Jersey (+1,164), and California (+1,130), while the largest decreases were in Indiana (-1,103), Arkansas (-386), Kentucky (-295), Virginia (-288), and Oklahoma (-264)..."


====================


====================


Labels: , , , , , , , , , , ,


--> www.FedPrimeRate.com Privacy Policy <--

>  SITEMAP  <

Wednesday, September 28, 2022

Crude Oil Inventories Report for Week of September 23, 2022

Crude Oil Inventories


The U.S. Crude Oil Inventories report for the week that ended on September 23, 2022 was released this morning:

-- Change from Last Week: -200,000 Barrels

-- Change from A Year Ago (Y/Y): +12,000,000 Barrels

-- Current U.S. Crude Oil Stocks: 430,600,000 Barrels

Diminishing crude oil inventories often translate to higher crude oil and fuel prices (and vice versa), but not always.

The report is produced by the U.S. Energy Information Administration (EIA).

Labels: , , , , , , , , , ,


--> www.FedPrimeRate.com Privacy Policy <--

>  SITEMAP  <

Tuesday, September 27, 2022

New Home Sales During August 2022

The August 2022 New Home Sales report was released by the Commerce Department this morning:

------------------------------------------------------

Predicted: 550,000
  • Actual New Home Sales: 685,000

------------------------------------------------------

  • Change from One Month Previous: +153,000 units (+28.76%)

  • Change from One Year Previous: -1,000 units (-0.146%)


------------------------------------------------------

Median Price for a New Home
During August 2022: $436,800 
 

***************************

Average Price for a New Home
During August 2022: $521,800

------------------------------------------------------

Inventory: 461,000 (8.1 months supply at current sales rate; seasonally‐adjusted estimate.)

------------------------------------------------------

================================

 
CHART: New Home Sales - August 2022 Update

CHART: New Home Sales
August 2022 Update


================================


================================


Compiled jointly by the U.S. Commerce Department and the U.S. Department of Housing and Urban Development, the yellow-highlighted figure above is the seasonally adjusted and annualized number of newly-built homes with committed buyers for the indicated month.

The "predicted" figure is what economists were expecting, while the "actual" is the true or real figure.

The New Home Sales report is watched by economists and investors because it offers insight into the state of the U.S. housing market, and also provides data that can be used to predict sales of large household furniture and appliances like refrigerators, air conditioners, microwave ovens, etc.


================================

================================


Labels: , , , , , , , ,


--> www.FedPrimeRate.com Privacy Policy <--

>  SITEMAP  <

Consumer Confidence Index (CCI) for September 2022

Consumer Confidence Index® (CCI) for this month (September 2022) was released by The Conference Board® this morning:

================

Predicted: 105.0
  • Actual: 108.0

================

Previous Month (revised): 103.6

  • Change from Previous Month: +4.28% (+4.4 points)
================

The "predicted" figure is what economists were expecting, while the "actual" is the true or real figure.

From Today's Report:

"...The Conference Board Consumer Confidence Index® increased in September for the second consecutive month. The Index now stands at 108.0 (1985=100), up from 103.6 in August. The Present Situation Index -- based on consumers’ assessment of current business and labor market conditions -- rose to 149.6 from 145.3 last month. The Expectations Index -- based on consumers’ short-term outlook for income, business, and labor market conditions -- increased to 80.3 from 75.8.

'Consumer confidence improved in September for the second consecutive month supported in particular by jobs, wages, and declining gas prices,'said Lynn Franco, Senior Director of Economic Indicators at The Conference Board. 'The Present Situation Index rose again, after declining from April through July. The Expectations Index also improved from summer lows, but recession risks nonetheless persist. Concerns about inflation dissipated further in September -- prompted largely by declining prices at the gas pump -- and are now at their lowest level since the start of the year.'

'Meanwhile, purchasing intentions were mixed, with intentions to buy automobiles and big-ticket appliances up, while home purchasing intentions fell. The latter no doubt reflects rising mortgage rates and a cooling housing market. Looking ahead, the improvement in confidence may bode well for consumer spending in the final months of 2022, but inflation and interest-rate hikes remain strong headwinds to growth in the short term.'
..."

Every month, The Conference Board sends a questionnaire to 5,000 U.S. households. Survey participants are polled about their feelings regarding the U.S. economy, current and future, and about their own fiscal circumstances. On average, 3,500 participants complete and return the 5-question survey.

  • The baseline "100" score for the CCI is associated with 1985 survey data.


When consumers feel good about the economy, they tend to do more spending, and vice versa.

Based in New York City, The Conference Board is a private, not-for-profit organization with a mission to, "create and disseminate knowledge about management and the marketplace to help businesses strengthen their performance and better serve society."

The CCI is usually released on the last Tuesday of the month.


================ 

CHART: Consumer Confidence Index (CCI) - September 2022 Update

CHART: Consumer Confidence Index (CCI)
September 2022 Update

================

================


Labels: , , , , , , , , , , , ,


--> www.FedPrimeRate.com Privacy Policy <--

>  SITEMAP  <

Friday, September 23, 2022

Crude Oil Inventories Report for Week of September 16, 2022

Crude Oil Inventories


The U.S. Crude Oil Inventories report for the week that ended on September 16,  2022 was released this morning:

-- Change from Last Week: +1,100,000 Barrels

-- Change from A Year Ago (Y/Y): +16,800,000 Barrels

-- Current U.S. Crude Oil Stocks: 430,800,000 Barrels

Diminishing crude oil inventories often translate to higher crude oil and fuel prices (and vice versa), but not always.

The report is produced by the U.S. Energy Information Administration (EIA).

Labels: , , , , , , , , , ,


--> www.FedPrimeRate.com Privacy Policy <--

>  SITEMAP  <

Thursday, September 22, 2022

New Unemployment Insurance Claims for The Week of September 17, 2022

Jobless Claims
Jobless Claims

Earlier today, the Labor Department released its weekly report on New Jobless Insurance Claims for the week that ended on September 17, 2022:

====================

Predicted: 219,000

  • Actual: 213,000
====================

The yellow-highlighted figure represents the number of first-time claims for unemployment benefits for the entire United States. The "predicted" figure is what economists were expecting, while the "actual" is the true or real figure.

  • Previous Week (revised): 208,000
  • 4-Week Moving Average: 216,750

====================

From Today's Report

"...The highest insured unemployment rates in the week ending September 3 were in New Jersey (2.0), California (1.7), New York (1.6), Puerto Rico (1.6), Rhode Island (1.4), Massachusetts (1.3), Connecticut (1.2), Nevada (1.2), Alaska (1.1), Oregon (1.1), and Pennsylvania (1.1).


The largest increases in initial claims for the week ending September 10 were in Indiana (+738), Arkansas (+217), Iowa (+149), North Dakota (+28), and Maine (+15), while the largest decreases were in California (-3,064), New York (-2,905), Texas (-2,493), Oklahoma (-1,729), and Pennsylvania (-1,355)..."


====================


====================


Labels: , , , , , , , , , , ,


--> www.FedPrimeRate.com Privacy Policy <--

>  SITEMAP  <

Leading Economic Index for August 2022

The Conference Board® released its Leading Economic Index® (LEI) for August 2022 this morning:

==============

Index for August 2022: 116.2 (The baseline 100 score is associated with 2016 data.)

==============

Predicted: -0.3%
  • Actual: -0.258% (-0.3 point)

==============

  • LEI for July 2022: 116.5

  • LEI for June 2022: 117.1

  • LEI for May 2022: 117.9

  • LEI for April 2022: 118.7

  • LEI for March 2022: 119.3

  • LEI for February 2022: 119.4

  • LEI for January 2022: 118.5

==============

The yellow-highlighted percentage is the month-to-month change for the index.  The "predicted" figure is what economists were expecting, while the "actual" is the true or real figure.

The LEI is a composite of 10 of the nation's economic data releases that's put together by The Conference Board. Statistically, the components listed below have shown a significant increase or decrease before national economic upturns or downturns:

  1. The Standard + Poor's 500 Index

  2. Average weekly claims for unemployment insurance

  3. Building permits for new private housing

  4. The interest rate spread between the yield on the benchmark 10-Year Treasury Note and Federal Funds

  5. ISM® Index of New Orders

  6. Manufacturer's new orders for consumer goods or materials

  7. Manufacturers' new orders, non-defense capital goods excluding aircraft orders

  8. Average weekly manufacturing hours

  9. Average consumer expectations for business conditions

  10. Leading Credit Index™

==============


CHART: Leading Economic Index 6-Month Growth Rate with Warning + Recession Signals August 2022 UPDATE
CHART: Leading Economic Index
6-Month Growth Rate
with Warning + Recession Signals
August 2022 UPDATE


==============


CHART: Year-on-Year Change in the Leading Economic Index + Real GDP August 2022 UPDATE
CHART: Year-on-Year Change
in the Leading Economic Index
+ Real GDP
August 2022 UPDATE


==============
 
From Today's Report:

"...'The US LEI declined for a sixth consecutive month potentially signaling a recession,' Ataman Ozyildirim, Senior Director, Economics, at The Conference Board. 'Among the index’s components, only initial unemployment claims and the yield spread contributed positively over the last six months—and the contribution of the yield spread has narrowed recently.'

'Furthermore, labor market strength is expected to continue moderating in the months ahead. Indeed, the average workweek in manufacturing contracted in four of the last six months -- a notable sign, as firms reduce hours before reducing their workforce. Economic activity will continue slowing more broadly throughout the US economy and is likely to contract. A major driver of this slowdown has been the Federal Reserve’s rapid tightening of monetary policy to counter inflationary pressures. The Conference Board projects a recession in the coming quarters.'.
.."

==============
 

Labels: , , , , , , , , , , , ,


--> www.FedPrimeRate.com Privacy Policy <--

>  SITEMAP  <

Consumer Price Index (CPI) for August 2022

Earlier this morning, the Labor Department's Bureau of Labor Statistics released the Consumer Price Index (CPI) for August 2022:


=========================================

CPI During August 2022: 296.171

=========================================


Predicted: -0.1%
Actual: -0.035% (-0.105 point)

  • Change From 12 Months Previous: +8.263% (+22.604 points)

=========================================

The above, yellow-highlighted figures represent month-to-month change (not seasonally adjusted) in prices for a specific group of goods and services that consumers buy, and is, therefore, a very important part of the overall inflation picture for the country.

The "predicted" figure is what economists were expecting, while the "actual" is the true or real figure.

General categories that constitute the CPI are:

  • Healthcare
  • Housing
  • Clothing
  • Communications
  • Education
  • Transportation
  • Food and Beverages
  • Recreation
  • Miscellaneous Goods and Services (grooming expenses, etc.)

=========================================

CPI During August 2021: 273.567

=========================================


=========================================


CHART: Consumer Price Index, 12-Month Percentage Change, August 2022 UPDATE
CHART: Consumer Price Index,
12-Month Percentage Change,
August 2022 UPDATE

=========================================


Labels: , , , , , , , , , , ,


--> www.FedPrimeRate.com Privacy Policy <--

>  SITEMAP  <

Existing Home Sales During August 2022

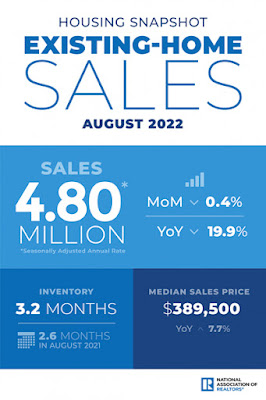
The Existing Home Sales report for August 2022 was released by The National Association of Realtors® (NAR®) this morning:

Predicted: 4,800,000
  • Actual: 4,800,000
==========

  •  Change from Previous Month: -0.415% (-20,000 homes)

  •  Change from A Year Ago: -19.87% (-1,190,000 homes)
==========

Inventory: 1,280,000 (3.2 months supply.)

==========

The yellow-highlighted, "actual" figure above represents the preliminary, seasonally adjusted annualized sales count of existing homes, co-ops and condominiums for the indicated month. The "predicted" figure is what economists were expecting, while the "actual" is the true or real figure.

------------------------------------------------------

  • Median Price: $389,500

  • Price Change from A Year Ago: +7.75% (+$28,000)


------------------------------------------------------ 

==========


==========

From Today's Report:

"...'The housing sector is the most sensitive to and experiences the most immediate impacts from the Federal Reserve's interest rate policy changes,' said NAR Chief Economist Lawrence Yun. 'The softness in home sales reflects this year's escalating mortgage rates. Nonetheless, homeowners are doing well with near nonexistent distressed property sales and home prices still higher than a year ago.'


'Inventory will remain tight in the coming months and even for the next couple of years,' Yun added. 'Some homeowners are unwilling to trade up or trade down after locking in historically-low
mortgage rates in recent years, increasing the need for more new-home construction to boost supply.'


The median existing-home price for all housing types in August was $389,500, a 7.7% jump from August 2021 ($361,500), as prices ascended in all regions. This marks 126 consecutive months of year-over-year increases, the longest-running streak on record. However, it was the second month in a row that the median sales price retracted after reaching a record high of $413,800 in June, the usual seasonal trend of prices declining after peaking in the early summer.


Properties typically remained on the market for 16 days in August, up from 14 days in July and down from 17 days in August 2021. Eighty-one percent of homes sold in August 2022 were on the market for less than a month.
.."

==================


==================
 
INFOGRAPHIC: Existing Home Sales - August 2022 UPDATE
INFOGRAPHIC: Existing Home Sales
August 2022 UPDATE

 
==================


Labels: , , , , , , , , , , , ,


--> www.FedPrimeRate.com Privacy Policy <--

>  SITEMAP  <

Tuesday, September 20, 2022

Housing Starts During August 2022

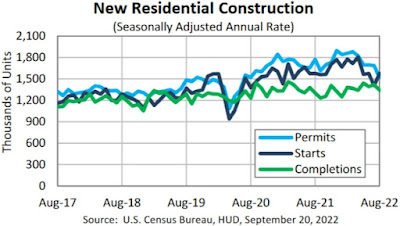
The U.S. Commerce Department this morning released its Housing Starts report for August 2022:

---------------------------------------------------

Housing Starts:
Predicted: 1,600,000
Actual: 1,575,000

Change From Previous Month: +12.18% (+171,000 New Units)

  • Change From One Year Previous: -0.063% (-1,000 New Units)

---------------------------------------------------

Building Permits:
Predicted: 1,600,000
Actual: 1,517,000

Change From Previous Month: -9.97% (-168,000 New Permits)

  • Change From One Year Previous: -14.39%  (-255,000 New Permits)

----------------------------------------------------

Housing Starts: The top, yellow-highlighted figure is a measure of initial construction of single and multi-family residential units in the United States for the indicated month. Seasonally adjusted annual rate. The "predicted" figure is what economists were expecting, while the "actual" is the true or real figure.

If you're wondering about the demand for new homes in the United States, or about the American residential construction industry in general, then you should pay attention to the monthly Housing Starts report. This report also offers insight into specific types of consumer spending: when housing starts are up, demand for the stuff that a consumer would purchase for a new home (large appliances, consumer electronics, furniture, etc.) tends to also rise -- and vice versa.


=================


CHART: Housing Starts + Building Permits + Completions - August 2022 Update
CHART: Housing Starts
+ Building Permits
+ Completions
August 2022 Update


=================


================

Labels: , , , , , , , , , ,


--> www.FedPrimeRate.com Privacy Policy <--

>  SITEMAP  <

Friday, September 09, 2022

New Unemployment Insurance Claims for The Week of September 3, 2022

Jobless Claims
Jobless Claims

Earlier today, the Labor Department released its weekly report on New Jobless Insurance Claims for the week that ended on September 3, 2022:

====================

Predicted: 230,000

  • Actual: 222,000
====================

The yellow-highlighted figure represents the number of first-time claims for unemployment benefits for the entire United States. The "predicted" figure is what economists were expecting, while the "actual" is the true or real figure.

  • Previous Week (revised): 228,000
  • 4-Week Moving Average: 233,000

====================

From Today's Report

"...The highest insured unemployment rates in the week ending August 20 were in New Jersey (2.2), California (1.9), Rhode Island (1.8), Connecticut (1.7), New York (1.7), Puerto Rico (1.7), Massachusetts (1.5), Pennsylvania (1.3), and Nevada (1.2).

The largest increases in initial claims for the week ending August 27 were in New York (+4,630), Michigan (+1,199), South Carolina (+290), Hawaii (+263), and New Jersey (+256), while the largest decreases were in Connecticut (-2,635), Oklahoma (-1,260), Missouri (-1,250), Georgia (-853), and California (-802)..."


====================


====================


Labels: , , , , , , , , , , ,


--> www.FedPrimeRate.com Privacy Policy <--

>  SITEMAP  <

Thursday, September 08, 2022

Crude Oil Inventories Report for Week of September 2, 2022

Crude Oil Inventories


The U.S. Crude Oil Inventories report for the week that ended on September 2,  2022 was released this morning:

-- Change from Last Week: +8,800,000 Barrels

-- Change from A Year Ago (Y/Y): +3,300,000 Barrels

-- Current U.S. Crude Oil Stocks: 427,200,000 Barrels

Diminishing crude oil inventories often translate to higher crude oil and fuel prices (and vice versa), but not always.

The report is produced by the U.S. Energy Information Administration (EIA).

Labels: , , , , , , , , , ,


--> www.FedPrimeRate.com Privacy Policy <--

>  SITEMAP  <

Wednesday, September 07, 2022

Crude Oil Inventories Report for Week of August 26, 2022

Crude Oil Inventories


The U.S. Crude Oil Inventories report for the week that ended on August 26,  2022 was released this morning:

-- Change from Last Week: -3,300,000 Barrels

-- Change from A Year Ago (Y/Y): -7,000,000 Barrels

-- Current U.S. Crude Oil Stocks: 418,300,000 Barrels

Diminishing crude oil inventories often translate to higher crude oil and fuel prices (and vice versa), but not always.

The report is produced by the U.S. Energy Information Administration (EIA).

Labels: , , , , , , , , , ,


--> www.FedPrimeRate.com Privacy Policy <--

>  SITEMAP  <

Friday, September 02, 2022

September 2, 2022 Stock Market Bear | Correction Update

At week's end, the Dow Jones Industrial Average (DJIA) and S&P 500 indexes continued in correction, while the NASDAQ Composite Index remained in the bear market zone.

Since Closing @ Record-Highs:

-- DJIA: -14.89% (-5,481.21 points)

-- NASDAQ Composite: -27.57% (-4,426.58 points)

-- S&P 500: -18.19% (-872.30 points)

==========

DATA:
>> DJIA History <<

DATA:
>> NASDAQ History
<<
 

DATA: >> S & P 500 History <<

==========


CHART: >> http://www.fedprimerate.com/djia-chart-history.htm <<


CHART: >> http://www.fedprimerate.com/s-and-p-500-index-history-chart.htm <<


CHART:
>> http://www.fedprimerate.com/nasdaq-composite-history-chart.htm
<<

 
==========

CHART: NASDAQ Composite Index September 2, 2022 UPDATE

CHART: NASDAQ Composite Index
September 2, 2022 UPDATE


==========

CHART: Dow Jones Industrial Average (DJIA) September 2, 2022 UPDATE

CHART:
Dow Jones Industrial Average (DJIA)
September 2, 2022 UPDATE

==========

Labels: , , , , , , , , , , , ,


--> www.FedPrimeRate.com Privacy Policy <--

>  SITEMAP  <

bing

bing

www.FedPrimeRate.com
Entire Website © 2024 FedPrimeRate.comSM


This website is neither affiliated nor associated with The United States Federal Reserve
in any way. Information in this website is provided for educational purposes only. The owners
of this website make no warranties with respect to any and all content contained within this
website. Consult a financial professional before making important decisions related to any
investment or loan product, including, but not limited to, business loans, personal loans,
education loans, first or second mortgages, credit cards, car loans or any type of insurance.