.comment-link {margin-left:.6em;}

Economy

Economic Data (USA)

Friday, June 30, 2023

PCE Price Index + Personal Income + Consumer Spending Report for May 2023

The Commerce Department's Bureau of Economic Analysis (BEA) released its report on The PCE Price Index, Consumer Spending and Personal Income for May 2023:

=============

Consumer Spending (Personal Consumption Expenditures)

Predicted: +0.1%
  • Actual: +0.1%
  • Actual: (2012 Chained* Dollars): FLAT
=============

Personal Income

Predicted: +0.4
  • Actual: +0.4%
=============

  • Disposable Personal Income, Current Dollars: +0.4%
  • Disposable Personal Income (2012 Chained* Dollars): +0.3%

=============

The above highlighted percentages represent the month-to-month change in Consumer Spending (aka Personal Consumption Expenditures), Personal Income and Disposable Personal Income for the entire United States.

=============

Personal Consumption Expenditures (PCE) Price Index
Predicted: +0.1%
Actual: +0.1% 

  • Change from 12 months previous: +3.8%
=====================

Core PCE Price Index
( = PCE Price Index minus food and energy)
Predicted: 0.3%
Actual: +0.3%

  • Change from 12 months previous: +4.6%
=====================

The yellow-highlighted percentages represent the month-to-month change in the prices associated with domestic personal consumption.  The PCE Price Index is different from the Consumer Price Index (CPI) in that it is a very broad measure of the prices associated with domestic products and services, while the CPI measures a more limited fixed basket of goods and services.

The broad nature of the PCE Price Index is key to why it is the Federal Reserve's preferred measure of inflation.  The Federal Open Market Committee (FOMC) pays very close attention to it.

=====================

The "predicted" figures are what economists were expecting, while the "actual" figures are the true or real figure.


=====================

 =====================

*Chained dollars is a method of adjusting real dollar amounts for inflation over time, so as to allow comparison of figures from different years. The Commerce Department introduced the chained-dollar measure in 1996. Chained dollars generally reflect dollar figures computed with 2012 as the base year.

Labels: , , , , , , , , , , , ,


--> www.FedPrimeRate.com Privacy Policy <--

>  SITEMAP  <

Thursday, June 29, 2023

New Unemployment Insurance Claims for The Week of June 24, 2023

Jobless Claims
Jobless Claims

Earlier today, the Labor Department released its weekly report on New Jobless Insurance Claims for the week that ended on June 24, 2023:

====================

Predicted: 270,000

  • Actual: 239,000
====================

The yellow-highlighted figure represents the number of first-time claims for unemployment benefits for the entire United States. The "predicted" figure is what economists were expecting, while the "actual" is the true or real figure.

  • Previous Week (revised): 265,000
  • 4-Week Moving Average: 257,500

====================

 From Today's Report

"...The 4-week moving average was 257,500, an increase of 1,500 from the previous week's revised average. This is the highest level for this average since November 13, 2021 when it was 260,000..."

 ====================

Labels: , , , , , , , , ,


--> www.FedPrimeRate.com Privacy Policy <--

>  SITEMAP  <

Wednesday, June 28, 2023

New Home Sales During May 2023

The May 2023 New Home Sales report was released by the Commerce Department this morning:

------------------------------------------------------

Predicted: 700,000
  • Actual New Home Sales: 763,000

------------------------------------------------------

  • Change from One Month Previous: +83,000 units (+12.206%)

  • Change from One Year Previous: +127,000 units (+19.97%)


------------------------------------------------------

Median Price for a New Home
During May 2023: $416,300 
 

***************************

Average Price for a New Home
During May 2023: $487,300

------------------------------------------------------

Inventory: 428,000 (6.7 months supply at current sales rate; seasonally‐adjusted estimate.)

------------------------------------------------------

================================

 CHART: New Home Sales - May 2023 Update
CHART: New Home Sales
May 2023 Update

================================


================================


Compiled jointly by the U.S. Commerce Department and the U.S. Department of Housing and Urban Development, the yellow-highlighted figure above is the seasonally adjusted and annualized number of newly-built homes with committed buyers for the indicated month.

The "predicted" figure is what economists were expecting, while the "actual" is the true or real figure.

The New Home Sales report is watched by economists and investors because it offers insight into the state of the U.S. housing market, and also provides data that can be used to predict sales of large household furniture and appliances like refrigerators, air conditioners, microwave ovens, etc.


================================

================================

Labels: , , , , , , , ,


--> www.FedPrimeRate.com Privacy Policy <--

>  SITEMAP  <

Consumer Confidence Index (CCI) for June 2023

Consumer Confidence Index® (CCI) for this month (June) was released by The Conference Board® this morning:

================

Predicted: 105.0
  • Actual: 109.7

================

Previous Month (revised): 102.5

  • Change from Previous Month: +7.02% (+7.2 points)
================

The "predicted" figure is what economists were expecting, while the "actual" is the true or real figure.

From Today's Report:

"...'Consumer confidence improved in June to its highest level since January 2022, reflecting improved current conditions and a pop in expectations,' said Dana Peterson, Chief Economist at The Conference Board. 'Greater confidence was most evident among consumers under age 35, and consumers earning incomes over $35,000. Nonetheless, the expectations gauge continued to signal consumers anticipating a recession at some point over the next 6 to 12 months.'

'Assessments of the present situation rose in June on sunnier views of both business and employment conditions. Indeed, the spread between consumers saying jobs are ‘plentiful’ versus ‘not so plentiful’ widened, indicating upbeat feelings about a labor market that continues to outperform. Likewise, expectations for the next six months improved materially, reflecting greater confidence about future business conditions and job availability.'

'While income expectations ticked down slightly in June, new questions included in this month’s release found a notably brighter outlook for consumers’ family finances: Around 30 percent expect their family’s financial situation to be ‘better’ in the next six months, compared to less than 14 percent expecting it to be ‘worse.’ This might reflect consumers’ belief that labor market conditions will remain favorable and that there will be further declines in inflation ahead. Indeed, the 12-month forward inflation expectations gauge fell to 6 percent in June, the lowest reading since December 2020.'

 'Although the Expectations Index remained a hair below the threshold signaling recession ahead, a new measure found considerably fewer consumers now expect a recession in the next 12 months compared to May. Meanwhile, on a six-month moving average basis, plans to purchase autos and homes have slowed, after picking up earlier in 2023. This may reflect rising costs to finance big-ticket items as the Fed continues to raise interest rates. Meanwhile, vacation plans within the next six months continued to flag, led largely by declines in plans to travel domestically. This is an important indicator of desires to spend on services ahead, which may be a signal that post-pandemic ‘revenge spending’ on travel may have peaked and is likely to slow over the rest of this year.'..."

Every month, The Conference Board sends a questionnaire to 5,000 U.S. households. Survey participants are polled about their feelings regarding the U.S. economy, current and future, and about their own fiscal circumstances. On average, 3,500 participants complete and return the 5-question survey.

  • The baseline "100" score for the CCI is associated with 1985 survey data.


When consumers feel good about the economy, they tend to do more spending, and vice versa.

Based in New York City, The Conference Board is a private, not-for-profit organization with a mission to, "create and disseminate knowledge about management and the marketplace to help businesses strengthen their performance and better serve society."

The CCI is usually released on the last Tuesday of the month.

================   

CHART: Consumer Confidence Index (CCI)  - June 2023 Update
CHART: Consumer Confidence Index (CCI)
 June 2023 Update

================

Labels: , , , , , , , , , , , , ,


--> www.FedPrimeRate.com Privacy Policy <--

>  SITEMAP  <

Friday, June 23, 2023

Leading Economic Index for May 2023

The Conference Board® released its Leading Economic Index® (LEI) for May 2023 this morning:

==============

Index for May 2023: 106.7 (The baseline 100 score is associated with 2016 data.)

==============

Predicted: -0.7%
  • Actual: -0.744% (-0.8 point)

==============

  • LEI for April 2023: 107.5

  • LEI for March 2023: 108.2

  • LEI for February 2023: 109.5

  • LEI for January 2023: 110.2

  • LEI for December 2022: 110.7

  • LEI for November 2022: 111.5

  • LEI for October 2022: 112.5

  • LEI for September 2022: 113.5

  • LEI for August 2022: 116.4

  • LEI for July 2022: 116.4

  • LEI for June 2022: 117.1

  • LEI for May 2022: 117.9

  • LEI for April 2022: 118.7

  • LEI for March 2022: 119.3

  • LEI for February 2022: 119.4

  • LEI for January 2022: 118.5

==============

The yellow-highlighted percentage is the month-to-month change for the index.  The "predicted" figure is what economists were expecting, while the "actual" is the true or real figure.

The LEI is a composite of 10 of the nation's economic data releases that's put together by The Conference Board. Statistically, the components listed below have shown a significant increase or decrease before national economic upturns or downturns:

  1. The Standard + Poor's 500 Index

  2. Average weekly claims for unemployment insurance

  3. Building permits for new private housing

  4. The interest rate spread between the yield on the benchmark 10-Year Treasury Note and Federal Funds

  5. ISM® Index of New Orders

  6. Manufacturer's new orders for consumer goods or materials

  7. Manufacturers' new orders, non-defense capital goods excluding aircraft orders

  8. Average weekly manufacturing hours

  9. Average consumer expectations for business conditions

  10. Leading Credit Index™

==============
 
CHART: Leading Economic Index 6-Month Growth Rate with Warning + Recession Signals - May 2023 UPDATE
CHART: Leading Economic Index
6-Month Growth Rate
with Warning + Recession Signals
May 2023 UPDATE
 

==============
 
From Today's Report:

"...'The US LEI continued to fall in May as a result of deterioration in the gauges of consumer expectations for business conditions, ISM® New Orders Index, a negative yield spread, and worsening credit conditions,' said Justyna Zabinska-La Monica, Senior Manager, Business Cycle Indicators, at The Conference Board. 'The US Leading Index has declined in each of the last fourteen months and continues to point to weaker economic activity ahead. Rising interest rates paired with persistent inflation will continue to further dampen economic activity.

While we revised our Q2 GDP forecast from negative to slight growth, we project that the US economy will contract over the Q3 2023 to Q1 2024 period. The recession likely will be due to continued tightness in monetary policy and lower government spending.'..
."

==============
 

Labels: , , , , , , , , , ,


--> www.FedPrimeRate.com Privacy Policy <--

>  SITEMAP  <

Friday, June 16, 2023

Import and Export Price Indexes for May 2023

The Labor Department's Bureau of Labor Statistics this morning released its report on U.S. Import and Export Price Indexes for May 2023:

===============

Import Prices
Previous Reading:+0.3% (revised)
Actual: -0.6%

Change From 12 Months Previous: -5.9%

===============

Export Prices
Previous Reading: -0.1% (revised)
Actual: -1.9%

Change From 12 Months Previous: -10.1%

===============
 
The above percentages, highlighted in yellow, represent the month-to-month change in prices for:

  • Imports: the cost of goods produced in other countries and sold in the United States.
  • Exports: the cost of goods produced in the USA and sold in other countries.


Together, these indexes offer insight into the status of inflation in the United States, and for the global economy as well. The "predicted" figure is what economists were expecting, while the "actual" is the true or real figure.

=================

 CHART: Import Price Index - May 2023 Update

CHART: Import Price Index
 May 2023 Update

================= 

CHART: Export Price Index - May 2023 Update

CHART: Export Price Index
 May 2023 Update

===
============


===============

Labels: , , , , , , ,


--> www.FedPrimeRate.com Privacy Policy <--

>  SITEMAP  <

Wednesday, June 14, 2023

Producer Price Index - Final Demand (PPI-FD) for May 2023

The Producer Price Index - Final Demand (PPI-FD) for May 2023 was released this morning:

Previous Month: +0.2%
Actual: -0.3%

Change from 12 months previous:  +1.1%

=============

Below is the PPI-FD when food, energy and trade services are removed:

Previous Month: +0.1% (revised)
Actual: FLAT

Change from 12 months previous:  +2.8%

=============

The above, yellow-highlighted percentages represent the month-to-month change in prices received by domestic producers of goods and services, for goods, services and construction in the United States, for final demand.

Final Demand = personal consumption (consumers), exports, government purchases and capital investment.

The PPI-FD is released by the Labor Department's Bureau of Labor Statistics.

The "predicted" figure is what economists were expecting, while the "actual" is the true or real figure.


 ==============

 CHART: Producer Price Index   Final Demand (PPI-FD) 12-Month Percent Change - May 2023 Update

CHART: Producer Price Index
  Final Demand (PPI-FD)
12-Month Percent Change
May 2023 Update

Labels: , , , , , , ,


--> www.FedPrimeRate.com Privacy Policy <--

>  SITEMAP  <

Tuesday, June 13, 2023

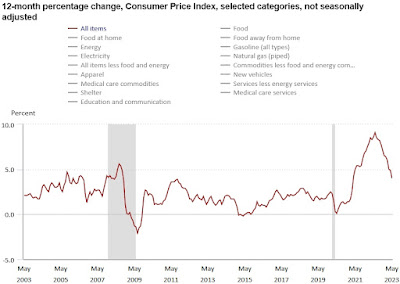
Consumer Price Index (CPI) for May 2023

Earlier this morning, the Labor Department's Bureau of Labor Statistics released the Consumer Price Index (CPI) for May 2023:


=========================================

CPI During May 2023: 304.127

=========================================

Consumer Price Index, Headline

Predicted: +0.5%
Actual: +0.252% (+0.764 point)

  • Change From 12 Months Ago: +4.048% (+11.831 points)


=========================================

Consumer Price Index, Minus Food and Energy (Core CPI)

Predicted: +0.5%
Actual: +0.39% (+1.197 points)

Change From 12 Months Ago: +5.33% (+15.59 points)


=========================================

The above, yellow-highlighted figures represent month-to-month change (not seasonally adjusted) in prices for a specific group of goods and services that consumers buy, and is, therefore, a very important part of the overall inflation picture for the country.

The "predicted" figure is what economists were expecting, while the "actual" is the true or real figure.

General categories that constitute the CPI are:

  • Healthcare
  • Housing
  • Clothing
  • Communications
  • Education
  • Transportation
  • Food and Beverages
  • Recreation
  • Miscellaneous Goods and Services (grooming expenses, etc.)

=========================================

CPI During  May 2022: 292.296

=========================================

 CHART: Consumer Price Index 12-Month Percentage Change - May 2023 Update

CHART: Consumer Price Index
12-Month Percentage Change
 May 2023 Update

=========================================


=========================================


Labels: , , , , , , , , , ,


--> www.FedPrimeRate.com Privacy Policy <--

>  SITEMAP  <

Thursday, June 08, 2023

New Unemployment Insurance Claims for The Week of June 3, 2023

Jobless Claims
Jobless Claims

Earlier today, the Labor Department released its weekly report on New Jobless Insurance Claims for the week that ended on June 3, 2023:

====================

Predicted: 250,000

  • Actual: 261,000
====================

The yellow-highlighted figure represents the number of first-time claims for unemployment benefits for the entire United States. The "predicted" figure is what economists were expecting, while the "actual" is the true or real figure.

  • Previous Week (revised): 233,000
  • 4-Week Moving Average: 237,250

====================

 From Today's Report

"...[261,000] is the highest level for initial claims since October 30, 2021 when it was 264,000..."

 ====================

Labels: , , , , , , ,


--> www.FedPrimeRate.com Privacy Policy <--

>  SITEMAP  <

Monday, June 05, 2023

ISM Non-Manufacturing Index (NMI®) for May 2023

Earlier today, the Institute for Supply Management (ISM®) released their Non-Manufacturing Index (NMI®) for May 2023:

==========

Predicted: 51.0%
  • Actual: 50.3%  (-1.6 points month-on-month change)

==========

Previous month (revised): 51.9%

==========

The NMI is a reliable barometer of the U.S. services sector; above 50% implies expansion, while a reading below 50% implies that the services sector contracted.

Service Categories Include: Agriculture, Forestry, Fishing + Hunting; Mining; Utilities; Construction; Wholesale Trade; Retail Trade; Transportation + Warehousing; Information; Finance + Insurance; Real Estate, Rental + Leasing; Professional, Scientific + Technical Services; Management of Companies + Support Services; Educational Services; Health Care + Social Assistance; Arts, Entertainment + Recreation; Accommodation + Food Services; Public Administration; and Other Services (services such as Equipment + Machinery Repairing; Promoting or Administering Religious Activities; Grantmaking; Advocacy; and Providing Dry-Cleaning + Laundry Services, Personal Care Services, Death Care Services, Pet Care Services, Photofinishing Services, Temporary Parking Services, and Dating Services).

==========

From today' report:

"...Economic activity in the services sector expanded in May for the fifth consecutive month as the Services PMI® registered 50.3 percent, say the nation's purchasing and supply executives in the latest Services ISM® Report On Business®. The sector has grown in 35 of the last 36 months, with the lone contraction in December of last year..."
===========

Here's A Sampling Of Comments
Made By Survey Participants:


  • "...'Restaurant sales continue to track positive year over year, up an average of 8% past month. Employment needs have leveled off, and we are in a position to evaluate and upgrade rather than just maintain. Supply chain pressures have eased overall with some categories still hot spots. We are in a position to continue investing in technology upgrades and restaurant remodels.'
    [Accommodation & Food Services]

  • 'Overall slowing growth and market conditions dragging on some construction sectors.'
    [Construction]

  • 'As a higher-education institute, enrollment will have a major impact on our institution. Factors to consider will be the economy (state and national), as well as continued funding for education. Our enrollment is currently projected to drop 2.5%, which will have a negative effect on our budget.'
    [Educational Services]

  • 'Pent-up demand for services is driving strong revenue performance, but expenses (labor and supplies) continue to put pressure on margins, hindering the financial forecast. There is modest improvement in financial metrics, but it is becoming clear we will have to find ways to do more with less. Supply chains are stabilizing, though some segments remain choppy. The overall outlook, however, suggests the forecast is good for the next quarter. Pent-up demand for services is also causing capacity constraints, but we appear to be managing appropriately at this time.'
    [Health Care & Social Assistance]

  • 'Electronic components supply is strong, and lead times are nearly back to pre-pandemic.'
    [Information]

  • 'Economy is slowing amid increased financial banking and leasing activity. Credit standards have increased, and approvals have fallen -- thus, a tight credit situation.'
    [Management of Companies & Support Services]

  • 'Everything seems to have leveled off: not getting any worse, not getting any better.'
    [Professional, Scientific & Technical Services]

  • 'Lead times are starting to shorten, due in part to greater transportation availability. Prices, in general, are continuing to increase but at a slower pace. Supply chain is becoming much more reliable.'
    [Public Administration]

  • 'Overall business is good, and there has not been a significant change in direction.'
    [Retail Trade]

  • 'Business has significantly increased, with more orders, newer customers and more activity in general. More end users are getting back to business as usual, fighting for lower prices and taking a few more days to pay. The leverage point seems to have shifted back to end users, which is healthy.'
    [Transportation & Warehousing]

  • 'Business conditions continue to remain elevated as CapEx (capital expenditures) spending in clean energy follows regulatory demands.'
    [Utilities]

  • 'Supply is plentiful, freight is moving quickly and costs are coming down. This is a 180-degree change from a year ago. Also, sales demand is down.'
    [Wholesale Trade]..."

===========


==========

CHART: ISM Non-Manufacturing (Services) Index (NMI®) - May 2023 Update

CHART: ISM Non-Manufacturing (Services) Index
(NMI®) May 2023 Update

==========
 

Labels: , , , , , ,


--> www.FedPrimeRate.com Privacy Policy <--

>  SITEMAP  <

Friday, June 02, 2023

Employment Situation Report for May 2023

Employment Situation Report for May 2023 was released by The Department of Labor's Bureau of Labor Statistics this morning:

Nonfarm Payrolls (month-to-month change)
Actual: +339,000
Previous Month (Revised): 294,000
One Year Previous: 364,000

U-3 Unemployment Rate (Headline)
Actual: 3.7%
Previous Month: 3.4%
12 Months Previous: 3.6%

U-6 Unemployment Rate*
Actual: 6.7%
Previous Month: 6.6%
12 Months Previous: 7.1%

Average Hourly Earnings (month-to-month change)
Predicted: +0.3%
Actual: +0.33% (+$0.11)

Average Hourly Earnings (year-on-year change)
Predicted: +3.5%
Actual: +4.304% (+$1.38)

Average Weekly Earnings (month-to-month change)
Actual: +0.038% (+$0.44)


Average Weekly Earnings (year-on-year change)
Actual: +3.4% (+$37.71)

Civilian Labor Force Participation Rate: 62.6%
Previous Month: 62.6%
12 Months Previous: 62.3%

Average Workweek
Predicted: 34.4 hours
Actual: 34.3 hours

Economist, academics, central bankers and investors pay very close attention to the monthly Employment Situation report as it offers penetrating insight as to the current and near-future state of the overall U.S. economy. If a) Americans are earning more money and b) the economy is creating new jobs, this typically translates to more money being pumped into the economy (and vice versa.)

The "predicted" figure is what economists were expecting, while the "actual" is the true or real figure.


===================

CHART: U-3 (Official) Unemployment Rate - May 2023 Update

CHART: U-3 (Official) Unemployment Rate
May 2023 Update


   ===================

 * =  The U-6 Unemployment Rate is defined as:

"Total unemployed, plus all persons marginally attached to the labor force, plus total employed part time for economic reasons, as a percent of the civilian labor force plus all persons marginally attached to the labor force."

===================


=================== 


Labels: , , , , , , , , , , , , , , , ,


--> www.FedPrimeRate.com Privacy Policy <--

>  SITEMAP  <

bing

bing

www.FedPrimeRate.com
Entire Website © 2024 FedPrimeRate.comSM


This website is neither affiliated nor associated with The United States Federal Reserve
in any way. Information in this website is provided for educational purposes only. The owners
of this website make no warranties with respect to any and all content contained within this
website. Consult a financial professional before making important decisions related to any
investment or loan product, including, but not limited to, business loans, personal loans,
education loans, first or second mortgages, credit cards, car loans or any type of insurance.