.comment-link {margin-left:.6em;}

Economy

Economic Data (USA)

Tuesday, July 26, 2022

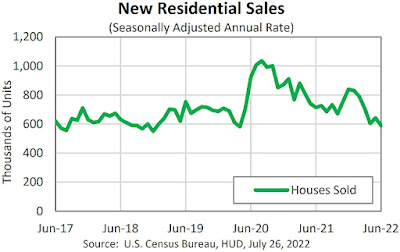
New Home Sales During June 2022

The June 2022 New Home Sales report was released by the Commerce Department this morning:

------------------------------------------------------

Predicted: 650,000
  • Actual New Home Sales: 590,000

------------------------------------------------------

  • Change from One Month Previous: -52,000 units (-8.1%)

  • Change from One Year Previous: -124,000 units (-17.37%)


------------------------------------------------------

Median Price for a New Home
During June 2022: $402,400 
 

***************************

Average Price for a New Home
During June 2022: $456,800

------------------------------------------------------

Inventory: 457,000 (9.3 months supply at current sales rate; seasonally‐adjusted estimate.)

------------------------------------------------------

================================

 
CHART: New Home Sales - June 2022 Update

CHART: New Home Sales - June 2022 Update
 

================================


================================


Compiled jointly by the U.S. Commerce Department and the U.S. Department of Housing and Urban Development, the yellow-highlighted figure above is the seasonally adjusted and annualized number of newly-built homes with committed buyers for the indicated month.

The "predicted" figure is what economists were expecting, while the "actual" is the true or real figure.

The New Home Sales report is watched by economists and investors because it offers insight into the state of the U.S. housing market, and also provides data that can be used to predict sales of large household furniture and appliances like refrigerators, air conditioners, microwave ovens, etc.


================================

================================


Labels: , , , , , , , ,


--> www.FedPrimeRate.com Privacy Policy <--

>  SITEMAP  <

Monday, July 25, 2022

Chicago Fed National Activity Index (CFNAI) for June 2022

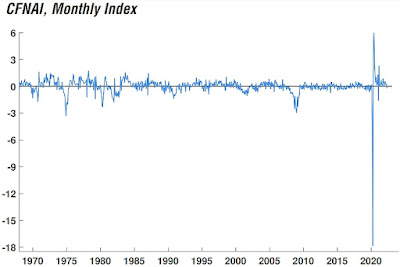
The Federal Reserve Bank of Chicago released its National Activity Index (CFNAI) for June 2022:

==================

Predicted: -0.20
  • Actual (CFNAI): -0.19

==================

  • Previous Month (revised): -0.19
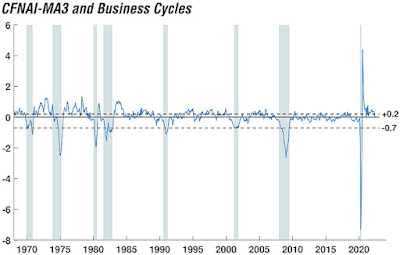
  • 3-Month Moving Average (CFNAI-MA3): -0.04
==================

The CFNAI is a weighted average of 85 indicators of growth in national economic activity drawn from four broad categories of data:

  • Production and income;
  • Employment, unemployment, and hours;
  • Personal consumption and housing; and
  • Sales, orders, and inventories.

The "predicted" figure is what economists were expecting, while the yellow-highlighted figure is what was reported.

==================


CHART: Chicago Fed National Activity Monthly Index - June 2022 Update

CHART: Chicago Fed National Activity Monthly Index
June 2022 Update

  ==================


CHART: CFNAI-MA3 with Business Cycles - June 2022 Update

CHART: CFNAI-MA3 with Business Cycles
June 2022 Update

====================


Understanding The CFNAI:

A zero value for the monthly index has been associated with the national economy expanding at its historical trend (average) rate of growth; negative values with below-average growth (in standard deviation units); and positive values with above-average growth.

Periods of economic expansion have historically been associated with values of the CFNAI-MA3 above -0.70 and the CFNAI Diffusion Index above -0.35. Conversely, periods of economic contraction have historically been associated with values of the CFNAI-MA3 below -0.70 and the CFNAI Diffusion Index below -0.35.

An increasing likelihood of a period of sustained increasing inflation has historically been associated with values of the CFNAI-MA3 above +0.70 more than two years into an economic expansion. Similarly, a substantial likelihood of a period of sustained increasing inflation has historically been associated with values of the CFNAI-MA3 above +1.00 more than two years into an economic expansion.

==================


==================


Labels: , , , , , , , , , , , , , , , , ,


--> www.FedPrimeRate.com Privacy Policy <--

>  SITEMAP  <

Saturday, July 23, 2022

July 22, 2022 Stock Market Bear | Correction Update

At week's end, the Dow Jones Industrial Average (DJIA) and S&P 500 indexes were still mired in correction, while the NASDAQ Composite Index languished in bear territory.

Since Closing @ Record-Highs:

-- DJIA: -13.316% (-4,900.36 points)

-- NASDAQ Composite: -26.301% (-4,223.33 points)

-- S&P 500: -17.41% (-834.93 points)

==========

DATA:
>> DJIA History <<

DATA:
>> NASDAQ History
<<
 

DATA: >> S & P 500 History <<

==========


CHART: >> http://www.fedprimerate.com/djia-chart-history.htm <<


CHART: >> http://www.fedprimerate.com/s-and-p-500-index-history-chart.htm <<


CHART:
>> http://www.fedprimerate.com/nasdaq-composite-history-chart.htm
<<

 
==========

CHART: NASDAQ Composite Index - July 22, 2022 UPDATE

CHART: NASDAQ Composite Index
July 22, 2022 UPDATE


==========


Labels: , , , , , , , , , , , ,


--> www.FedPrimeRate.com Privacy Policy <--

>  SITEMAP  <

Friday, July 22, 2022

Leading Economic Index for June 2022

The Conference BoardÂŽ released its Leading Economic IndexÂŽ (LEI) for June 2022 this morning:

==============

Index for June 2022: 117.1 (The baseline 100 score is associated with 2016 data.)

==============

Predicted: -0.5%
  • Actual: -0.763% (-0.9 point)

==============

  • LEI for May 2022: 118.0

  • LEI for April 2022: 118.7

  • LEI for March 2022: 119.3

  • LEI for February 2022: 119.4

  • LEI for January 2022: 118.5

  • LEI for December 2021: 119.3

==============

The yellow-highlighted percentage is the month-to-month change for the index.  The "predicted" figure is what economists were expecting, while the "actual" is the true or real figure.

The LEI is a composite of 10 of the nation's economic data releases that's put together by The Conference Board. Statistically, the components listed below have shown a significant increase or decrease before national economic upturns or downturns:

  1. The Standard + Poor's 500 Index

  2. Average weekly claims for unemployment insurance

  3. Building permits for new private housing

  4. The interest rate spread between the yield on the benchmark 10-Year Treasury Note and Federal Funds

  5. ISMÂŽ Index of New Orders

  6. Manufacturer's new orders for consumer goods or materials

  7. Manufacturers' new orders, non-defense capital goods excluding aircraft orders

  8. Average weekly manufacturing hours

  9. Average consumer expectations for business conditions

  10. Leading Credit Index™

==============


CHART: Year-on-Year Change in the Leading Economic Index + Real GDP - June 2022 UPDATE

CHART: Year-on-Year Change in the Leading Economic Index
+ Real GDP
June 2022 UPDATE


  ==============
 
From Today's Report:

"...'The US LEI declined for a fourth consecutive month suggesting economic growth is likely to slow further in the near-term as recession risks grow,' said Ataman Ozyildirim, Senior Director of Economic Research at The Conference Board. 'Consumer pessimism about future business conditions, moderating labor market conditions, falling stock prices and weaker manufacturing new orders drove the LEI’s decline in June. The coincident economic index which rose in June suggests the economy grew through the second quarter. However, the forward-looking LEI points to a US economic downturn ahead.'

'Amid high
inflation and rapidly tightening monetary policy, The Conference Board expects economic growth will continue to cool throughout 2022. A US recession around the end of this year and early next is now likely. Accordingly, we’ve downgraded our forecast of 2022 annual Real GDP growth to 1.7% year-over-year (from 2.3 percent), while 2023 growth was downgraded to 0.5% YOY (from 1.8%).'..."

==============
 

Labels: , , , , , , , ,


--> www.FedPrimeRate.com Privacy Policy <--

>  SITEMAP  <

Thursday, July 21, 2022

New Unemployment Insurance Claims for The Week of July 16, 2022

Jobless Claims
Jobless Claims

Earlier today, the Labor Department released its weekly report on New Jobless Insurance Claims for the week that ended on July 16, 2022:

====================

Predicted: 250,000

  • Actual: 251,000
====================

The yellow-highlighted figure represents the number of first-time claims for unemployment benefits for the entire United States. The "predicted" figure is what economists were expecting, while the "actual" is the true or real figure.

  • Previous Week (unrevised): 244,000
  • 4-Week Moving Average: 240,500

====================

From Today's Report

"...The highest insured unemployment rates in the week ending July 2 were in Puerto Rico (2.1), New Jersey (1.9), California (1.7), Rhode Island (1.7), New York (1.5), Pennsylvania (1.5), Massachusetts (1.4), Connecticut (1.3), Alaska (1.2), and Illinois (1.2).

The largest increases in initial claims for the week ending July 9 were in New York (+10,051), Kentucky (+3,061), Arizona (+2,447), Ohio (+2,274), and Indiana (+2,234), while the largest decreases were in California (-3,801), New Jersey (-3,332), Georgia (-1,859), Mississippi (-678), and Rhode Island (-484)..."


====================


====================


Labels: , , , , , , , , , , ,


--> www.FedPrimeRate.com Privacy Policy <--

>  SITEMAP  <

Wednesday, July 20, 2022

Crude Oil Inventories Report for Week of July 15, 2022

Crude Oil Inventories


The U.S. Crude Oil Inventories report for the week that ended on July 15, 2022 was released this morning:

-- Change from Last Week: -400,000 Barrels

-- Change from A Year Ago (Y/Y): -13,100,000 Barrels

-- Current U.S. Crude Oil Stocks: 426,600,000 Barrels

Diminishing crude oil inventories often translate to higher crude oil and fuel prices (and vice versa), but not always.

The report is produced by the U.S. Energy Information Administration (EIA).


Labels: , , , , , , , , , ,


--> www.FedPrimeRate.com Privacy Policy <--

>  SITEMAP  <

Existing Home Sales During June 2022

The Existing Home Sales report for June 2022 was released by The National Association of RealtorsÂŽ (NARÂŽ) this morning:

Predicted: 5,400,000
  • Actual: 5,120,000
==========

  •  Change from Previous Month: -5.36% (-29,000 homes)

  •  Change from A Year Ago: -14.24% (-85,000 homes)
==========

Inventory: 1,260,000 (3.0 months supply; +20.0% year-on-year.)

==========

The yellow-highlighted, "actual" figure above represents the preliminary, seasonally adjusted annualized sales count of existing homes, co-ops and condominiums for the indicated month. The "predicted" figure is what economists were expecting, while the "actual" is the true or real figure.

------------------------------------------------------

  • Median Price: $416,000 (New Record-High)

  • Price Change from A Year Ago: +13.38% (+$49,100)


------------------------------------------------------ 

==========


==========

From Today's Report:

"...'Falling housing affordability continues to take a toll on potential home buyers,' said NAR Chief Economist Lawrence Yun. 'Both mortgage rates and home prices have risen too sharply in a short span of time.'

'Finally, there are more homes on the market,' Yun added. 'Interestingly though, the record-low pace of days on market implies a fuzzier picture on home prices. Homes priced right are selling very quickly, but homes priced too high are deterring prospective buyers.'

First-time buyers were responsible for 30% of sales in June, up from 27% in May and down from 31% in June 2021. NAR's 2021 Profile of Home Buyers and Sellers reported that the annual share of first-time buyers was 34%.

All-cash sales accounted for 25% of transactions in June, the same share as in May and up from 23% in June 2021.

Distressed sales --
foreclosures and short sales -- represented less than 1% of sales in June, essentially unchanged from May 2022 and June 2021.

'If consumer price inflation continues to rise, then mortgage rates will move higher,' Yun said. 'Rates will stabilize only when signs of peak inflation appear. If inflation is contained, then
mortgage rates may even decline somewhat.'..."

==================


==================
 
INFOGRAPHIC: Existing Home Sales - June 2022 UPDATE

INFOGRAPHIC: Existing Home Sales
June 2022 UPDATE


==================


Labels: , , , , , , , , , , ,


--> www.FedPrimeRate.com Privacy Policy <--

>  SITEMAP  <

Tuesday, July 19, 2022

Housing Starts During June 2022

The U.S. Commerce Department this morning released its Housing Starts report for June 2022:

---------------------------------------------------

Housing Starts:
Predicted: 1,600,000
Actual: 1,559,000

Change From Previous Month: -2.011% (-32,000 New Units)

  • Change From One Year Previous: -6.31% (-105,000 New Units)

---------------------------------------------------

Building Permits:
Predicted: 1,700,000
Actual: 1,685,000

Change From Previous Month: -0.59% (-10,000 New Permits)

  • Change From One Year Previous: +1.44%  (+24,000 New Permits)

----------------------------------------------------

Housing Starts: The top, yellow-highlighted figure is a measure of initial construction of single and multi-family residential units in the United States for the indicated month. Seasonally adjusted annual rate. The "predicted" figure is what economists were expecting, while the "actual" is the true or real figure.

If you're wondering about the demand for new homes in the United States, or about the American residential construction industry in general, then you should pay attention to the monthly Housing Starts report. This report also offers insight into specific types of consumer spending: when housing starts are up, demand for the stuff that a consumer would purchase for a new home (large appliances, consumer electronics, furniture, etc.) tends to also rise -- and vice versa.


=================

 
CHART: Housing Starts + Building Permits + Completions June 2022 Update

 CHART: Housing Starts
+ Building Permits
+ Completions
June 2022 Update
 
=================


================


Labels: , , , , , , , , , ,


--> www.FedPrimeRate.com Privacy Policy <--

>  SITEMAP  <

Import and Export Price Indexes for June 2022

The Labor Department's Bureau of Labor Statistics this morning released its report on U.S. Import and Export Price Indexes for June 2022:

===============

Import Prices
Predicted: +0.5%
Actual: +0.2%

Change From 12 Months Previous: +10.7%

===============

Export Prices
Predicted: +0.5%
Actual: +0.7%

Change From 12 Months Previous: +18.2%

===============
 
The above percentages, highlighted in yellow, represent the month-to-month change in prices for:

  • Imports: the cost of goods produced in other countries and sold in the United States.
  • Exports: the cost of goods produced in the USA and sold in other countries.


Together, these indexes offer insight into the status of inflation in the United States, and for the global economy as well. The "predicted" figure is what economists were expecting, while the "actual" is the true or real figure.

===============


===============


Labels: , , , , , , , , , ,


--> www.FedPrimeRate.com Privacy Policy <--

>  SITEMAP  <

Saturday, July 16, 2022

Consumer Sentiment: Preliminary Results for July 2022

The University of Michigan's Index of Consumer Sentiment (ICS) -  Preliminary Results for July 2022 was released today:

Predicted: 50.0
  • Actual: 51.1
=========

  • Change from Previous Month: +2.2% (+1.1 points)
  • Change from 12 Months Previous: -37.07% (-30.1 points)

=========

  • Final ICS Reading for June 2022: 50.0

  • Final ICS Reading for July 2021: 81.2

=========

From today's report:

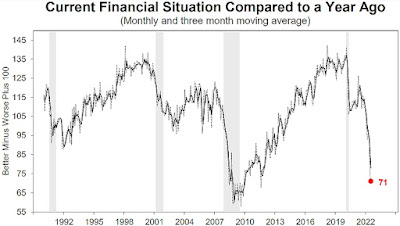
"...Consumer sentiment was relatively unchanged, remaining near all-time lows. Current assessments of personal finances continued to deteriorate, reaching its lowest point since 2011. Buying conditions for durables adjusted upwards, owing both to consumers who cited easing supply constraints and those who believed that one should buy now to avoid future price increases, which would exacerbate inflation going forward. Even with the adjustment, buying conditions remained 26% lower than a year ago.

Consumers remained in agreement over the deleterious effect of prices on their personal finances. The share of consumers blaming inflation for eroding their living standards continued its rise to 49%, matching the all-time high reached during the Great Recession. These negative views endured in the face of the recent moderation in gas prices at the pump.

Inflation expectations have held steady or improved somewhat. The median expected year-ahead inflation rate was 5.2%, little changed from the past five months. Median long run expectations fell to 2.8%, just below the 2.9-3.1% range seen in the preceding 11 months. Inflation uncertainty continued to grow, with 26% of consumers expecting prices to stay the same or fall over the next 5 to 10 years, up from 11% a year ago.
.."

=========


CHART: Current Financial Situation Compared to A Year Ago (Monthly and Three Month Moving Average) - July 2022 PRELIMINARY UPDATE

CHART: Current Financial Situation Compared to A Year Ago
(Monthly and Three Month Moving Average)
July 2022 PRELIMINARY UPDATE


 =========


The ICS is derived from the following five survey questions:


  1. "We are interested in how people are getting along financially these days. Would you say that you (and your family living there) are better off or worse off financially than you were a year ago?"


  2. "Now looking ahead, do you think that a year from now you (and your family living there) will be better off financially, or worse off, or just about the same as now?"


  3. "Now turning to business conditions in the country as a whole, do you think that during the next twelve months we'll have good times financially, or bad times, or what?"


  4. "Looking ahead, which would you say is more likely: that in the country as a whole we'll have continuous good times during the next five years or so, or that we will have periods of widespread unemployment or depression, or what?"


  5. "About the big things people buy for their homes, such as furniture, a refrigerator, stove, television, and things like that. Generally speaking, do you think now is a good or bad time for people to buy major household items?"

=========


=========

The ICS uses a 1966 baseline, i.e. for 1966, the ICS = 100. So any number that is below the 1966 baseline of 100 means that the folks who were polled recently aren't as optimistic about the U.S. economy as those polled back in 1966.

The ICS is similar to the Consumer Confidence Index in that they both measure consumer attitudes and offer valuable insight into consumer spending.

=========

The "predicted" figure is what economists were expecting, while the "actual" is the true or real figure.

=========


=========


Labels: , , , , , , ,


--> www.FedPrimeRate.com Privacy Policy <--

>  SITEMAP  <

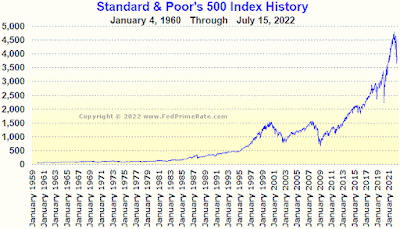
July 15, 2022 Stock Market Bear | Correction Update

The NASDAQ Composite Index continued in The Bear, while the DJIA and S&P 500 indexes ended the week firmly in correction.

Since Closing @ Record-Highs:

-- Dow Jones Industrial Average: -14.98% (-5,511.39 points)

-- NASDAQ Composite: -28.68% (-4,605.02 points)

-- S&P 500: -19.46% (-933.4 points)

==========

DATA:
>> DJIA History <<

DATA:
>> NASDAQ History
<<
 

DATA: >> S & P 500 History <<

==========


CHART: >> http://www.fedprimerate.com/djia-chart-history.htm <<


CHART: >> http://www.fedprimerate.com/s-and-p-500-index-history-chart.htm <<


CHART:
>> http://www.fedprimerate.com/nasdaq-composite-history-chart.htm
<<

 
==========

CHART: S&P 500 Index - July 15, 2022 UPDATE

CHART: S&P 500 Index - July 15, 2022 UPDATE

==========


Labels: , , , , , , , , , , , ,


--> www.FedPrimeRate.com Privacy Policy <--

>  SITEMAP  <

bing

bing

www.FedPrimeRate.com
Entire Website © 2024 FedPrimeRate.comSM


This website is neither affiliated nor associated with The United States Federal Reserve
in any way. Information in this website is provided for educational purposes only. The owners
of this website make no warranties with respect to any and all content contained within this
website. Consult a financial professional before making important decisions related to any
investment or loan product, including, but not limited to, business loans, personal loans,
education loans, first or second mortgages, credit cards, car loans or any type of insurance.