.comment-link {margin-left:.6em;}

Economy

Economic Data (USA)

Friday, January 31, 2020

PCE Price Index + Personal Income + Consumer Spending Report for December 2019

The Commerce Department's Bureau of Economic Analysis (BEA) released its report on The PCE Price Index, Consumer Spending and Personal Income for December 2019:

=============

Consumer Spending (Personal Consumption Expenditures)
Predicted: +0.3%
Actual: +0.3%

----------------------

Personal Income
Predicted: +0.3%
Actual: +0.2%

=============

  • Disposable Personal Income, Current Dollars: +0.2%
  • Disposable Personal Income, 2012 Chained* Dollars: -0.1%

=============

The above highlighted percentages represent the month-to-month change in Consumer Spending (aka Personal Consumption Expenditures), Personal Income and Disposable Personal Income for the entire United States.

=============

=====================
=====================

Personal Consumption Expenditures (PCE) Price Index
Predicted: +0.3%
Actual: +0.3%

  • Change from 12 months previous: +1.6%
=====================

Core PCE Price Index
( = PCE Price Index minus food and energy)
Predicted: +0.1%
Actual: +0.2%

  • Change from 12 months previous: +1.6%
=====================

The yellow-highlighted percentages represent the month-to-month change in the prices associated with domestic personal consumption.  The PCE Price Index is different from the Consumer Price Index (CPI) in that it is a very broad measure of the prices associated with domestic products and services, while the CPI measures a more limited fixed basket of goods and services.

The broad nature of the PCE Price Index is key to why it is the Federal Reserve's preferred measure of inflation.  The Federal Open Market Committee (FOMC) pays very close attention to it.

=====================

The "predicted" figures are what economists were expecting, while the "actual" figures are the true or real figure.


=====================

Chart: Disposable Personal Income and Real Consumer Spending December 2019 Update
Chart: Disposable Personal Income and Real Consumer Spending
December 2019 Update

=====================

 =====================

*Chained dollars is a method of adjusting real dollar amounts for inflation over time, so as to allow comparison of figures from different years. The Commerce Department introduced the chained-dollar measure in 1996. Chained dollars generally reflect dollar figures computed with 2012 as the base year.

Labels: , , , , , , , , , , ,


--> www.FedPrimeRate.com Privacy Policy <--

>  SITEMAP  <

Thursday, January 30, 2020

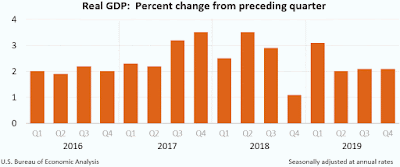
Gross Domestic Product (GDP): First Estimate for Q4, 2019

Earlier this morning, the Commerce Department's Bureau of Economic Analysis (BEA) released its first estimate for U.S. Real Gross Domestic Product (GDP) for the fourth quarter of 2019:

Predicted: +2.1%
Actual: +2.1%

The yellow-highlighted percentage represents the first estimate of the quarter-to-quarter change for Real Gross Domestic Product for the entire United States.


============

The GDP is a very broad measure of economic activity for the entire United States, covering all sectors of the economy. The Commerce Department defines real GDP as, "the output of goods and services produced by labor and property located in the United States."

============

Chart: GDP - Q4 2019 - First Estimate

============


============

Labels: , ,


--> www.FedPrimeRate.com Privacy Policy <--

>  SITEMAP  <

Wednesday, January 29, 2020

Crude Oil Inventories Report for Week of January 24, 2020

The U.S. Crude Oil Inventories report for the week that ended on January 24, 2020 was released this morning:

-- Change from Last Week: +3,500,000 Barrels

-- Change from A Year Ago (Y/Y): -14,300,000 Barrels

-- Current U.S. Crude Oil Stocks: 431,700,000 Barrels

Diminishing crude oil inventories often translate to higher crude oil prices (and vice versa), but not always.

The report is produced by the U.S. Energy Information Administration (EIA).


Labels: , , , ,


--> www.FedPrimeRate.com Privacy Policy <--

>  SITEMAP  <

Tuesday, January 28, 2020

Consumer Confidence Index (CCI) for January 2020

The Consumer Confidence Index® (CCI) for this month (January 2020) was released by The Conference Board® this morning:

================

Predicted: 127.8
  • Actual: 131.6

================

Previous Month (revised): 128.2
 
  • Change from Previous Month: +2.652% (+3.4 points)
================

The "predicted" figure is what economists were expecting, while the "actual" is the true or real figure.

From Today's Report:

"...'Consumer confidence increased in January, following a moderate advance in December, driven primarily by a more positive assessment of the current job market and increased optimism about future job prospects,' said Lynn Franco, Senior Director, Economic Indicators, at The Conference Board. 'Optimism about the labor market should continue to support confidence in the short-term and, as a result, consumers will continue driving growth and prevent the economy from slowing in early 2020.'..."

Every month, The Conference Board sends a questionnaire to 5,000 U.S. households. Survey participants are polled about their feelings regarding the U.S. economy, current and future, and about their own fiscal circumstances. On average, 3,500 participants complete and return the 5-question survey.

  • The baseline "100" score for the CCI is associated with 1985 survey data.

When consumers feel good about the economy, they tend to do more spending, and vice versa.

Based in New York City, The Conference Board is a private, not-for-profit organization with a mission to, "create and disseminate knowledge about management and the marketplace to help businesses strengthen their performance and better serve society."

The CCI is usually released on the last Tuesday of the month.

================

================


Labels: , , ,


--> www.FedPrimeRate.com Privacy Policy <--

>  SITEMAP  <

Thursday, January 23, 2020

Crude Oil Inventories Report for Week of January 17, 2020

The U.S. Crude Oil Inventories report for the week that ended on January 17, 2020 was released this morning:

-- Change from Last Week: -400,000 Barrels

-- Change from A Year Ago (Y/Y): -16,900,000 Barrels

-- Current U.S. Crude Oil Stocks: 428,100,000 Barrels

Diminishing crude oil inventories often translate to higher crude oil prices (and vice versa), but not always.

The report is produced by the U.S. Energy Information Administration (EIA).

Labels: , , , ,


--> www.FedPrimeRate.com Privacy Policy <--

>  SITEMAP  <

Friday, January 03, 2020

ISM Manufacturing Index for December 2019

Earlier today, the Institute for Supply Management® (ISM®) released their Manufacturing Purchasing Manager's Index (PMI®) for December 2019:

Predicted: 49.4%
  • Actual: 47.2% (-0.9 point month-on-month change)

=========

Previous month: 48.1%

=========

Every month, the ISM surveys purchasing and supply executives at hundreds of companies across the country who are involved in manufacturing in some form. The resulting index is watched closely by academics, economists and investors because manufacturing accounts for about 12% of U.S. Gross Domestic Product (GDP).

The PMI is a reliable barometer of U.S. manufacturing: A PMI above 50% implies that U.S. manufacturing expanded during the month specified, while a reading below 50% implies that the made-in-the-USA sector contracted.

=========

From Today's Report:

"..Economic activity in the manufacturing sector contracted in December, and the overall economy grew for the 128th consecutive month, say the nation's supply executives in the latest Manufacturing ISM® Report On Business®...."
=========

The following is a sampling of quotes from a diverse pool of U.S. manufacturers:


  •     "Backlog of orders is shrinking due to new order pace continuing to fall."
     (Computer + Electronic Products)

  •     "Due to sluggish sales, we have introduced promotions to generate increased sales."
     (Chemical Products)

  •     "Cautiously optimistic is the rule these days. Sales are decent, but we're wondering what 2020 will bring. Still hedging that it will be successful — but maybe not as much as this year."
     (Transportation Equipment)

  •     "Starting to see suppliers try to pass on costs associated with tariffs. Uncertainty on the trade front continues to keep agricultural markets on the defensive."
     (Food, Beverage + Tobacco Products)

  •     "Down month-to-month, but up over last year."
     (Miscellaneous Manufacturing)

  •     "Anticipated large export orders did not materialize. As a result, expected U.S. production has decreased."
     (Fabricated Metal Products)

  •     "Dealer inventories have rebounded, and overall customer market has softened, resulting in corrections to near-term production schedules and a tentative forecast outlook."
     (Machinery)

  •     "Export markets continue to weaken for plastic resins — Mexican producers are actually trying to sell product back into the U.S. due to weak in-country demand."
     (Plastics + Rubber Products)

  •     "Our outlook for the first quarter of 2020 is positive. We have secured contracts from a number of former customers and expect sales growth of about 5 percent over Q4 of 2019."
     (Textile Mills)

  •     "The construction market seems to have slowed for end of year. Overall, it’s marginally up."
     (Nonmetallic Mineral Products)

=========

ISM Manufacturing Index - 12 Month History  December 2019 Update
ISM Manufacturing Index - 12 Month History
December 2019 Update

=========


=========


Labels: , , , ,


--> www.FedPrimeRate.com Privacy Policy <--

>  SITEMAP  <

Thursday, January 02, 2020

New Unemployment Insurance Claims for The Week of December 28, 2019

Earlier today, the Labor Department released its weekly report on New Jobless Insurance Claims for the week that ended on December 28, 2019:

====================

Predicted: 222,000
  • Actual: 222,000
====================

The yellow-highlighted figure represents the number of first-time claims for unemployment benefits for the entire United States. The "predicted" figure is what economists were expecting, while the "actual" is the true or real figure.

  • Previous Week (revised): 224,000
  • 4-Week Moving Average: 233,250
====================


====================


Labels: , , , ,


--> www.FedPrimeRate.com Privacy Policy <--

>  SITEMAP  <

bing

bing

www.FedPrimeRate.com
Entire Website © 2024 FedPrimeRate.comSM


This website is neither affiliated nor associated with The United States Federal Reserve
in any way. Information in this website is provided for educational purposes only. The owners
of this website make no warranties with respect to any and all content contained within this
website. Consult a financial professional before making important decisions related to any
investment or loan product, including, but not limited to, business loans, personal loans,
education loans, first or second mortgages, credit cards, car loans or any type of insurance.