.comment-link {margin-left:.6em;}

Economy

Economic Data (USA)

Saturday, December 24, 2022

PCE Price Index + Personal Income + Consumer Spending Report for November 2022

The Commerce Department's Bureau of Economic Analysis (BEA) released its report on The PCE Price Index, Consumer Spending and Personal Income for November 2022:

=============

Consumer Spending (Personal Consumption Expenditures)

Predicted: +0.2

  • Actual: +0.1%
  • Actual (2012 Chained* Dollars): FLAT
=============

Personal Income

Predicted: +0.4
  • Actual: +0.4%
=============

  • Disposable Personal Income, Current Dollars: +0.4%
  • Disposable Personal Income (2012 Chained* Dollars): +0.3%

=============

The above highlighted percentages represent the month-to-month change in Consumer Spending (aka Personal Consumption Expenditures), Personal Income and Disposable Personal Income for the entire United States.

=============

Personal Consumption Expenditures (PCE) Price Index
Predicted: +0.2%
Actual: +0.1% 

  • Change from 12 months previous: +5.5%
=====================

Core PCE Price Index
( = PCE Price Index minus food and energy)
Predicted: 0.3%
Actual: +0.2%

  • Change from 12 months previous: +4.7%
=====================

The yellow-highlighted percentages represent the month-to-month change in the prices associated with domestic personal consumption.  The PCE Price Index is different from the Consumer Price Index (CPI) in that it is a very broad measure of the prices associated with domestic products and services, while the CPI measures a more limited fixed basket of goods and services.

The broad nature of the PCE Price Index is key to why it is the Federal Reserve's preferred measure of inflation.  The Federal Open Market Committee (FOMC) pays very close attention to it.

=====================

The "predicted" figures are what economists were expecting, while the "actual" figures are the true or real figure.


=====================

 =====================

*Chained dollars is a method of adjusting real dollar amounts for inflation over time, so as to allow comparison of figures from different years. The Commerce Department introduced the chained-dollar measure in 1996. Chained dollars generally reflect dollar figures computed with 2012 as the base year.


Labels: , , , , , , , , , , ,


--> www.FedPrimeRate.com Privacy Policy <--

>  SITEMAP  <

Thursday, December 22, 2022

New Unemployment Insurance Claims for The Week of December 17, 2022

Jobless Claims
Jobless Claims

Earlier today, the Labor Department released its weekly report on New Jobless Insurance Claims for the week that ended on December 17, 2022:

====================

Predicted: 220,000

  • Actual: 216,000
====================

The yellow-highlighted figure represents the number of first-time claims for unemployment benefits for the entire United States. The "predicted" figure is what economists were expecting, while the "actual" is the true or real figure.

  • Previous Week (revised): 214,000
  • 4-Week Moving Average: 221,750

====================

Labels: , , , , , , , ,


--> www.FedPrimeRate.com Privacy Policy <--

>  SITEMAP  <

Wednesday, December 21, 2022

Crude Oil Inventories Report for Week of December 16, 2022

Crude Oil Inventories


The U.S. Crude Oil Inventories report for the week that ended on December 16, 2022 was released this morning:

-- Change from Last Week: -5,900,000 Barrels

-- Change from A Year Ago (Y/Y): -5,300,000 Barrels

-- Current U.S. Crude Oil Stocks: 418,200,000 Barrels

Diminishing crude oil inventories often translate to higher crude oil and fuel prices (and vice versa), but not always.

The report is produced by the U.S. Energy Information Administration (EIA).

Labels: , , , , , , ,


--> www.FedPrimeRate.com Privacy Policy <--

>  SITEMAP  <

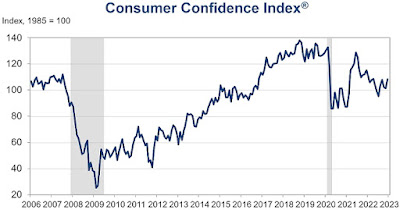
Consumer Confidence Index (CCI) for December 2022

Consumer Confidence Index® (CCI) for this month (December 2022) was released by The Conference Board® this morning:

================

Predicted: 105.0
  • Actual: 108.3

================

Previous Month (revised): 101.4

  • Change from Previous Month: +6.8% (+6.9 points)
================

The "predicted" figure is what economists were expecting, while the "actual" is the true or real figure.

From Today's Report:

"...'Consumer confidence bounced back in December, reversing consecutive declines in October and November to reach its highest level since April 2022,' said Lynn Franco, Senior Director of Economic Indicators at The Conference Board. 'The Present Situation and Expectations Indexes improved due to consumers’ more favorable view regarding the economy and jobs.

Inflation expectations retreated in December to their lowest level since September 2021, with recent declines in gas prices a major impetus. Vacation intentions improved but plans to purchase homes and big-ticket appliances cooled further. This shift in consumers’ preference from big-ticket items to services will continue in 2023, as will headwinds from inflation and interest rate hikes.'..."

Every month, The Conference Board sends a questionnaire to 5,000 U.S. households. Survey participants are polled about their feelings regarding the U.S. economy, current and future, and about their own fiscal circumstances. On average, 3,500 participants complete and return the 5-question survey.

  • The baseline "100" score for the CCI is associated with 1985 survey data.


When consumers feel good about the economy, they tend to do more spending, and vice versa.

Based in New York City, The Conference Board is a private, not-for-profit organization with a mission to, "create and disseminate knowledge about management and the marketplace to help businesses strengthen their performance and better serve society."

The CCI is usually released on the last Tuesday of the month.


================  

CHART: Consumer Confidence Index (CCI) - December 2022 Update

CHART: Consumer Confidence Index (CCI)
December 2022 Update

================

================


Labels: , , , , , , , , ,


--> www.FedPrimeRate.com Privacy Policy <--

>  SITEMAP  <

Tuesday, December 20, 2022

Housing Starts During November 2022

The U.S. Commerce Department this morning released its Housing Starts report for November 2022:

---------------------------------------------------

Housing Starts:
Predicted: 1,500,000
Actual: 1,427,000

Change From Previous Month: -0.49% (-7,000 New Units)

  • Change From One Year Previous: -16.35% (-279,000 New Units)

---------------------------------------------------

Building Permits:
Predicted: 1,400,000
Actual: 1,342,000

Change From Previous Month: -11.24% (-170,000 New Permits)

  • Change From One Year Previous: -22.38%  (-387,000 New Permits)

----------------------------------------------------

Housing Starts: The top, yellow-highlighted figure is a measure of initial construction of single and multi-family residential units in the United States for the indicated month. Seasonally adjusted annual rate. The "predicted" figure is what economists were expecting, while the "actual" is the true or real figure.

If you're wondering about the demand for new homes in the United States, or about the American residential construction industry in general, then you should pay attention to the monthly Housing Starts report. This report also offers insight into specific types of consumer spending: when housing starts are up, demand for the stuff that a consumer would purchase for a new home (large appliances, consumer electronics, furniture, etc.) tends to also rise -- and vice versa.


=================

CHART: Housing Starts + Building Permits + Completions November 2022 Update
CHART: Housing Starts
+ Building Permits
+ Completions
November 2022 Update


=================


================


Labels: , , , , , , , , , ,


--> www.FedPrimeRate.com Privacy Policy <--

>  SITEMAP  <

Friday, December 16, 2022

Consumer Price Index (CPI) for November 2022

Earlier this morning, the Labor Department's Bureau of Labor Statistics released the Consumer Price Index (CPI) for  November 2022:


=========================================

CPI During November 2022: 297.711

=========================================


Predicted: FLAT
Actual: -0.1% (-0.301 points)

  • Change From 12 Months Previous: +7.11% (+19.763 points)

=========================================

The above, yellow-highlighted figures represent month-to-month change (not seasonally adjusted) in prices for a specific group of goods and services that consumers buy, and is, therefore, a very important part of the overall inflation picture for the country.

The "predicted" figure is what economists were expecting, while the "actual" is the true or real figure.

General categories that constitute the CPI are:

  • Healthcare
  • Housing
  • Clothing
  • Communications
  • Education
  • Transportation
  • Food and Beverages
  • Recreation
  • Miscellaneous Goods and Services (grooming expenses, etc.)

=========================================

CPI During November 2021: 277.948

=========================================


=========================================


Labels: , , , , , , , , , , ,


--> www.FedPrimeRate.com Privacy Policy <--

>  SITEMAP  <

Thursday, December 01, 2022

PCE Price Index + Personal Income + Consumer Spending Report for October 2022

The Commerce Department's Bureau of Economic Analysis (BEA) released its report on The PCE Price Index, Consumer Spending and Personal Income for October 2022:

=============

Consumer Spending (Personal Consumption Expenditures)

Predicted: +0.8

  • Actual: +0.8%
  • Actual (2012 Chained* Dollars): +0.5%
=============

Personal Income

Predicted: +0.5
  • Actual: +0.7%
=============

  • Disposable Personal Income, Current Dollars: +0.7%
  • Disposable Personal Income (2012 Chained* Dollars): +0.4%

=============

The above highlighted percentages represent the month-to-month change in Consumer Spending (aka Personal Consumption Expenditures), Personal Income and Disposable Personal Income for the entire United States.

=============

Personal Consumption Expenditures (PCE) Price Index
Predicted: +0.3%
Actual: +0.3% 

  • Change from 12 months previous: +6.0%
=====================

Core PCE Price Index
( = PCE Price Index minus food and energy)
Predicted: 0.5%
Actual: +0.2%

  • Change from 12 months previous: +5.0%
=====================

The yellow-highlighted percentages represent the month-to-month change in the prices associated with domestic personal consumption.  The PCE Price Index is different from the Consumer Price Index (CPI) in that it is a very broad measure of the prices associated with domestic products and services, while the CPI measures a more limited fixed basket of goods and services.

The broad nature of the PCE Price Index is key to why it is the Federal Reserve's preferred measure of inflation.  The Federal Open Market Committee (FOMC) pays very close attention to it.

=====================

The "predicted" figures are what economists were expecting, while the "actual" figures are the true or real figure.


=====================

 =====================

*Chained dollars is a method of adjusting real dollar amounts for inflation over time, so as to allow comparison of figures from different years. The Commerce Department introduced the chained-dollar measure in 1996. Chained dollars generally reflect dollar figures computed with 2012 as the base year.


Labels: , , , , , , , , , , , , ,


--> www.FedPrimeRate.com Privacy Policy <--

>  SITEMAP  <

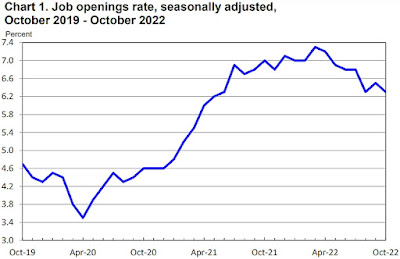
Job Openings and Labor Turnover Survey (JOLTS) for October 2022

Job Openings and Labor Turnover Survey (JOLTS*) for October 2022 was released by the Labor Department this morning:

=============

Job Openings

Predicted: 10,500,000
  • Actual:    10,334,000
-------------------------
  • Previous Month (revised): 10,687,000

  • One Year Previous: 11,094,000

  • Change from one year previous: -6.85% (-760,000)


=============


Hires: 6,012,000

-----------

Quits: 4,026,000


-----------

Layoffs + Discharges: 1,387,000 


-----------

Total Separations §: 5,683,000


=============


§ = Here's How The Labor Department Defines Total Separations:


"Total separations includes quits, layoffs and discharges, and other separations. Total separations is referred to as turnover. Quits are generally voluntary separations initiated by the employee. Therefore, the quits rate can serve as a measure of workers’ willingness or ability to leave jobs. Layoffs and discharges are involuntary separations initiated by the employer. Other separations includes separations due to retirement, death, disability, and transfers to other locations of the same firm."


=============


CHART: Job Openings Rate - October 2022 UPDATE

CHART: Job Openings Rate
October 2022 UPDATE

  =============


============= 

Labels: , , , , , , , , , , , , , ,


--> www.FedPrimeRate.com Privacy Policy <--

>  SITEMAP  <

bing

bing

www.FedPrimeRate.com
Entire Website © 2024 FedPrimeRate.comSM


This website is neither affiliated nor associated with The United States Federal Reserve
in any way. Information in this website is provided for educational purposes only. The owners
of this website make no warranties with respect to any and all content contained within this
website. Consult a financial professional before making important decisions related to any
investment or loan product, including, but not limited to, business loans, personal loans,
education loans, first or second mortgages, credit cards, car loans or any type of insurance.