.comment-link {margin-left:.6em;}

Economy

Economic Data (USA)

Monday, October 18, 2021

Industrial Production + Manufacturing + Capacity Utilization During September 2021

The Industrial Production, Manufacturing and Capacity Utilization numbers for September 2021 were released by the Federal Reserve this morning:

Industrial Production:
Predicted: FLAT
Actual: -1.3%

Manufacturing:
Predicted: FLAT
Actual: -0.7%

The yellow-highlighted percentages represent the month-to-month change in manufacturing, and physical output from mining operations, utility plants and factories for the entire United States.

Capacity Utilization Rate:
Predicted: 75.0%
Actual: 75.2

The Capacity Utilization Rate represents the use of available resources at mining operations, utility plants and factories for the entire United States last month.

The "predicted" figures are what economists were expecting, while the "actual" is the true or real figure.

From Today's Report:

"...Industrial production fell 1.3 percent in September after moving down 0.1 percent in August; output was previously reported to have risen 0.4 percent in August. In September, manufacturing output decreased 0.7 percent: The production of motor vehicles and parts fell 7.2 percent, as shortages of semiconductors continued to hobble operations, while factory output elsewhere declined 0.3 percent. The output of utilities dropped 3.6 percent, as demand for cooling subsided after a warmer-than-usual August. Mining production fell 2.3 percent.

The lingering effects of Hurricane Ida more than accounted for the drop in mining in September; they also contributed 0.3 percentage point to the drop in manufacturing. Overall, about 0.6 percentage point of the drop in total industrial production resulted from the impact of the hurricane.

Despite the decrease in September, total industrial production rose 4.3 percent at an annual rate for the third quarter as a whole, its fifth consecutive quarter with a gain of at least 4 percent.

At 100.0 percent of its 2017 average, total industrial production in September was 4.6 percent above its year-earlier level. Capacity utilization for the industrial sector fell 1.0 percentage point in September to 75.2 percent, a rate that is 4.4 percentage points below its long-run (1972–2020) average.
.."


 ===============


===============


Labels: , , , , , , ,


--> www.FedPrimeRate.com Privacy Policy <--

>  SITEMAP  <

Friday, November 15, 2019

Industrial Production + Manufacturing + Capacity Utilization During October 2019

The Industrial Production, Manufacturing and Capacity Utilization numbers for October 2019 were released by the Federal Reserve this morning:

Industrial Production:
Predicted: -0.4%
Actual: -0.8%

Manufacturing:
Predicted: -0.5%
Actual: -0.6%

The yellow-highlighted percentages represent the month-to-month change in manufacturing, and physical output from mining operations, utility plants and factories for the entire United States.

Capacity Utilization Rate:
Predicted: 77.2%
Actual: 76.7

The Capacity Utilization Rate represents the use of available resources at mining operations, utility plants and factories for the entire United States last month.

The "predicted" figures are what economists were expecting, while the "actual" is the true or real figure.

From today's report:

"...Industrial production fell 0.8 percent in October after declining 0.3 percent in September. Manufacturing production decreased 0.6 percent in October. Much of this decline was due to a drop of 7.1 percent in the output of motor vehicles and parts that resulted from a strike at a major manufacturer of motor vehicles. The decreases for total industrial production, manufacturing, and motor vehicles and parts were their largest since May 2018, April 2019, and January 2019, respectively.

Excluding motor vehicles and parts, the index for total industrial production moved down 0.5 percent, and the index for manufacturing edged down 0.1 percent. Mining production decreased 0.7 percent, while utilities output fell 2.6 percent.

At 108.7 percent of its 2012 average, total industrial production was 1.1 percent lower in October than it was a year earlier. Capacity utilization for the industrial sector decreased 0.8 percentage point in October to 76.7 percent, a rate that is 3.1 percentage points below its long-run (1972–2018) average.
.."

===============


===============


Labels: , , ,


--> www.FedPrimeRate.com Privacy Policy <--

>  SITEMAP  <

Tuesday, August 17, 2021

Industrial Production + Manufacturing + Capacity Utilization During July 2021

The Industrial Production, Manufacturing and Capacity Utilization numbers for July 2021 were released by the Federal Reserve this morning:

Industrial Production:
Predicted: +0.5%
Actual: +0.9%

Manufacturing:
Predicted: +0.9%
Actual: +1.4%

The yellow-highlighted percentages represent the month-to-month change in manufacturing, and physical output from mining operations, utility plants and factories for the entire United States.

Capacity Utilization Rate:
Predicted: 75.0%
Actual: 76.1

The Capacity Utilization Rate represents the use of available resources at mining operations, utility plants and factories for the entire United States last month.

The "predicted" figures are what economists were expecting, while the "actual" is the true or real figure.

From Today's Report:

"...Industrial production increased 0.9 percent in July after moving up 0.2 percent in June. In July, manufacturing output rose 1.4 percent. About half of the gain in factory output is attributable to a jump of 11.2 percent for motor vehicles and parts, as a number of vehicle manufacturers trimmed or canceled their typical July shutdowns. Despite the large increase last month, vehicle assemblies continued to be constrained by a persistent shortage of semiconductors; the production of motor vehicles and parts in July was about 3-1/2 percent below its recent peak in January 2021. The output of utilities decreased 2.1 percent in July, while the index for mining rose 1.2 percent.

At 101.1 percent of its 2017 average, total industrial production in July was 6.6 percent above its year-earlier level but 0.2 percent below its pre-pandemic (February 2020) level. Capacity utilization for the industrial sector rose 0.7 percentage point in July to 76.1 percent, a rate that is 3.5 percentage points below its long-run (1972–2020) average
..."


 ===============

CHART: Industrial Production and Capacity Utilization Rate

  ===============


===============

Labels: , , , , , , ,


--> www.FedPrimeRate.com Privacy Policy <--

>  SITEMAP  <

Tuesday, November 16, 2021

Industrial Production + Manufacturing + Capacity Utilization During October 2021

The Industrial Production, Manufacturing and Capacity Utilization numbers for October 2021 were released by the Federal Reserve this morning:

Industrial Production:
Predicted: +1.5%
Actual: +1.6%

Manufacturing:
Predicted: +1.0%
Actual: +1.2%

The yellow-highlighted percentages represent the month-to-month change in manufacturing, and physical output from mining operations, utility plants and factories for the entire United States.

Capacity Utilization Rate:
Predicted: 75.0%
Actual: 76.4% 

The Capacity Utilization Rate represents the use of available resources at mining operations, utility plants and factories for the entire United States last month.

The "predicted" figures are what economists were expecting, while the "actual" is the true or real figure.

From Today's Report:

"...Industrial production rose 1.6 percent in October after falling 1.3 percent in September; about half of the gain in October reflected a recovery from the effects of Hurricane Ida. Manufacturing output increased 1.2 percent in October; excluding a large gain in the production of motor vehicles and parts, factory output moved up 0.6 percent. The output of utilities rose 1.2 percent, and mining output stepped up 4.1 percent.

At 101.6 percent of its 2017 average, total industrial production in October was 5.1 percent above its year-earlier level and at its highest reading since December 2019. In October, capacity utilization for the industrial sector increased 1.2 percentage points to 76.4 percent; even so, it was still 3.2 percentage points below its long-run (1972–2020) average.
.."

===============


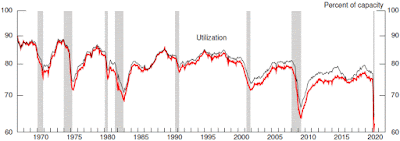
CHART: Industrial Production + Manufacturing + Capacity Utilization

CHART: Industrial Production
+ Manufacturing
+ Capacity Utilization

===============


===============


Labels: , , , , , , ,


--> www.FedPrimeRate.com Privacy Policy <--

>  SITEMAP  <

Thursday, December 16, 2021

Industrial Production + Manufacturing + Capacity Utilization During November 2021

The Industrial Production, Manufacturing and Capacity Utilization numbers for November 2021 were released by the Federal Reserve this morning:

Industrial Production:
Predicted: +1.0%
Actual: +0.5%

Manufacturing:
Predicted: +1.0%
Actual: +0.7%

The yellow-highlighted percentages represent the month-to-month change in manufacturing, and physical output from mining operations, utility plants and factories for the entire United States.

Capacity Utilization Rate:
Predicted: 77.0%
Actual: 76.8% 

The Capacity Utilization Rate represents the use of available resources at mining operations, utility plants and factories for the entire United States last month.

The "predicted" figures are what economists were expecting, while the "actual" is the true or real figure.

From Today's Report:

"...Industrial production rose 0.5 percent in November. The indexes for both manufacturing and mining increased 0.7 percent, while the index for utilities decreased 0.8 percent.

At 102.3 percent of its 2017 average, total industrial production in November was 5.3 percent above its year-earlier level and at its highest reading since September 2019. Capacity utilization for the industrial sector increased 0.3 percentage point to 76.8 percent; even so, it was 2.8 percentage points below its long-run (1972–2020) average.
..."

===============

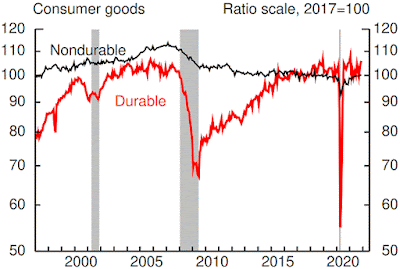
CHART: Industrial Production - Consumer Goods

 CHART: Industrial Production - Consumer Goods

 ===============


===============


Labels: , , , , , , ,


--> www.FedPrimeRate.com Privacy Policy <--

>  SITEMAP  <

Thursday, October 17, 2019

Industrial Production + Manufacturing + Capacity Utilization During September 2019

The Industrial Production, Manufacturing and Capacity Utilization numbers for September 2019 were released by the Federal Reserve this morning:

Industrial Production:
Predicted: -0.2%
Actual: -0.4%

Manufacturing:
Predicted: -0.3%
Actual: -0.5%

The yellow-highlighted percentages represent the month-to-month change in manufacturing, and physical output from mining operations, utility plants and factories for the entire United States.

Capacity Utilization Rate:
Predicted: 77.8%
Actual: 77.5

The Capacity Utilization Rate represents the use of available resources at mining operations, utility plants and factories for the entire United States last month.

The "predicted" figures are what economists were expecting, while the "actual" is the true or real figure.

From today's report:

"...Industrial production fell back 0.4 percent in September after advancing 0.8 percent in August. For the third quarter, industrial production rose at an annual rate of 1.2 percent following declines of about 2 percent in both the first and the second quarters.

Manufacturing production decreased 0.5 percent in September, with output reduced by a strike at a major manufacturer of motor vehicles. Excluding motor vehicles and parts, the overall index and the manufacturing index each moved down 0.2 percent. Mining production fell 1.3 percent, while utilities output rose 1.4 percent.

At 109.5 percent of its 2012 average, total industrial production was 0.1 percent lower in September than it was a year earlier. Capacity utilization for the industrial sector decreased 0.4 percentage point in September to 77.5 percent, a rate that is 2.3 percentage points below its long-run (1972–2018) average.
.."

===============


===============


Labels: , , ,


--> www.FedPrimeRate.com Privacy Policy <--

>  SITEMAP  <

Tuesday, December 17, 2019

Industrial Production + Manufacturing + Capacity Utilization During November 2019

The Industrial Production, Manufacturing and Capacity Utilization numbers for November 2019 were released by the Federal Reserve this morning:

Industrial Production:
Predicted: +0.9%
Actual: +1.1%

Manufacturing:
Predicted: +0.7%
Actual: +1.1%

The yellow-highlighted percentages represent the month-to-month change in manufacturing, and physical output from mining operations, utility plants and factories for the entire United States.

Capacity Utilization Rate:
Predicted: 77.4%
Actual: 77.3

The Capacity Utilization Rate represents the use of available resources at mining operations, utility plants and factories for the entire United States last month.

The "predicted" figures are what economists were expecting, while the "actual" is the true or real figure.

From today's report:

"...Industrial production and manufacturing production both rebounded 1.1 percent in November after declining in October. These sharp November increases were largely due to a bounceback in the output of motor vehicles and parts following the end of a strike at a major manufacturer. Excluding motor vehicles and parts, the indexes for total industrial production and for manufacturing moved up 0.5 percent and 0.3 percent, respectively. Mining production edged down 0.2 percent, while the output of utilities increased 2.9 percent.

At 109.7 percent of its 2012 average, total industrial production was 0.8 percent lower in November than it was a year earlier. Capacity utilization for the industrial sector increased 0.7 percentage point in November to 77.3 percent, a rate that is 2.5 percentage points below its long-run (1972–2018) average.
.."

===============


===============


Labels: , , ,


--> www.FedPrimeRate.com Privacy Policy <--

>  SITEMAP  <

Thursday, November 16, 2017

Industrial Production + Manufacturing + Capacity Utilization During October 2017

The Industrial Production, Manufacturing and Capacity Utilization numbers for October 2017 were released by the Federal Reserve this morning:

Industrial Production:
Predicted: +0.5%
Actual: +0.9%

Manufacturing:
Predicted: +0.3%
Actual: +1.3%

The yellow-highlighted percentages represent the month-to-month change in manufacturing, and physical output from mining operations, utility plants and factories for the entire United States.

Capacity Utilization Rate:
Predicted: 76.3%
Actual: 77.0

The Capacity Utilization Rate represents the use of available resources at mining operations, utility plants and factories for the entire United States last month.

The "predicted" figures are what economists were expecting, while the "actual" is the true or real figure.

From today's report:

"...Industrial production rose 0.9 percent in October, and manufacturing increased 1.3 percent. The index for utilities rose 2.0 percent, but mining output fell 1.3 percent, as Hurricane Nate caused a sharp but short-lived decline in oil and gas drilling and extraction. Even so, industrial activity was boosted in October by a return to normal operations after Hurricanes Harvey and Irma suppressed production in August and September.  Excluding the effects of the hurricanes, the index for total output advanced about 0.3 percent in October, and the index for manufacturing advanced about 0.2 percent.

With modest upward revisions for July through September, industrial production is now estimated to have only edged down 0.3 percent at an annual rate in the third quarter; the previously published estimate showed a decrease of 1.5 percent.

Total industrial production has risen 2.9 percent over the past 12 months; output in October was 106.1 percent of its 2012 average. Capacity utilization for the industrial sector was 77.0 percent, a rate that is 2.9 percentage points below its long-run (1972–2016) average..."
 

Labels: , , ,


--> www.FedPrimeRate.com Privacy Policy <--

>  SITEMAP  <

Friday, May 15, 2020

Industrial Production + Manufacturing + Capacity Utilization During April 2020

The Industrial Production, Manufacturing and Capacity Utilization numbers for April 2020 were released by the Federal Reserve this morning:

Industrial Production:
Predicted: -11.5%
Actual: -11.2%

Manufacturing:
Predicted: -11.4%
Actual: -13.7%

The yellow-highlighted percentages represent the month-to-month change in manufacturing, and physical output from mining operations, utility plants and factories for the entire United States.

Capacity Utilization Rate:
Predicted: 64.1%
Actual: 64.9

The Capacity Utilization Rate represents the use of available resources at mining operations, utility plants and factories for the entire United States last month.

The "predicted" figures are what economists were expecting, while the "actual" is the true or real figure.

From today's report:

"...Total industrial production fell 11.2 percent in April for its largest monthly drop in the 101-year history of the index, as the COVID-19 (coronavirus disease 2019) pandemic led many factories to slow or suspend operations throughout the month. Manufacturing output dropped 13.7 percent, its largest decline on record, as all major industries posted decreases. The output of motor vehicles and parts fell more than 70 percent; production elsewhere in manufacturing dropped 10.3 percent. The indexes for utilities and mining decreased 0.9 percent and 6.1 percent, respectively. At 92.6 percent of its 2012 average, the level of total industrial production was 15.0 percent lower in April than it was a year earlier. Capacity utilization for the industrial sector decreased 8.3 percentage points to 64.9 percent in April, a rate that is 14.9 percentage points below its long-run (1972–2019) average and 1.8 percentage points below its all-time (since 1967) low set in 2009.

In addition to the regular revisions that reflect incoming data, the industrial production indexes for March were revised to incorporate data on initial claims for unemployment insurance by employees who had worked in the industrial sector. The methods used to construct the estimates are described on the Federal Reserve Board's website at www.federalreserve.gov/releases/g17/g17_technical_qa.htm#covid2020ui.
.."

===============


===============


Labels: , , , , , ,


--> www.FedPrimeRate.com Privacy Policy <--

>  SITEMAP  <

Tuesday, July 16, 2019

Industrial Production + Manufacturing + Capacity Utilization During June 2019

The Industrial Production, Manufacturing and Capacity Utilization numbers for June 2019 were released by the Federal Reserve this morning:

Industrial Production:
Predicted: +0.1%
Actual: Unchanged

Manufacturing:
Predicted: +0.2%
Actual: +0.4%

The yellow-highlighted percentages represent the month-to-month change in manufacturing, and physical output from mining operations, utility plants and factories for the entire United States.

Capacity Utilization Rate:
Predicted: 78.2%
Actual: 77.9

The Capacity Utilization Rate represents the use of available resources at mining operations, utility plants and factories for the entire United States last month.

The "predicted" figures are what economists were expecting, while the "actual" is the true or real figure.

From today's report:

"...Industrial production was unchanged in June, as increases for both manufacturing and mining offset a decline for utilities. For the second quarter as a whole, industrial production declined at an annual rate of 1.2 percent, its second consecutive quarterly decrease. In June, manufacturing output advanced 0.4 percent. An increase of nearly 3 percent for motor vehicles and parts contributed significantly to the gain in factory production; excluding motor vehicles and parts, manufacturing output moved up 0.2 percent. The output of utilities fell 3.6 percent as milder-than-usual temperatures in June reduced the demand for air conditioning. The index for mining rose 0.2 percent. At 109.6 percent of its 2012 average, total industrial production was 1.3 percent higher in June than it was a year earlier. Capacity utilization for the industrial sector decreased 0.2 percentage point in June to 77.9 percent, a rate that is 1.9 percentage points below its long-run (1972–2018) average..."

===============


===============

Labels: , , ,


--> www.FedPrimeRate.com Privacy Policy <--

>  SITEMAP  <

Tuesday, July 17, 2018

Industrial Production + Manufacturing + Capacity Utilization During June 2018

The Industrial Production, Manufacturing and Capacity Utilization numbers for June 2018 were released by the Federal Reserve this morning:

Industrial Production:
Predicted: +0.6%
Actual: +0.6%

Manufacturing:
Predicted: +0.8%
Actual: +0.8%

The yellow-highlighted percentages represent the month-to-month change in manufacturing, and physical output from mining operations, utility plants and factories for the entire United States.

Capacity Utilization Rate:
Predicted: 78.3%
Actual: 78.0

The Capacity Utilization Rate represents the use of available resources at mining operations, utility plants and factories for the entire United States last month.

The "predicted" figures are what economists were expecting, while the "actual" is the true or real figure.

From today's report:

"...Industrial production rose 0.6 percent in June after declining 0.5 percent in May. For the second quarter as a whole, industrial production advanced at an annual rate of 6.0 percent, its third consecutive quarterly increase. Manufacturing output moved up 0.8 percent in June. The production of motor vehicles and parts rebounded last month after truck assemblies fell sharply in May because of a disruption at a parts supplier. Factory output, aside from motor vehicles and parts, increased 0.3 percent in June. The index for mining rose 1.2 percent and surpassed the level of its previous historical peak (December 2014); the output of utilities moved down 1.5 percent. At 107.7 percent of its 2012 average, total industrial production was 3.8 percent higher in June than it was a year earlier. Capacity utilization for the industrial sector increased 0.3 percentage point in June to 78.0 percent, a rate that is 1.8 percentage points below its long-run (1972–2017) average..."


Labels: , , ,


--> www.FedPrimeRate.com Privacy Policy <--

>  SITEMAP  <

Friday, December 15, 2017

Industrial Production + Manufacturing + Capacity Utilization During November 2017

The Industrial Production, Manufacturing and Capacity Utilization numbers for November 2017 were released by the Federal Reserve this morning:

Industrial Production:
Predicted: +0.3%
Actual: +0.2%

Manufacturing:
Predicted: +0.3%
Actual: +0.2%

The yellow-highlighted percentages represent the month-to-month change in manufacturing, and physical output from mining operations, utility plants and factories for the entire United States.

Capacity Utilization Rate:
Predicted: 77.2%
Actual: 77.1

The Capacity Utilization Rate represents the use of available resources at mining operations, utility plants and factories for the entire United States last month.

The "predicted" figures are what economists were expecting, while the "actual" is the true or real figure.

From today's report:

"...Industrial production moved up 0.2 percent in November after posting an upwardly revised increase of 1.2 percent in October. Manufacturing production also rose 0.2 percent in November, its third consecutive monthly gain. The output of utilities dropped 1.9 percent. The index for mining increased 2.0 percent, as oil and gas extraction returned to normal levels after being held down in October by Hurricane Nate. Excluding the post-hurricane rebound in oil and gas extraction, total industrial production would have been unchanged in November. Total industrial production was 106.4 percent of its 2012 average in November and was 3.4 percent above its year-earlier level. Capacity utilization for the industrial sector was 77.1 percent in November, a rate that is 2.8 percentage points below its long-run (1972–2016) average..."


Labels: , , ,


--> www.FedPrimeRate.com Privacy Policy <--

>  SITEMAP  <

Wednesday, April 15, 2020

Industrial Production + Manufacturing + Capacity Utilization During March 2020

The Industrial Production, Manufacturing and Capacity Utilization numbers for March 2020 were released by the Federal Reserve this morning:

Industrial Production:
Predicted: -4.2%
Actual: -5.4%

Manufacturing:
Predicted: -4.0%
Actual: -6.3%

The yellow-highlighted percentages represent the month-to-month change in manufacturing, and physical output from mining operations, utility plants and factories for the entire United States.

Capacity Utilization Rate:
Predicted: 74.0%
Actual: 72.7

The Capacity Utilization Rate represents the use of available resources at mining operations, utility plants and factories for the entire United States last month.

The "predicted" figures are what economists were expecting, while the "actual" is the true or real figure.

From today's report:

"...Total industrial production fell 5.4 percent in March, as the COVID-19 (coronavirus disease 2019) pandemic led many factories to suspend operations late in the month. Manufacturing output fell 6.3 percent; most major industries posted decreases, with the largest decline registered by motor vehicles and parts. The decreases for total industrial production and for manufacturing were their largest since January 1946 and February 1946, respectively. The indexes for utilities and mining declined 3.9 percent and 2.0 percent, respectively. At 103.7 percent of its 2012 average, the level of total industrial production in March was 5.5 percent lower than a year earlier. Capacity utilization for the industrial sector decreased 4.3 percentage points to 72.7 percent in March, a rate that is 7.1 percentage points below its long-run (1972–2019) average.

The estimates in this release incorporated data on stay-at-home orders as well as other information on industrial activity for late in the month. An explanation of the methods used to construct the estimates is available on the Federal Reserve Board's website at www.federalreserve.gov/releases/g17/g17_technical_qa.htm#covid2020.
.."

===============


===============


Labels: , , , , , ,


--> www.FedPrimeRate.com Privacy Policy <--

>  SITEMAP  <

Wednesday, July 15, 2020

Industrial Production + Manufacturing + Capacity Utilization During June 2020

The Industrial Production, Manufacturing and Capacity Utilization numbers for June 2020 were released by the Federal Reserve this morning:

Industrial Production:
Predicted: +5.0%
Actual: +5.4%

Manufacturing:
Predicted: +6.0%
Actual: +7.2%

The yellow-highlighted percentages represent the month-to-month change in manufacturing, and physical output from mining operations, utility plants and factories for the entire United States.

Capacity Utilization Rate:
Predicted: 68.0%
Actual: 68.6

The Capacity Utilization Rate represents the use of available resources at mining operations, utility plants and factories for the entire United States last month.

The "predicted" figures are what economists were expecting, while the "actual" is the true or real figure.

From Today's Report:

"...Total industrial production rose 5.4 percent in June after increasing 1.4 percent in May; even so, it remained 10.9 percent below its pre-pandemic February level. For the second quarter as a whole, the index fell 42.6 percent at an annual rate, its largest quarterly decrease since the industrial sector retrenched after World War II. Manufacturing output climbed 7.2 percent in June, as all major industries posted increases. The largest gain—105.0 percent—was registered by motor vehicles and parts, while factory production elsewhere rose 3.9 percent. Mining production fell 2.9 percent, and the output of utilities increased 4.2 percent. At 97.5 percent of its 2012 average, the level of total industrial production was 10.8 percent lower in June than it was a year earlier. Capacity utilization for the industrial sector increased 3.5 percentage points to 68.6 percent in June, a rate that is 11.2 percentage points below its long-run (1972–2019) average but 1.9 percentage points above its trough during the Great Recession..."

===============
 
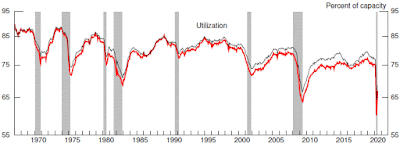
CHART: Utilization Rate - June 2020 Update

===============


===============


Labels: , , , , , ,


--> www.FedPrimeRate.com Privacy Policy <--

>  SITEMAP  <

Tuesday, October 16, 2018

Industrial Production + Manufacturing + Capacity Utilization During September 2018

The Industrial Production, Manufacturing and Capacity Utilization numbers for September 2018 were released by the Federal Reserve this morning:

Industrial Production:
Predicted: +0.2%
Actual: +0.3%

Manufacturing:
Predicted: +0.2%
Actual: +0.2%

The yellow-highlighted percentages represent the month-to-month change in manufacturing, and physical output from mining operations, utility plants and factories for the entire United States.

Capacity Utilization Rate:
Predicted: 78.2%
Actual: 78.1

The Capacity Utilization Rate represents the use of available resources at mining operations, utility plants and factories for the entire United States last month.

The "predicted" figures are what economists were expecting, while the "actual" is the true or real figure.

From today's report:

"...Industrial production increased 0.3 percent in September, about the same rate of change as in the previous two months. Output growth in September was held down slightly by Hurricane Florence, with an estimated effect of less than 0.1 percentage point. For the third quarter as a whole, total industrial production advanced at an annual rate of 3.3 percent. In September, manufacturing output moved up 0.2 percent for its fourth consecutive monthly increase, while the output of utilities was unchanged. The index for mining increased 0.5 percent and has moved up in each of the past eight months. At 108.5 percent of its 2012 average, total industrial production was 5.1 percent higher in September than it was a year earlier. Capacity utilization for the industrial sector was unchanged at 78.1 percent, a rate that is 1.7 percentage points below its long-run (1972–2017) average..."


===============


===============

Labels: , , ,


--> www.FedPrimeRate.com Privacy Policy <--

>  SITEMAP  <

Tuesday, June 16, 2020

Industrial Production + Manufacturing + Capacity Utilization During May 2020

The Industrial Production, Manufacturing and Capacity Utilization numbers for May 2020 were released by the Federal Reserve this morning:

Industrial Production:
Predicted: +3.0%
Actual: +1.4%

Manufacturing:
Predicted: +4.0%
Actual: +3.8%

The yellow-highlighted percentages represent the month-to-month change in manufacturing, and physical output from mining operations, utility plants and factories for the entire United States.

Capacity Utilization Rate:
Predicted: 65.0%
Actual: 64.8

The Capacity Utilization Rate represents the use of available resources at mining operations, utility plants and factories for the entire United States last month.

The "predicted" figures are what economists were expecting, while the "actual" is the true or real figure.

From Today's Report:

"...Total industrial production increased 1.4 percent in May, as many factories resumed at least partial operations following suspensions related to COVID-19. Even so, total industrial production in May was 15.4 percent below its pre-pandemic level in February. Manufacturing output -- which fell sharply in March and April -- rose 3.8 percent in May; most major industries posted increases, with the largest gain registered by motor vehicles and parts. The indexes for mining and utilities declined 6.8 percent and 2.3 percent, respectively. At 92.6 percent of its 2012 average, the level of total industrial production was 15.3 percent lower in May than it was a year earlier. Capacity utilization for the industrial sector increased 0.8 percentage point to 64.8 percent in May, a rate that is 15.0 percentage points below its long-run (1972 - 2019) average and 1.9 percentage points below its trough during the Great Recession..."

===============
 
CHART: Utilization Rate - May 2020 Update

===============


===============


Labels: , , , , , ,


--> www.FedPrimeRate.com Privacy Policy <--

>  SITEMAP  <

Friday, November 16, 2018

Industrial Production + Manufacturing + Capacity Utilization During October 2018

The Industrial Production, Manufacturing and Capacity Utilization numbers for October 2018 were released by the Federal Reserve this morning:

Industrial Production:
Predicted: +0.2%
Actual: +0.1%

Manufacturing:
Predicted: +0.3%
Actual: +0.3%

The yellow-highlighted percentages represent the month-to-month change in manufacturing, and physical output from mining operations, utility plants and factories for the entire United States.

Capacity Utilization Rate:
Predicted: 78.2%
Actual: 78.4

The Capacity Utilization Rate represents the use of available resources at mining operations, utility plants and factories for the entire United States last month.

The "predicted" figures are what economists were expecting, while the "actual" is the true or real figure.

From today's report:

"...Industrial production edged up 0.1% in October, as a gain for manufacturing outweighed decreases elsewhere. As a result of upward revisions primarily in mining, the overall index is now reported to have advanced at an annual rate of 4.7% in the third quarter, appreciably above the gain of 3.3% reported initially. Hurricanes lowered the level of industrial production in both September and October, but their effects appear to be less than 0.1% per month. In October, manufacturing output rose 0.3% for its fifth consecutive monthly increase, while the indexes for mining and for utilities declined 0.3% and 0.5%, respectively. At 109.1% of its 2012 average, total industrial production was 4.1% higher in October than it was a year earlier. Capacity utilization for the industrial sector was 78.4%, a rate that is 1.4 percentage points below its long-run (1972–2017) average..."

===============


===============


Labels: , , ,


--> www.FedPrimeRate.com Privacy Policy <--

>  SITEMAP  <

Friday, January 18, 2019

Industrial Production + Manufacturing + Capacity Utilization During December 2018

The Industrial Production, Manufacturing and Capacity Utilization numbers for December 2018 were released by the Federal Reserve this morning:

Industrial Production:
Predicted: +0.3%
Actual: +0.3%

Manufacturing:
Predicted: +0.1%
Actual: +1.1%

The yellow-highlighted percentages represent the month-to-month change in manufacturing, and physical output from mining operations, utility plants and factories for the entire United States.

Capacity Utilization Rate:
Predicted: 78.4%
Actual: 78.7

The Capacity Utilization Rate represents the use of available resources at mining operations, utility plants and factories for the entire United States last month.

The "predicted" figures are what economists were expecting, while the "actual" is the true or real figure.

From today's report:

"...Industrial production increased 0.3 percent in December after rising 0.4 percent in November. For the fourth quarter as a whole, total industrial production moved up at an annual rate of 3.8 percent. In December, manufacturing output increased 1.1 percent, its largest gain since February 2018. The output of mines rose 1.5 percent, but the index for utilities fell 6.3 percent, as warmer-than-usual temperatures lowered the demand for heating. At 109.9 percent of its 2012 average, total industrial production was 4.0 percent higher in December than it was a year earlier. Capacity utilization for the industrial sector rose 0.1 percentage point in December to 78.7 percent, a rate that is 1.1 percentage points below its long-run (1972–2017) average..."

===============


===============


Labels: , , ,


--> www.FedPrimeRate.com Privacy Policy <--

>  SITEMAP  <

Wednesday, May 16, 2018

Industrial Production + Manufacturing + Capacity Utilization During April 2018

The Industrial Production, Manufacturing and Capacity Utilization numbers for April 2018 were released by the Federal Reserve this morning:

Industrial Production:
Predicted: +0.6%
Actual: +0.7%

Manufacturing:
Predicted: +0.3%
Actual: +0.5%

The yellow-highlighted percentages represent the month-to-month change in manufacturing, and physical output from mining operations, utility plants and factories for the entire United States.

Capacity Utilization Rate:
Predicted: 78.3%
Actual: 78.0

The Capacity Utilization Rate represents the use of available resources at mining operations, utility plants and factories for the entire United States last month.

The "predicted" figures are what economists were expecting, while the "actual" is the true or real figure.

From today's report:

"...Industrial production rose 0.7 percent in April for its third consecutive monthly increase. The rates of change for industrial production for previous months were revised downward, on net; for the first quarter, output is now reported to have advanced 2.3 percent at an annual rate. After being unchanged in March, manufacturing output rose 0.5 percent in April. The indexes for mining and utilities moved up 1.1 percent and 1.9 percent, respectively. At 107.3 percent of its 2012 average, total industrial production in April was 3.5 percent higher than it was a year earlier. Capacity utilization for the industrial sector climbed 0.4 percentage point in April to 78.0 percent, a rate that is 1.8 percentage points below its long-run (1972–2017) average..."


Labels: , , ,


--> www.FedPrimeRate.com Privacy Policy <--

>  SITEMAP  <

Friday, October 16, 2020

Industrial Production + Manufacturing + Capacity Utilization During September 2020

The Industrial Production, Manufacturing and Capacity Utilization numbers for September 2020 were released by the Federal Reserve this morning:

Industrial Production:
Predicted: +1.0%
Actual: -0.6%

Manufacturing:
Predicted: +5.0%
Actual: -0.3%

The yellow-highlighted percentages represent the month-to-month change in manufacturing, and physical output from mining operations, utility plants and factories for the entire United States.

Capacity Utilization Rate:
Predicted: 71.0%
Actual: 71.5

The Capacity Utilization Rate represents the use of available resources at mining operations, utility plants and factories for the entire United States last month.

The "predicted" figures are what economists were expecting, while the "actual" is the true or real figure.

From Today's Report:

"...Industrial production fell 0.6 percent in September, its first decline after four consecutive months of gains. The index increased at an annual rate of 39.8 percent for the third quarter as a whole. Although production has recovered more than half of its February to April decline, the September reading was still 7.1 percent below its pre-pandemic February level. Manufacturing output decreased 0.3 percent in September and was 6.4 percent below February's level. The output of utilities dropped 5.6 percent, as demand for air conditioning fell by more than usual in September. Mining production increased 1.7 percent in September; even so, it was 14.8 percent below a year earlier. At 101.5 percent of its 2012 average, total industrial production was 7.3 percent lower in September than it was a year earlier. Capacity utilization for the industrial sector decreased 0.5 percentage point in September to 71.5 percent, a rate that is 8.3 percentage points below its long-run (1972–2019) average but 7.3 percentage points above its low in April..."


===============


===============


Labels: , , , , , , ,


--> www.FedPrimeRate.com Privacy Policy <--

>  SITEMAP  <

bing

bing

www.FedPrimeRate.com
Entire Website © 2024 FedPrimeRate.comSM


This website is neither affiliated nor associated with The United States Federal Reserve
in any way. Information in this website is provided for educational purposes only. The owners
of this website make no warranties with respect to any and all content contained within this
website. Consult a financial professional before making important decisions related to any
investment or loan product, including, but not limited to, business loans, personal loans,
education loans, first or second mortgages, credit cards, car loans or any type of insurance.