.comment-link {margin-left:.6em;}

Economy

Economic Data (USA)

Wednesday, August 30, 2023

Consumer Confidence Index (CCI) for August 2023

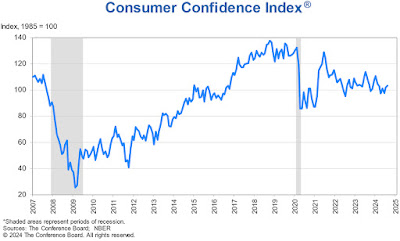
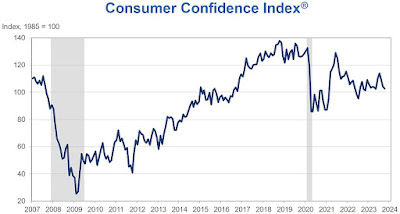
Consumer Confidence Index® (CCI) for this month (August) was released by The Conference Board® this morning:

================

Predicted: 116.0
  • Actual: 106.1

================

Previous Month (revised): 114.0

  • Change from Previous Month: -6.93% (-7.9 points)
================

The "predicted" figure is what economists were expecting, while the "actual" is the true or real figure.

From Today's Report:

"...The Conference Board Consumer Confidence Index® declined in August to 106.1 (1985=100), from a downwardly revised 114.0 in July. The Present Situation Index -- based on consumers’ assessment of current business and labor market conditions -- fell to 144.8 (1985=100) from 153.0. The Expectations Index -- based on consumers’ short-term outlook for income, business, and labor market conditions -- declined to 80.2 (1985=100) in August, reversing July’s sharp uptick to 88.0. Expectations were a hair above 80 -- the level that historically signals a recession, within the next year. Although consumer fears of an impending recession continued to recede, we still anticipate one is likely before year-end.

'Consumer confidence fell in August 2023, erasing back-to-back increases in June and July,' said Dana Peterson, Chief Economist at The Conference Board. 'August’s disappointing headline number reflected dips in both the current conditions and expectations indexes. Write-in responses showed that consumers were once again preoccupied with rising prices in general, and for groceries and gasoline in particular. The pullback in consumer confidence was evident across all age groups -- and most notable among consumers with household 
incomes of $100,000 or more, as well as those earning less than $50,000. Confidence held relatively steady for consumers with incomes between $50,000 and $99,999.'..."

Every month, The Conference Board sends a questionnaire to 5,000 U.S. households. Survey participants are polled about their feelings regarding the U.S. economy, current and future, and about their own fiscal circumstances. On average, 3,500 participants complete and return the 5-question survey.

  • The baseline "100" score for the CCI is associated with 1985 survey data.


When consumers feel good about the economy, they tend to do more spending, and vice versa.

Based in New York City, The Conference Board is a private, not-for-profit organization with a mission to, "create and disseminate knowledge about management and the marketplace to help businesses strengthen their performance and better serve society."

The CCI is usually released on the last Tuesday of the month.

================   

CHART: Consumer Confidence Index (CCI) - August 2023 Update
CHART: Consumer Confidence Index (CCI)
 August 2023 Update

================


Labels: , , , , , , , , , , , , ,


--> www.FedPrimeRate.com Privacy Policy <--

>  SITEMAP  <

Tuesday, July 25, 2023

Consumer Confidence Index (CCI) for July 2023

Consumer Confidence Index® (CCI) for this month (July) was released by The Conference Board® this morning:

================

Predicted: 112.0
  • Actual: 117.0

================

Previous Month (revised): 110.1

  • Change from Previous Month: +6.27% (+6.9 points)
================

The "predicted" figure is what economists were expecting, while the "actual" is the true or real figure.

From Today's Report:

"...The Expectations Index -- based on consumers’ short-term outlook for income, business, and labor market conditions -- improved to 88.3 (1985=100) from 80.0 in June. Importantly, Expectations climbed well above 80 -- the level that historically signals a recession within the next year. Despite rising interest rates, consumers are more upbeat, likely reflecting lower inflation and a tight labor market. Although consumers are less convinced of a recession ahead, we still anticipate one likely before year-end.

'Consumer confidence rose in July 2023 to its highest level since July 2021, reflecting pops in both current conditions and expectations,' said Dana Peterson, Chief Economist at The Conference Board. 'Headline confidence appears to have broken out of the sideways trend that prevailed for much of the last year. Greater confidence was evident across all age groups, and among both consumers earning incomes less than $50,000 and those making more than $100,000.'..."

Every month, The Conference Board sends a questionnaire to 5,000 U.S. households. Survey participants are polled about their feelings regarding the U.S. economy, current and future, and about their own fiscal circumstances. On average, 3,500 participants complete and return the 5-question survey.

  • The baseline "100" score for the CCI is associated with 1985 survey data.


When consumers feel good about the economy, they tend to do more spending, and vice versa.

Based in New York City, The Conference Board is a private, not-for-profit organization with a mission to, "create and disseminate knowledge about management and the marketplace to help businesses strengthen their performance and better serve society."

The CCI is usually released on the last Tuesday of the month.

================   

CHART: Consumer Confidence Index (CCI) - July 2023 Update

CHART: Consumer Confidence Index (CCI)
 July 2023 Update

================

Labels: , , , , , , , , , , , , ,


--> www.FedPrimeRate.com Privacy Policy <--

>  SITEMAP  <

Wednesday, June 28, 2023

Consumer Confidence Index (CCI) for June 2023

Consumer Confidence Index® (CCI) for this month (June) was released by The Conference Board® this morning:

================

Predicted: 105.0
  • Actual: 109.7

================

Previous Month (revised): 102.5

  • Change from Previous Month: +7.02% (+7.2 points)
================

The "predicted" figure is what economists were expecting, while the "actual" is the true or real figure.

From Today's Report:

"...'Consumer confidence improved in June to its highest level since January 2022, reflecting improved current conditions and a pop in expectations,' said Dana Peterson, Chief Economist at The Conference Board. 'Greater confidence was most evident among consumers under age 35, and consumers earning incomes over $35,000. Nonetheless, the expectations gauge continued to signal consumers anticipating a recession at some point over the next 6 to 12 months.'

'Assessments of the present situation rose in June on sunnier views of both business and employment conditions. Indeed, the spread between consumers saying jobs are ‘plentiful’ versus ‘not so plentiful’ widened, indicating upbeat feelings about a labor market that continues to outperform. Likewise, expectations for the next six months improved materially, reflecting greater confidence about future business conditions and job availability.'

'While income expectations ticked down slightly in June, new questions included in this month’s release found a notably brighter outlook for consumers’ family finances: Around 30 percent expect their family’s financial situation to be ‘better’ in the next six months, compared to less than 14 percent expecting it to be ‘worse.’ This might reflect consumers’ belief that labor market conditions will remain favorable and that there will be further declines in inflation ahead. Indeed, the 12-month forward inflation expectations gauge fell to 6 percent in June, the lowest reading since December 2020.'

 'Although the Expectations Index remained a hair below the threshold signaling recession ahead, a new measure found considerably fewer consumers now expect a recession in the next 12 months compared to May. Meanwhile, on a six-month moving average basis, plans to purchase autos and homes have slowed, after picking up earlier in 2023. This may reflect rising costs to finance big-ticket items as the Fed continues to raise interest rates. Meanwhile, vacation plans within the next six months continued to flag, led largely by declines in plans to travel domestically. This is an important indicator of desires to spend on services ahead, which may be a signal that post-pandemic ‘revenge spending’ on travel may have peaked and is likely to slow over the rest of this year.'..."

Every month, The Conference Board sends a questionnaire to 5,000 U.S. households. Survey participants are polled about their feelings regarding the U.S. economy, current and future, and about their own fiscal circumstances. On average, 3,500 participants complete and return the 5-question survey.

  • The baseline "100" score for the CCI is associated with 1985 survey data.


When consumers feel good about the economy, they tend to do more spending, and vice versa.

Based in New York City, The Conference Board is a private, not-for-profit organization with a mission to, "create and disseminate knowledge about management and the marketplace to help businesses strengthen their performance and better serve society."

The CCI is usually released on the last Tuesday of the month.

================   

CHART: Consumer Confidence Index (CCI)  - June 2023 Update
CHART: Consumer Confidence Index (CCI)
 June 2023 Update

================

Labels: , , , , , , , , , , , , ,


--> www.FedPrimeRate.com Privacy Policy <--

>  SITEMAP  <

Tuesday, May 30, 2023

Consumer Confidence Index (CCI) for May 2023

Consumer Confidence Index® (CCI) for this month (May) was released by The Conference Board® this morning:

================

Predicted: 99.9
  • Actual: 102.3

================

Previous Month (revised): 103.7

  • Change from Previous Month: -1.35% (-1.4 points)
================

The "predicted" figure is what economists were expecting, while the "actual" is the true or real figure.

From Today's Report:

"...'Consumer confidence declined in May as consumers’ view of current conditions became somewhat less upbeat while their expectations remained gloomy,' said Ataman Ozyildirim, Senior Director, Economics at The Conference Board.' Their assessment of current employment conditions saw the most significant deterioration, with the proportion of consumers reporting jobs are ‘plentiful’ falling 4 percentage points from 47.5% in April to 43.5% in May. Consumers also became more downbeat about future business conditions, weighing on the expectations index. However, expectations for jobs and incomes over the next six months held relatively steady. While consumer confidence has fallen across all age and income categories over the past three months, May’s decline reflects a particularly notable worsening in the outlook among consumers over 55 years of age.' 

'Consumers’ inflation expectations remain elevated, but stable. Consumers in May expected inflation to average 6.1% over the next 12 months, essentially unchanged from 6.2% in April, though down substantially from the peak of 7.9% reached last year. Nonetheless, consumers continued to view inflation as a major influence on their view of the US economy. Plans to purchase homes in the next six months held steady in May at around 5.6 percent, but was still notably down from 6 to 7 percent in Q4 2022. Meanwhile, plans to purchase autos and big-ticket appliances ticked up somewhat compared to April.'..."

Every month, The Conference Board sends a questionnaire to 5,000 U.S. households. Survey participants are polled about their feelings regarding the U.S. economy, current and future, and about their own fiscal circumstances. On average, 3,500 participants complete and return the 5-question survey.

  • The baseline "100" score for the CCI is associated with 1985 survey data.


When consumers feel good about the economy, they tend to do more spending, and vice versa.

Based in New York City, The Conference Board is a private, not-for-profit organization with a mission to, "create and disseminate knowledge about management and the marketplace to help businesses strengthen their performance and better serve society."

The CCI is usually released on the last Tuesday of the month.

================   

CHART: Consumer Confidence Index (CCI) - May 2023 Update

CHART: Consumer Confidence Index (CCI)
 May 2023 Update

================

Labels: , , , , , , , , , , ,


--> www.FedPrimeRate.com Privacy Policy <--

>  SITEMAP  <

Friday, May 19, 2023

Leading Economic Index for April 2023

The Conference Board® released its Leading Economic Index® (LEI) for April 2023 this morning:

==============

Index for April 2023: 107.5 (The baseline 100 score is associated with 2016 data.)

==============

Predicted: -0.5%
  • Actual: -0.647% (-0.7 point)

==============

  • LEI for March 2023: 108.2

  • LEI for February 2023: 109.5

  • LEI for January 2023: 110.2

  • LEI for December 2022: 110.7

  • LEI for November 2022: 111.5

  • LEI for October 2022: 112.5

  • LEI for September 2022: 113.5

  • LEI for August 2022: 116.4

  • LEI for July 2022: 116.4

  • LEI for June 2022: 117.1

  • LEI for May 2022: 117.9

  • LEI for April 2022: 118.7

  • LEI for March 2022: 119.3

  • LEI for February 2022: 119.4

  • LEI for January 2022: 118.5

==============

The yellow-highlighted percentage is the month-to-month change for the index.  The "predicted" figure is what economists were expecting, while the "actual" is the true or real figure.

The LEI is a composite of 10 of the nation's economic data releases that's put together by The Conference Board. Statistically, the components listed below have shown a significant increase or decrease before national economic upturns or downturns:

  1. The Standard + Poor's 500 Index

  2. Average weekly claims for unemployment insurance

  3. Building permits for new private housing

  4. The interest rate spread between the yield on the benchmark 10-Year Treasury Note and Federal Funds

  5. ISM® Index of New Orders

  6. Manufacturer's new orders for consumer goods or materials

  7. Manufacturers' new orders, non-defense capital goods excluding aircraft orders

  8. Average weekly manufacturing hours

  9. Average consumer expectations for business conditions

  10. Leading Credit Index™

==============
 
CHART: Leading Economic Index 6-Month Growth Rate with Warning + Recession Signals  - April 2023 UPDATE
CHART: Leading Economic Index
6-Month Growth Rate
with Warning + Recession Signals
April 2023 UPDATE
 
==============
 
From Today's Report:

"...'The LEI for the US declined for the thirteenth consecutive month in April, signaling a worsening economic outlook,' said Justyna Zabinska-La Monica, Senior Manager, Business Cycle Indicators, at The Conference Board. 'Weaknesses among underlying components were widespread, but less so than in March’s reading, which resulted in a smaller decline.

Only stock prices and manufacturers’ new orders for both capital and consumer goods improved in April.

Importantly, the LEI continues to warn of an economic downturn this year. The Conference Board forecasts a contraction of economic activity starting in Q2 leading to a mild recession by mid-2023.'..."

==============
 

Labels: , , , , , , , , , ,


--> www.FedPrimeRate.com Privacy Policy <--

>  SITEMAP  <

Wednesday, April 26, 2023

Consumer Confidence Index (CCI) for April 2023

Consumer Confidence Index® (CCI) for this month (April 2023) was released by The Conference Board® this morning:

================

Predicted: 104.0
  • Actual: 101.3

================

Previous Month (revised): 104.0

  • Change from Previous Month: -2.6% (-2.7 points)
================

The "predicted" figure is what economists were expecting, while the "actual" is the true or real figure.

From Today's Report:

"...The Expectations Index, based on consumers’ short-term outlook for income, business, and labor market conditions fell to 68.1 (1985=100) from 74.0. The Expectations Index has now remained below 80 -- the level associated with a recession within the next year -- every month since February 2022, with the exception of a brief uptick in December 2022. The survey was fielded from April 3, about three weeks after the bank failures in the United States, to April 19.

'While consumers’ relatively favorable assessment of the current business environment improved somewhat in April, their expectations fell and remain below the level which often signals a recession looming in the short-term,' said Ataman Ozyildirim, Senior Director, Economics at The Conference Board. 'Consumers became more pessimistic about the outlook for both business conditions and labor markets. Compared to last month, fewer households expect business conditions to improve and more expect worsening of conditions in the next six months. They also expect fewer jobs to be available over the short term. April’s decline in consumer confidence reflects particular deterioration in expectations for consumers under 55 years of age and for households earning $50,000 and over.'

'Meanwhile, April’s results show consumer inflation expectations over the next 12 months remain essentially unchanged from March at 6.2 percent, although that level is down substantially from the peak of 7.9% reached last year, it is still elevated. Overall purchasing plans for homes, autos, appliances, and vacations all pulled back in April, a signal that consumers may be economizing amid growing pessimism.'..."

Every month, The Conference Board sends a questionnaire to 5,000 U.S. households. Survey participants are polled about their feelings regarding the U.S. economy, current and future, and about their own fiscal circumstances. On average, 3,500 participants complete and return the 5-question survey.

  • The baseline "100" score for the CCI is associated with 1985 survey data.


When consumers feel good about the economy, they tend to do more spending, and vice versa.

Based in New York City, The Conference Board is a private, not-for-profit organization with a mission to, "create and disseminate knowledge about management and the marketplace to help businesses strengthen their performance and better serve society."

The CCI is usually released on the last Tuesday of the month.

================   

 CHART: Consumer Confidence Index (CCI)
 April 2023 Update

================


Labels: , , , , , , , , , , ,


--> www.FedPrimeRate.com Privacy Policy <--

>  SITEMAP  <

Thursday, April 20, 2023

Leading Economic Index for March 2023

The Conference Board® released its Leading Economic Index® (LEI) for March 2023 this morning:

==============

Index for March 2023: 108.4 (The baseline 100 score is associated with 2016 data.)

==============

Predicted: -0.5%
  • Actual: -1.185% (-1.3 points)

==============

  • LEI for February 2023: 109.7

  • LEI for January 2023: 110.2

  • LEI for December 2022: 110.7

  • LEI for November 2022: 111.5

  • LEI for October 2022: 112.5

  • LEI for September 2022: 113.5

  • LEI for August 2022: 116.4

  • LEI for July 2022: 116.4

  • LEI for June 2022: 117.1

  • LEI for May 2022: 117.9

  • LEI for April 2022: 118.7

  • LEI for March 2022: 119.3

  • LEI for February 2022: 119.4

  • LEI for January 2022: 118.5

==============

The yellow-highlighted percentage is the month-to-month change for the index.  The "predicted" figure is what economists were expecting, while the "actual" is the true or real figure.

The LEI is a composite of 10 of the nation's economic data releases that's put together by The Conference Board. Statistically, the components listed below have shown a significant increase or decrease before national economic upturns or downturns:

  1. The Standard + Poor's 500 Index

  2. Average weekly claims for unemployment insurance

  3. Building permits for new private housing

  4. The interest rate spread between the yield on the benchmark 10-Year Treasury Note and Federal Funds

  5. ISM® Index of New Orders

  6. Manufacturer's new orders for consumer goods or materials

  7. Manufacturers' new orders, non-defense capital goods excluding aircraft orders

  8. Average weekly manufacturing hours

  9. Average consumer expectations for business conditions

  10. Leading Credit Index™

==============
 
CHART: Leading Economic Index 6-Month Growth Rate with Warning + Recession Signals - March 2023 UPDATE

CHART: Leading Economic Index
6-Month Growth Rate
with Warning + Recession Signals
 March 2023 UPDATE
 
==============
 
From Today's Report:

"...'The U.S. LEI fell to its lowest level since November of 2020, consistent with worsening economic conditions ahead,' said Justyna Zabinska-La Monica, Senior Manager, Business Cycle Indicators, at The Conference Board. 'The weaknesses among the index’s components were widespread in March and have been so over the past six months, which pushed the growth rate of the LEI deeper into negative territory.

Only stock prices and manufacturers’ new orders for consumer goods and materials contributed positively over the last six months.

The Conference Board forecasts that economic weakness will intensify and spread more widely throughout the US economy over the coming months, leading to a recession starting in mid-2023.'..
."

==============
 

Labels: , , , , , , , , , ,


--> www.FedPrimeRate.com Privacy Policy <--

>  SITEMAP  <

Wednesday, March 29, 2023

Consumer Confidence Index (CCI) for March 2023

Consumer Confidence Index® (CCI) for this month (March 2023) was released by The Conference Board® this morning:

================

Predicted: 102.0
  • Actual: 104.2

================

Previous Month (revised): 103.4

  • Change from Previous Month: +0.774% (+0.8 points)
================

The "predicted" figure is what economists were expecting, while the "actual" is the true or real figure.

From Today's Report:

"...'Driven by an uptick in expectations, consumer confidence improved somewhat in March, but remains below the average level seen in 2022 (104.5). The gain reflects an improved outlook for consumers under 55 years of age and for households earning $50,000 and over,' said Ataman Ozyildirim, Senior Director, Economics at The Conference Board.

'While consumers feel a bit more confident about what’s ahead, they are slightly less optimistic about the current landscape. The share of consumers saying jobs are ‘plentiful’ fell, while the share of those saying jobs are ‘not so plentiful’ rose. The latest results also reveal that their expectations of inflation over the next 12 months remains elevated -- at 6.3%. Overall purchasing plans for appliances continued to soften while automobile purchases saw a slight increase.'
..."

Every month, The Conference Board sends a questionnaire to 5,000 U.S. households. Survey participants are polled about their feelings regarding the U.S. economy, current and future, and about their own fiscal circumstances. On average, 3,500 participants complete and return the 5-question survey.

  • The baseline "100" score for the CCI is associated with 1985 survey data.


When consumers feel good about the economy, they tend to do more spending, and vice versa.

Based in New York City, The Conference Board is a private, not-for-profit organization with a mission to, "create and disseminate knowledge about management and the marketplace to help businesses strengthen their performance and better serve society."

The CCI is usually released on the last Tuesday of the month.


================  

CHART: Consumer Confidence Index (CCI) March 2023 Update

CHART: Consumer Confidence Index (CCI)
March 2023 Update

================


Labels: , , , , , , , , ,


--> www.FedPrimeRate.com Privacy Policy <--

>  SITEMAP  <

Wednesday, December 21, 2022

Consumer Confidence Index (CCI) for December 2022

Consumer Confidence Index® (CCI) for this month (December 2022) was released by The Conference Board® this morning:

================

Predicted: 105.0
  • Actual: 108.3

================

Previous Month (revised): 101.4

  • Change from Previous Month: +6.8% (+6.9 points)
================

The "predicted" figure is what economists were expecting, while the "actual" is the true or real figure.

From Today's Report:

"...'Consumer confidence bounced back in December, reversing consecutive declines in October and November to reach its highest level since April 2022,' said Lynn Franco, Senior Director of Economic Indicators at The Conference Board. 'The Present Situation and Expectations Indexes improved due to consumers’ more favorable view regarding the economy and jobs.

Inflation expectations retreated in December to their lowest level since September 2021, with recent declines in gas prices a major impetus. Vacation intentions improved but plans to purchase homes and big-ticket appliances cooled further. This shift in consumers’ preference from big-ticket items to services will continue in 2023, as will headwinds from inflation and interest rate hikes.'..."

Every month, The Conference Board sends a questionnaire to 5,000 U.S. households. Survey participants are polled about their feelings regarding the U.S. economy, current and future, and about their own fiscal circumstances. On average, 3,500 participants complete and return the 5-question survey.

  • The baseline "100" score for the CCI is associated with 1985 survey data.


When consumers feel good about the economy, they tend to do more spending, and vice versa.

Based in New York City, The Conference Board is a private, not-for-profit organization with a mission to, "create and disseminate knowledge about management and the marketplace to help businesses strengthen their performance and better serve society."

The CCI is usually released on the last Tuesday of the month.


================  

CHART: Consumer Confidence Index (CCI) - December 2022 Update

CHART: Consumer Confidence Index (CCI)
December 2022 Update

================

================


Labels: , , , , , , , , ,


--> www.FedPrimeRate.com Privacy Policy <--

>  SITEMAP  <

Wednesday, November 30, 2022

Consumer Confidence Index (CCI) for November 2022

Consumer Confidence Index® (CCI) for this month (November 2022) was released by The Conference Board® this morning:

================

Predicted: 100.0
  • Actual: 100.2

================

Previous Month (revised): 102.2

  • Change from Previous Month: -1.96% (-2.0 points)
================

The "predicted" figure is what economists were expecting, while the "actual" is the true or real figure.

From Today's Report:

"...'Consumer confidence declined again in November, most likely prompted by the recent rise in gas prices,' said Lynn Franco, Senior Director of Economic Indicators at The Conference Board. 'The Present Situation Index moderated further and continues to suggest the economy has lost momentum as the year winds down. Consumers’ expectations regarding the short-term outlook remained gloomy. Indeed, the Expectations Index is below a reading of 80, which suggests the likelihood of a recession remains elevated.'

'Inflation expectations increased to their highest level since July, with both gas and food prices as the main culprits. Intentions to purchase homes, automobiles, and big-ticket appliances all cooled. The combination of inflation and interest rate hikes will continue to pose challenges to confidence and economic growth into early 2023.'..."

Every month, The Conference Board sends a questionnaire to 5,000 U.S. households. Survey participants are polled about their feelings regarding the U.S. economy, current and future, and about their own fiscal circumstances. On average, 3,500 participants complete and return the 5-question survey.

  • The baseline "100" score for the CCI is associated with 1985 survey data.


When consumers feel good about the economy, they tend to do more spending, and vice versa.

Based in New York City, The Conference Board is a private, not-for-profit organization with a mission to, "create and disseminate knowledge about management and the marketplace to help businesses strengthen their performance and better serve society."

The CCI is usually released on the last Tuesday of the month.


================ 

 
CHART: Consumer Confidence Index (CCI) November 2022 Update
CHART: Consumer Confidence Index (CCI)
November 2022 Update

================

================


Labels: , , , , , , , , , , , ,


--> www.FedPrimeRate.com Privacy Policy <--

>  SITEMAP  <

Tuesday, October 25, 2022

Consumer Confidence Index (CCI) for October 2022

Consumer Confidence Index® (CCI) for this month (October 2022) was released by The Conference Board® this morning:

================

Predicted: 105.0
  • Actual: 102.5

================

Previous Month (revised): 107.8

  • Change from Previous Month: -4.92% (-5.3 points)
================

The "predicted" figure is what economists were expecting, while the "actual" is the true or real figure.

From Today's Report:

"...'Consumer confidence retreated in October, after advancing in August and September,' said Lynn Franco, Senior Director of Economic Indicators at The Conference Board. 'The Present Situation Index fell sharply, suggesting economic growth slowed to start Q4. Consumers’ expectations regarding the short-term outlook remained dismal. The Expectations Index is still lingering below a reading of 80 -- a level associated with recession -- suggesting recession risks appear to be rising.'

'Notably, concerns about inflation -- which had been receding since July -- picked up again, with both gas and food prices serving as main drivers. Vacation intentions cooled; however, intentions to purchase homes, automobiles, and big-ticket appliances all rose. Looking ahead, inflationary pressures will continue to pose strong headwinds to consumer confidence and spending, which could result in a challenging holiday season for retailers. And, given inventories are already in place, if demand falls short, it may result in steep discounting which would reduce retailers’ profit margins.'..."

Every month, The Conference Board sends a questionnaire to 5,000 U.S. households. Survey participants are polled about their feelings regarding the U.S. economy, current and future, and about their own fiscal circumstances. On average, 3,500 participants complete and return the 5-question survey.

  • The baseline "100" score for the CCI is associated with 1985 survey data.


When consumers feel good about the economy, they tend to do more spending, and vice versa.

Based in New York City, The Conference Board is a private, not-for-profit organization with a mission to, "create and disseminate knowledge about management and the marketplace to help businesses strengthen their performance and better serve society."

The CCI is usually released on the last Tuesday of the month.


================ 

CHART: Consumer Confidence Index (CCI) - October 2022 Update

CHART: Consumer Confidence Index (CCI)
October 2022 Update

================

================


Labels: , , , , , , , , , , , ,


--> www.FedPrimeRate.com Privacy Policy <--

>  SITEMAP  <

Friday, October 21, 2022

Leading Economic Index for September 2022

The Conference Board® released its Leading Economic Index® (LEI) for September 2022 this morning:

==============

Index for September 2022: 115.9 (The baseline 100 score is associated with 2016 data.)

==============

Predicted: -0.3%
  • Actual: -0.43% (-0.5 point)

==============

  • LEI for August 2022: 116.4

  • LEI for July 2022: 116.4

  • LEI for June 2022: 117.1

  • LEI for May 2022: 117.9

  • LEI for April 2022: 118.7

  • LEI for March 2022: 119.3

  • LEI for February 2022: 119.4

  • LEI for January 2022: 118.5

==============

The yellow-highlighted percentage is the month-to-month change for the index.  The "predicted" figure is what economists were expecting, while the "actual" is the true or real figure.

The LEI is a composite of 10 of the nation's economic data releases that's put together by The Conference Board. Statistically, the components listed below have shown a significant increase or decrease before national economic upturns or downturns:

  1. The Standard + Poor's 500 Index

  2. Average weekly claims for unemployment insurance

  3. Building permits for new private housing

  4. The interest rate spread between the yield on the benchmark 10-Year Treasury Note and Federal Funds

  5. ISM® Index of New Orders

  6. Manufacturer's new orders for consumer goods or materials

  7. Manufacturers' new orders, non-defense capital goods excluding aircraft orders

  8. Average weekly manufacturing hours

  9. Average consumer expectations for business conditions

  10. Leading Credit Index™

==============
 
 
CHART: Leading Economic Index 6-Month Growth Rate with Warning + Recession Signals September 2022 UPDATE

CHART: Leading Economic Index
6-Month Growth Rate
with Warning + Recession Signals
September 2022 UPDATE
 
==============
 
From Today's Report:

"...'The US LEI fell again in September and its persistent downward trajectory in recent months suggests a recession is increasingly likely before year end,' said Ataman Ozyildirim, Senior Director, Economics, at The Conference Board. 'The six-month growth rate of the LEI fell deeper into negative territory in September, and weaknesses among the leading indicators were widespread.

Amid high inflation, slowing labor markets, rising interest rates, and tighter credit conditions, The Conference Board forecasts real GDP growth will be 1.5 percent year-over-year in 2022, before slowing further in the first half of next year.'
..."

==============
 

Labels: , , , , , , , , , , , ,


--> www.FedPrimeRate.com Privacy Policy <--

>  SITEMAP  <

Tuesday, September 27, 2022

Consumer Confidence Index (CCI) for September 2022

Consumer Confidence Index® (CCI) for this month (September 2022) was released by The Conference Board® this morning:

================

Predicted: 105.0
  • Actual: 108.0

================

Previous Month (revised): 103.6

  • Change from Previous Month: +4.28% (+4.4 points)
================

The "predicted" figure is what economists were expecting, while the "actual" is the true or real figure.

From Today's Report:

"...The Conference Board Consumer Confidence Index® increased in September for the second consecutive month. The Index now stands at 108.0 (1985=100), up from 103.6 in August. The Present Situation Index -- based on consumers’ assessment of current business and labor market conditions -- rose to 149.6 from 145.3 last month. The Expectations Index -- based on consumers’ short-term outlook for income, business, and labor market conditions -- increased to 80.3 from 75.8.

'Consumer confidence improved in September for the second consecutive month supported in particular by jobs, wages, and declining gas prices,'said Lynn Franco, Senior Director of Economic Indicators at The Conference Board. 'The Present Situation Index rose again, after declining from April through July. The Expectations Index also improved from summer lows, but recession risks nonetheless persist. Concerns about inflation dissipated further in September -- prompted largely by declining prices at the gas pump -- and are now at their lowest level since the start of the year.'

'Meanwhile, purchasing intentions were mixed, with intentions to buy automobiles and big-ticket appliances up, while home purchasing intentions fell. The latter no doubt reflects rising mortgage rates and a cooling housing market. Looking ahead, the improvement in confidence may bode well for consumer spending in the final months of 2022, but inflation and interest-rate hikes remain strong headwinds to growth in the short term.'
..."

Every month, The Conference Board sends a questionnaire to 5,000 U.S. households. Survey participants are polled about their feelings regarding the U.S. economy, current and future, and about their own fiscal circumstances. On average, 3,500 participants complete and return the 5-question survey.

  • The baseline "100" score for the CCI is associated with 1985 survey data.


When consumers feel good about the economy, they tend to do more spending, and vice versa.

Based in New York City, The Conference Board is a private, not-for-profit organization with a mission to, "create and disseminate knowledge about management and the marketplace to help businesses strengthen their performance and better serve society."

The CCI is usually released on the last Tuesday of the month.


================ 

CHART: Consumer Confidence Index (CCI) - September 2022 Update

CHART: Consumer Confidence Index (CCI)
September 2022 Update

================

================


Labels: , , , , , , , , , , , ,


--> www.FedPrimeRate.com Privacy Policy <--

>  SITEMAP  <

Thursday, September 22, 2022

Leading Economic Index for August 2022

The Conference Board® released its Leading Economic Index® (LEI) for August 2022 this morning:

==============

Index for August 2022: 116.2 (The baseline 100 score is associated with 2016 data.)

==============

Predicted: -0.3%
  • Actual: -0.258% (-0.3 point)

==============

  • LEI for July 2022: 116.5

  • LEI for June 2022: 117.1

  • LEI for May 2022: 117.9

  • LEI for April 2022: 118.7

  • LEI for March 2022: 119.3

  • LEI for February 2022: 119.4

  • LEI for January 2022: 118.5

==============

The yellow-highlighted percentage is the month-to-month change for the index.  The "predicted" figure is what economists were expecting, while the "actual" is the true or real figure.

The LEI is a composite of 10 of the nation's economic data releases that's put together by The Conference Board. Statistically, the components listed below have shown a significant increase or decrease before national economic upturns or downturns:

  1. The Standard + Poor's 500 Index

  2. Average weekly claims for unemployment insurance

  3. Building permits for new private housing

  4. The interest rate spread between the yield on the benchmark 10-Year Treasury Note and Federal Funds

  5. ISM® Index of New Orders

  6. Manufacturer's new orders for consumer goods or materials

  7. Manufacturers' new orders, non-defense capital goods excluding aircraft orders

  8. Average weekly manufacturing hours

  9. Average consumer expectations for business conditions

  10. Leading Credit Index™

==============


CHART: Leading Economic Index 6-Month Growth Rate with Warning + Recession Signals August 2022 UPDATE
CHART: Leading Economic Index
6-Month Growth Rate
with Warning + Recession Signals
August 2022 UPDATE


==============


CHART: Year-on-Year Change in the Leading Economic Index + Real GDP August 2022 UPDATE
CHART: Year-on-Year Change
in the Leading Economic Index
+ Real GDP
August 2022 UPDATE


==============
 
From Today's Report:

"...'The US LEI declined for a sixth consecutive month potentially signaling a recession,' Ataman Ozyildirim, Senior Director, Economics, at The Conference Board. 'Among the index’s components, only initial unemployment claims and the yield spread contributed positively over the last six months—and the contribution of the yield spread has narrowed recently.'

'Furthermore, labor market strength is expected to continue moderating in the months ahead. Indeed, the average workweek in manufacturing contracted in four of the last six months -- a notable sign, as firms reduce hours before reducing their workforce. Economic activity will continue slowing more broadly throughout the US economy and is likely to contract. A major driver of this slowdown has been the Federal Reserve’s rapid tightening of monetary policy to counter inflationary pressures. The Conference Board projects a recession in the coming quarters.'.
.."

==============
 

Labels: , , , , , , , , , , , ,


--> www.FedPrimeRate.com Privacy Policy <--

>  SITEMAP  <

Thursday, August 18, 2022

Leading Economic Index for July 2022

The Conference Board® released its Leading Economic Index® (LEI) for July 2022 this morning:

==============

Index for July 2022: 116.6 (The baseline 100 score is associated with 2016 data.)

==============

Predicted: -0.5%
  • Actual: -0.427% (-0.5 point)

==============

  • LEI for June 2022: 117.1

  • LEI for May 2022: 117.9

  • LEI for April 2022: 118.7

  • LEI for March 2022: 119.3

  • LEI for February 2022: 119.4

  • LEI for January 2022: 118.5

==============

The yellow-highlighted percentage is the month-to-month change for the index.  The "predicted" figure is what economists were expecting, while the "actual" is the true or real figure.

The LEI is a composite of 10 of the nation's economic data releases that's put together by The Conference Board. Statistically, the components listed below have shown a significant increase or decrease before national economic upturns or downturns:

  1. The Standard + Poor's 500 Index

  2. Average weekly claims for unemployment insurance

  3. Building permits for new private housing

  4. The interest rate spread between the yield on the benchmark 10-Year Treasury Note and Federal Funds

  5. ISM® Index of New Orders

  6. Manufacturer's new orders for consumer goods or materials

  7. Manufacturers' new orders, non-defense capital goods excluding aircraft orders

  8. Average weekly manufacturing hours

  9. Average consumer expectations for business conditions

  10. Leading Credit Index™

==============

CHART: Leading Economic Index -- 6-Month Growth Rate with Warning + Recession Signals - July 2022 UPDATE

CHART: Leading Economic Index
6-Month Growth Rate
with Warning + Recession Signals
July 2022 UPDATE


==============
 
From Today's Report:

"...'The US LEI declined for a fifth consecutive month in July, suggesting recession risks are rising in the near term,' said Ataman Ozyildirim, Senior Director, Economics, The Conference Board. 'Consumer pessimism and equity market volatility as well as slowing labor markets, housing construction, and manufacturing new orders suggest that economic weakness will intensify and spread more broadly throughout the US economy. The Conference Board projects the US economy will not expand in the third quarter and could tip into a short but mild recession by the end of the year or early 2023.'..."

==============
 

Labels: , , , , , , , , , , , ,


--> www.FedPrimeRate.com Privacy Policy <--

>  SITEMAP  <

Friday, July 22, 2022

Leading Economic Index for June 2022

The Conference Board® released its Leading Economic Index® (LEI) for June 2022 this morning:

==============

Index for June 2022: 117.1 (The baseline 100 score is associated with 2016 data.)

==============

Predicted: -0.5%
  • Actual: -0.763% (-0.9 point)

==============

  • LEI for May 2022: 118.0

  • LEI for April 2022: 118.7

  • LEI for March 2022: 119.3

  • LEI for February 2022: 119.4

  • LEI for January 2022: 118.5

  • LEI for December 2021: 119.3

==============

The yellow-highlighted percentage is the month-to-month change for the index.  The "predicted" figure is what economists were expecting, while the "actual" is the true or real figure.

The LEI is a composite of 10 of the nation's economic data releases that's put together by The Conference Board. Statistically, the components listed below have shown a significant increase or decrease before national economic upturns or downturns:

  1. The Standard + Poor's 500 Index

  2. Average weekly claims for unemployment insurance

  3. Building permits for new private housing

  4. The interest rate spread between the yield on the benchmark 10-Year Treasury Note and Federal Funds

  5. ISM® Index of New Orders

  6. Manufacturer's new orders for consumer goods or materials

  7. Manufacturers' new orders, non-defense capital goods excluding aircraft orders

  8. Average weekly manufacturing hours

  9. Average consumer expectations for business conditions

  10. Leading Credit Index™

==============


CHART: Year-on-Year Change in the Leading Economic Index + Real GDP - June 2022 UPDATE

CHART: Year-on-Year Change in the Leading Economic Index
+ Real GDP
June 2022 UPDATE


  ==============
 
From Today's Report:

"...'The US LEI declined for a fourth consecutive month suggesting economic growth is likely to slow further in the near-term as recession risks grow,' said Ataman Ozyildirim, Senior Director of Economic Research at The Conference Board. 'Consumer pessimism about future business conditions, moderating labor market conditions, falling stock prices and weaker manufacturing new orders drove the LEI’s decline in June. The coincident economic index which rose in June suggests the economy grew through the second quarter. However, the forward-looking LEI points to a US economic downturn ahead.'

'Amid high
inflation and rapidly tightening monetary policy, The Conference Board expects economic growth will continue to cool throughout 2022. A US recession around the end of this year and early next is now likely. Accordingly, we’ve downgraded our forecast of 2022 annual Real GDP growth to 1.7% year-over-year (from 2.3 percent), while 2023 growth was downgraded to 0.5% YOY (from 1.8%).'..."

==============
 

Labels: , , , , , , , ,


--> www.FedPrimeRate.com Privacy Policy <--

>  SITEMAP  <

bing

bing

www.FedPrimeRate.com
Entire Website © 2023 FedPrimeRate.comSM


This website is neither affiliated nor associated with The United States Federal Reserve
in any way. Information in this website is provided for educational purposes only. The owners
of this website make no warranties with respect to any and all content contained within this
website. Consult a financial professional before making important decisions related to any
investment or loan product, including, but not limited to, business loans, personal loans,
education loans, first or second mortgages, credit cards, car loans or any type of insurance.