.comment-link {margin-left:.6em;}

Economy

Economic Data (USA)

Wednesday, May 14, 2025

NFIB Small Business Optimism Index (SBOI) for APRIL 2025

The National Federation of Independent Business® (NFIB®) released its Small Business Optimism Index (SBOI) for April 2025:
=========

Predicted: 95.0
  • Actual: 95.8

----------------

  • Change from Previous Month: -1.64 % (-1.6 points.)
  • Change from A Year Ago: +6.8% (+6.1 points.)

=========

CHART: NFIB Small Business Optimism Index - APRIL 2025 Update
CHART: NFIB Small Business Optimism Index
APRIL 2025 Update 

=========

  • The baseline "100" score is associated with 1986 survey data.
=========
 
From the Report:
 
"...The Small Business Optimism Index fell by 1.6 points in April to 95.8, the second consecutive month below the 51-year average of 98. Of the 10 Optimism Index components, three increased, six decreased, and one was unchanged. Expected business conditions and unfilled job openings contributed the most to the decline in the Index. The Uncertainty Index fell 4 points from March to 92...

CREDIT MARKETS
...A net 5% reported their last loan was harder to get than in previous attempts, down 1 point from March. Three percent reported that financing and interest rates were their top business problem in April, unchanged for the fourth consecutive month. A net 6% of owners reported paying a higher rate on their most recent loan, up 2 points from March. The average rate paid on short maturity loans was 8.9 percent, unchanged from March. Twenty-six percent of all owners reported borrowing on a regular basis, down 2 points from March. High mortgage rates have slowed housing activity, a damper on GDP growth. But loan availability is good....

..Very few small businesses export their goods and services, but millions acquire imported goods as inputs to their operations and those supply chains are currently at risk. Tariff policy is suddenly and dramatically changing relative prices (costs), and relative prices drive all decisions. Uncertainly remains elevated and thus caution clouds spending, hiring, and investing decisions. Currently, the Uncertainty Index stands at 92, the 51-year average is 68. The average since 2016 is 80..."
=========

  • Previous Month's SBOI: 97.4
  • SBOI, 12-Months Previous: 89.7
=========

=========

Labels: , , , , , , , ,


--> www.FedPrimeRate.com Privacy Policy <--

CLICK HERE to JUMP to the TOP of THIS PAGE

>  SITEMAP  <

Thursday, April 17, 2025

Import and Export Price Indexes for March 2025

The Labor Department's Bureau of Labor Statistics this morning released its report on U.S. Import and Export Price Indexes for March 2025:


===============

Import Prices
Previous Reading,
revised: +0.2%
Actual: -0.1%

  • Change From 12 Months Previous: +0.9%
    -- Year-on-year previous reading = +2.0%

===============

Export Prices
Previous Reading, revised: +0.5%
Actual: FLAT

  • Change From 12 Months Previous: +2.4%
    -- Year-on-year previous reading = +2.1%

===============
 
The above percentages, highlighted in yellow, represent the month-to-month change in prices for:

  • Imports: the cost of goods produced in other countries and sold in the United States.
  • Exports: the cost of goods produced in the USA and sold in other countries.


Together, these indexes offer insight into the status of inflation in the United States, and for the global economy as well. The "predicted" figure is what economists were expecting, while the "actual" is the true or real figure.

=================

CHART: Import Price Index MARCH - 2025 Update

CHART: Import Price Index
MARCH 2025 Update
================= 

CHART: Export Price Index - MARCH 2025 Update
CHART: Export Price Index
MARCH 2025 Update
===============

===============

Labels: , , , , , , , , , , , ,


--> www.FedPrimeRate.com Privacy Policy <--

CLICK HERE to JUMP to the TOP of THIS PAGE

>  SITEMAP  <

Tuesday, April 08, 2025

NFIB Small Business Optimism Index (SBOI) for MARCH 2025

The National Federation of Independent Business® (NFIB®) released its Small Business Optimism Index (SBOI) for March 2025:
=========

Predicted: 98.0

  • Actual: 97.4

----------------

  • Change from Previous Month: -3.28 % (-3.3 points.)
  • Change from A Year Ago: +10.06 % (+8.9 points.)

=========

CHART: NFIB Small Business Optimism Index - MARCH 2025 Update
CHART: NFIB Small Business Optimism Index
MARCH 2025 Update 

=========

  • The baseline "100" score is associated with 1986 survey data.
=========

  • Previous Month's SBOI: 100.7
  • SBOI, 12-Months Previous: 88.5
=========

=========

Labels: , , , , , , ,


--> www.FedPrimeRate.com Privacy Policy <--

CLICK HERE to JUMP to the TOP of THIS PAGE

>  SITEMAP  <

Tuesday, March 18, 2025

Import and Export Price Indexes for February 2025

The Labor Department's Bureau of Labor Statistics this morning released its report on U.S. Import and Export Price Indexes for February 2025:


===============

Import Prices
Previous Reading,
revised: +0.3%
Actual: +0.4%

  • Change From 12 Months Previous: +2.0%
    -- Year-on-year previous reading = +1.9%

===============

Export Prices
Previous Reading, revised: +1.3%
Actual: +0.1%

  • Change From 12 Months Previous: +2.1%
    -- Year-on-year previous reading = +2.7%

===============
 
The above percentages, highlighted in yellow, represent the month-to-month change in prices for:

  • Imports: the cost of goods produced in other countries and sold in the United States.
  • Exports: the cost of goods produced in the USA and sold in other countries.


Together, these indexes offer insight into the status of inflation in the United States, and for the global economy as well. The "predicted" figure is what economists were expecting, while the "actual" is the true or real figure.

=================

CHART: Import Price Index FEBRUARY 2025 Update
CHART: Import Price Index
FEBRUARY 2025 Update
================= 

CHART: Export Price Index FEBRUARY 2025 Update

CHART: Export Price Index
FEBRUARY 2025 Update
===============

===============

Labels: , , , , , , , , , ,


--> www.FedPrimeRate.com Privacy Policy <--

CLICK HERE to JUMP to the TOP of THIS PAGE

>  SITEMAP  <

Thursday, March 13, 2025

NFIB Small Business Optimism Index (SBOI) for FEBRUARY 2025

The National Federation of Independent Business® (NFIB®) released its Small Business Optimism Index (SBOI) for February 2025:
=========

Predicted: 99.0

  • Actual: 100.7

----------------

  • Change from Previous Month: -2.04 % (-2.1 points.)
  • Change from A Year Ago: +12.64 % (+11.3 points.)

=========

CHART: NFIB Small Business Optimism Index - FEBRUARY 2025 Update
CHART: NFIB Small Business Optimism Index
FEBRUARY 2025 Update 
========= 

CHART: NFIB Uncertainty Index - FEBRUARY 2025 UPDATE
CHART: NFIB Uncertainty Index
 FEBRUARY 2025 UPDATE
========= 

From Today's Report:

"...The Small Business Optimism Index fell by 2.1 points in February to 100.7, the fourth consecutive month above the 51-year average of 98 but is 4.4 points off its most recent peak of 105.1 in December. Of the 10 Optimism Index components, three increased and seven decreased. The Uncertainty Index rose 4 points to 104, the second highest reading. The Optimism Index moderated in February while their level of uncertainty spiked. Small business owners have experienced uncertainty whiplash over the last four months with the Index falling from October’s 110 reading to 86 in December and then back up to 104...

...Uncertainty is high and rising on Main Street and for many reasons. Those small business owners expecting better business conditions in the next six months dropped and the percent viewing the current period as a good time to expand fell, but remains well above where it was in the fall. Inflation remains a major problem, ranked second behind the top problem, labor quality..."

=========

  • The baseline "100" score is associated with 1986 survey data.
=========

  • Previous Month's SBOI: 102.8.
  • SBOI, 12-Months Previous: 89.4.
=========

=========

Labels: , , , , ,


--> www.FedPrimeRate.com Privacy Policy <--

CLICK HERE to JUMP to the TOP of THIS PAGE

>  SITEMAP  <

Monday, February 17, 2025

Import and Export Price Indexes for January 2025

The Labor Department's Bureau of Labor Statistics this morning released its report on U.S. Import and Export Price Indexes for January 2025:


===============

Import Prices
Previous Reading,
revised: +0.2%
Actual: +0.3

Change From 12 Months Previous: +1.9%

===============

Export Prices
Previous Reading, revised: +0.5%
Actual: +1.3%

Change From 12 Months Previous: +2.7%

===============
 
The above percentages, highlighted in yellow, represent the month-to-month change in prices for:

  • Imports: the cost of goods produced in other countries and sold in the United States.
  • Exports: the cost of goods produced in the USA and sold in other countries.


Together, these indexes offer insight into the status of inflation in the United States, and for the global economy as well. The "predicted" figure is what economists were expecting, while the "actual" is the true or real figure.

=================

CHART: Import Price Index - JANUARY 2025 Update

CHART: Import Price Index
JANUARY 2025 Update
================= 

CHART: Export Price Index - JANUARY 2025 Update

CHART: Export Price Index
JANUARY 2025 Update
===============

===============

Labels: , , , , , , , , , ,


--> www.FedPrimeRate.com Privacy Policy <--

CLICK HERE to JUMP to the TOP of THIS PAGE

>  SITEMAP  <

Friday, January 17, 2025

Import and Export Price Indexes for December 2024

The Labor Department's Bureau of Labor Statistics this morning released its report on U.S. Import and Export Price Indexes for December 2024:

===============

Import Prices
Previous Reading: +0.1%
Actual: +0.1

Change From 12 Months Previous: +2.2%

===============

Export Prices
Previous Reading: FLAT
Actual: +0.3%

Change From 12 Months Previous: +1.8 %

===============
 
The above percentages, highlighted in yellow, represent the month-to-month change in prices for:

  • Imports: the cost of goods produced in other countries and sold in the United States.
  • Exports: the cost of goods produced in the USA and sold in other countries.


Together, these indexes offer insight into the status of inflation in the United States, and for the global economy as well. The "predicted" figure is what economists were expecting, while the "actual" is the true or real figure.

=================

CHART: Import Price Index - DECEMBER 2024 Update
CHART: Import Price Index
DECEMBER 2024 Update
================= 

CHART: Export Price Index - DECEMBER 2024 Update
CHART: Export Price Index
DECEMBER 2024 Update
===============

===============

Labels: , , , , , , , , , ,


--> www.FedPrimeRate.com Privacy Policy <--

CLICK HERE to JUMP to the TOP of THIS PAGE

>  SITEMAP  <

Tuesday, August 13, 2024

NFIB Small Business Optimism Index (SBOI) for JULY 2024

The National Federation of Independent Business® (NFIB®) released its Small Business Optimism Index (SBOI) for July 2024:
=========

Predicted: 92.0

  • Actual: 93.7

----------------

  • Change from Previous Month: +2.4 % (+2.2 points.)
  • Change from 12 Months Previous: +1.96 % (+1.8 points.)

=========

CHART: NFIB Small Business Optimism Index - JULY 2024 Update

CHART: NFIB Small Business Optimism Index
JULY 2024 Update 

=========
 

From Today's Report:

"...The NFIB Small Business Optimism Index rose 2.2 points in July to 93.7, the highest reading since February 2022. However, this is the 31st consecutive month below the 50-year average of 98. Inflation remains the top issue among small business owners, with 25% reporting it as their single most important problem in operating their business, up four points from June.

'Despite this increase in optimism, the road ahead remains tough for the nation’s small business owners,' said NFIB Chief Economist Bill Dunkelberg. 'Cost pressures, especially labor costs, continue to plague small business operations, impacting their bottom line. Owners are heading towards unpredictable months ahead, not knowing how future economic conditions or government policies will impact them.'.
.."

=========

  • The baseline "100" score is associated with 1986 survey data.
=========

  • The previous month's SBOI was 91.5.
  • 12 months previous, the SBOI was 91.9.
=========

 
=========

Labels: , , , , ,


--> www.FedPrimeRate.com Privacy Policy <--

CLICK HERE to JUMP to the TOP of THIS PAGE

>  SITEMAP  <

Thursday, July 18, 2024

Import and Export Price Indexes for June 2024

The Labor Department's Bureau of Labor Statistics this morning released its report on U.S. Import and Export Price Indexes for June 2024:

===============

Import Prices
Previous Reading: -0.2% (revised)
Actual: FLAT

Change From 12 Months Previous: +1.6%

===============

Export Prices
Previous Reading: -0.7% (revised)
Actual: -0.5%

Change From 12 Months Previous: +0.7%

===============
 
The above percentages, highlighted in yellow, represent the month-to-month change in prices for:

  • Imports: the cost of goods produced in other countries and sold in the United States.
  • Exports: the cost of goods produced in the USA and sold in other countries.


Together, these indexes offer insight into the status of inflation in the United States, and for the global economy as well. The "predicted" figure is what economists were expecting, while the "actual" is the true or real figure.

=================

CHART: Import Price Index - June 2024 Update
CHART: Import Price Index
June 2024 Update

================= 

CHART: Export Price Index - June 2024 Update
CHART: Export Price Index
June 2024 Update

===
============

===============

Labels: , , , , , , , , , ,


--> www.FedPrimeRate.com Privacy Policy <--

CLICK HERE to JUMP to the TOP of THIS PAGE

>  SITEMAP  <

Saturday, May 18, 2024

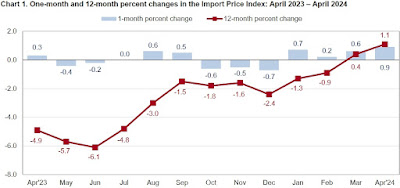
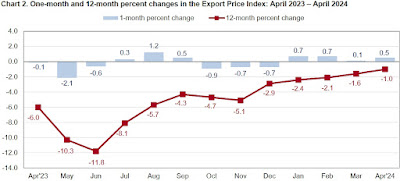
Import and Export Price Indexes for April 2024

The Labor Department's Bureau of Labor Statistics this morning released its report on U.S. Import and Export Price Indexes for April 2024:

===============

Import Prices
Previous Reading: +0.6% (revised)
Actual: +0.9%

Change From 12 Months Previous: +1.1%

===============

Export Prices
Previous Reading: +0.1% (revised)
Actual: +0.5%

Change From 12 Months Previous: -1.0%

===============
 
The above percentages, highlighted in yellow, represent the month-to-month change in prices for:

  • Imports: the cost of goods produced in other countries and sold in the United States.
  • Exports: the cost of goods produced in the USA and sold in other countries.


Together, these indexes offer insight into the status of inflation in the United States, and for the global economy as well. The "predicted" figure is what economists were expecting, while the "actual" is the true or real figure.

=================


CHART: Import Price Index - April 2024 Update

CHART: Import Price Index
April 2024 Update

================= 

CHART: Export Price Index - April 2024 Update

CHART: Export Price Index
April 2024 Update

===
============


===============


Labels: , , , , , , , , , ,


--> www.FedPrimeRate.com Privacy Policy <--

CLICK HERE to JUMP to the TOP of THIS PAGE

>  SITEMAP  <

Thursday, February 15, 2024

Import and Export Price Indexes for January 2024

The Labor Department's Bureau of Labor Statistics this morning released its report on U.S. Import and Export Price Indexes for January 2024:

===============

Import Prices
Previous Reading: -0.7% (revised)
Actual: +0.8%

Change From 12 Months Previous: -1.3%

===============

Export Prices
Previous Reading: -0.7% (revised)
Actual: +0.8%

Change From 12 Months Previous: -2.4%

===============
 
The above percentages, highlighted in yellow, represent the month-to-month change in prices for:

  • Imports: the cost of goods produced in other countries and sold in the United States.
  • Exports: the cost of goods produced in the USA and sold in other countries.


Together, these indexes offer insight into the status of inflation in the United States, and for the global economy as well. The "predicted" figure is what economists were expecting, while the "actual" is the true or real figure.

=================

 CHART: Import Price Index - January 2024 Update

CHART: Import Price Index
January 2024 Update

================= 

CHART: Export Price Index - January 2024 Update

CHART: Export Price Index
 January 2024 Update

===
============


===============

Labels: , , , , , , , , , ,


--> www.FedPrimeRate.com Privacy Policy <--

CLICK HERE to JUMP to the TOP of THIS PAGE

>  SITEMAP  <

Friday, September 15, 2023

Import and Export Price Indexes for August 2023

The Labor Department's Bureau of Labor Statistics this morning released its report on U.S. Import and Export Price Indexes for August 2023:

===============

Import Prices
Previous Reading:+0.1% (revised)
Actual: +0.5%

Change From 12 Months Previous: -3.0%

===============

Export Prices
Previous Reading: +0.5% (revised)
Actual: +1.3%

Change From 12 Months Previous: -5.5%

===============
 
The above percentages, highlighted in yellow, represent the month-to-month change in prices for:

  • Imports: the cost of goods produced in other countries and sold in the United States.
  • Exports: the cost of goods produced in the USA and sold in other countries.


Together, these indexes offer insight into the status of inflation in the United States, and for the global economy as well. The "predicted" figure is what economists were expecting, while the "actual" is the true or real figure.

=================

 CHART: Import Price Index - August 2023 Update

CHART: Import Price Index
August 2023 Update

================= 

CHART: Export Price Index - August 2023 Update

CHART: Export Price Index
 August 2023 Update

===
============


===============

Labels: , , , , , , , , , ,


--> www.FedPrimeRate.com Privacy Policy <--

CLICK HERE to JUMP to the TOP of THIS PAGE

>  SITEMAP  <

Friday, August 18, 2023

Import and Export Price Indexes for July 2023

The Labor Department's Bureau of Labor Statistics this morning released its report on U.S. Import and Export Price Indexes for July 2023:

===============

Import Prices
Previous Reading:-0.1% (revised)
Actual: +0.4%

Change From 12 Months Previous: -4.4%

===============

Export Prices
Previous Reading: -0.7% (revised)
Actual: +0.7%

Change From 12 Months Previous: -7.9%

===============
 
The above percentages, highlighted in yellow, represent the month-to-month change in prices for:

  • Imports: the cost of goods produced in other countries and sold in the United States.
  • Exports: the cost of goods produced in the USA and sold in other countries.


Together, these indexes offer insight into the status of inflation in the United States, and for the global economy as well. The "predicted" figure is what economists were expecting, while the "actual" is the true or real figure.

=================

 CHART: Import Price Index  July 2023 Update

CHART: Import Price Index
 July 2023 Update

================= 

HART: Export Price Index  July 2023 Update

CHART: Export Price Index
 July 2023 Update

===
============


===============

Labels: , , , , , , , , , ,


--> www.FedPrimeRate.com Privacy Policy <--

CLICK HERE to JUMP to the TOP of THIS PAGE

>  SITEMAP  <

Saturday, July 15, 2023

Import and Export Price Indexes for June 2023

The Labor Department's Bureau of Labor Statistics this morning released its report on U.S. Import and Export Price Indexes for June 2023:

===============

Import Prices
Previous Reading:-0.4% (revised)
Actual: -0.2%

Change From 12 Months Previous: -6.1%

===============

Export Prices
Previous Reading: -1.9%
Actual: -0.9%

Change From 12 Months Previous: -12.0%

===============
 
The above percentages, highlighted in yellow, represent the month-to-month change in prices for:

  • Imports: the cost of goods produced in other countries and sold in the United States.
  • Exports: the cost of goods produced in the USA and sold in other countries.


Together, these indexes offer insight into the status of inflation in the United States, and for the global economy as well. The "predicted" figure is what economists were expecting, while the "actual" is the true or real figure.

=================

 CHART: Import Price Index - June 2023 Update

CHART: Import Price Index
 June 2023 Update

================= 

CHART: Export Price Index - June 2023 Update

CHART: Export Price Index
 June 2023 Update

===
============


===============

Labels: , , , , , , , ,


--> www.FedPrimeRate.com Privacy Policy <--

CLICK HERE to JUMP to the TOP of THIS PAGE

>  SITEMAP  <

Tuesday, July 11, 2023

NFIB Small Business Optimism Index for June 2023

The National Federation of Independent Business® (NFIB®) released its Small Business Optimism Index for June 2023:

=========

Predicted: 90.0
Actual: 91.0

  • Change from Previous Month: +1.79% (+1.6 points.)
  • Change from 12 Months Previous: +1.68% (+1.5 points.)


=========

CHART: NFIB Small Business Optimism Index - June 2023 Update

CHART: NFIB Small Business Optimism Index
June 2023 Update 

=========
 

From Today's Report:

"...'Halfway through the year, small business owners remain very pessimistic about future business conditions and their sales prospects, said NFIB Chief Economist Bill Dunkelberg. 'Inflation and labor shortages continue to be great challenges for small businesses. Owners are still raising selling prices at an inflationary level to try to pass on higher inventory, labor, and energy costs.'...'

Key Findings Include:

    -- Forty-two percent of owners reported job openings that were hard to fill, down two points from May but remaining historically very high.


    -- Small business owners expecting better business conditions over the next six months improved 10 points from May to a net negative 40%, 21 percentage points better than last June’s reading of a net negative 61%.

    -- The net percent of owners who expect real sales to be higher improved seven points from May to a net negative 14%.
.."

=========

  • The baseline "100" score is associated with 1986 survey data.
=========

The previous month's Small Business Optimism Index was 89.4.

=========

 
=========

Labels: , , , , , , , , , ,


--> www.FedPrimeRate.com Privacy Policy <--

CLICK HERE to JUMP to the TOP of THIS PAGE

>  SITEMAP  <

Wednesday, May 11, 2022

NFIB Small Business Optimism Index for April 2022

The National Federation of Independent Business® (NFIB®) released its Small Business Optimism Index for April 2022:

=========

Predicted: 94.0
Actual: 93.2

  • Change from Previous Month: UNCHANGED
  • Change from 12 Months Previous: -6.613% (-6.6 points.)


=========

CHART: NFIB Small Business Optimism Index - April 2022 Update

CHART: NFIB Small Business Optimism Index
April 2022 Update 
=========
 
CHART: NFIB Small Business Earnings Last 3 Months - April 2022 Update

CHART: NFIB Small Business Earnings
Last 3 Months
April 2022 Update
=========

From Today's Report:

"...The NFIB Small Business Optimism Index was unchanged in April, remaining at 93.2 and the fourth consecutive month below the 48-year average of 98. Small business owners expecting better business conditions over the next six months decreased one point to a net negative 50%, the lowest level recorded in the 48-year-old survey.

Inflation continues to be a problem for small businesses with 32% of small business owners reporting it’s their single most important problem in operating their business, the highest reading since the fourth quarter of 1980.

'Small business owners are struggling to deal with inflation pressures,' said NFIB Chief Economist Bill Dunkelberg. 'The labor supply is not responding strongly to small businesses’ high wage offers and the impact of inflation has significantly disrupted business operations.'


Key Findings Include:

    -- Forty-seven percent of owners reported
job openings that could not be filled, unchanged from March.

    -- The net percent of owners raising average selling prices decreased two points to a net 70% (seasonally adjusted), two points below last month’s highest reading.

    -- The net percent of owners who expect real sales to be higher increased six points from March to a net negative 12%.

As reported in NFIB’s monthly jobs report, small businesses continue to struggle to find workers to fill open positions with 47% (seasonally adjusted) of all owners reported job openings they could not fill in the current period. Of those hiring or trying to hire, 93% of owners reported few or no qualified applicants for the positions they were trying to fill..."


=========

  • Small business survey questions can be found at the end of today's report.
  • The baseline "100" score is associated with 1986 survey data.
=========

The previous month's Small Business Optimism Index was 93.2.

=========

 
=========

Labels: , , , , , , , , , , ,


--> www.FedPrimeRate.com Privacy Policy <--

CLICK HERE to JUMP to the TOP of THIS PAGE

>  SITEMAP  <

bing

bing


SCAMS!

FedPrimeRate.com
Entire Website © 1999 - 2025 FedPrimeRate.comSM


This website is neither affiliated nor associated with The United States Federal Reserve
in any way. Information in this website is provided for educational purposes only. The owners
of this website make no warranties with respect to any and all content contained within this
website. Consult a financial professional before making important decisions related to any
investment or loan product, including, but not limited to, business loans, personal loans,
education loans, first or second mortgages, credit cards, car loans or any type of insurance.