.comment-link {margin-left:.6em;}

Economy

Economic Data (USA)

Friday, September 13, 2024

Producer Price Index - Final Demand (PPI-FD) for August 2024

The Producer Price Index - Final Demand (PPI-FD) for August 2024 was released this morning:

===============================

Previous Month: +0.1%

  • Actual: +0.2%

Change from 12 months previous:  +1.7%  (prior = +2.2%)

=============


Below is the PPI-FD when food, energy and trade services are removed:

Previous Month: +0.3%

  • Actual: +0.3%
Change from 12 months previous:  +3.3%  (prior = +3.3%)

===============================

The above, yellow-highlighted percentages represent the month-to-month change in prices received by domestic producers of goods and services, for goods, services and construction in the United States, for final demand.

Final Demand = personal consumption (consumers), exports, government purchases and capital investment.

The PPI-FD is released by the Labor Department's Bureau of Labor Statistics.

The "predicted" figure is what economists were expecting, while the "actual" is the true or real figure.


 ==============

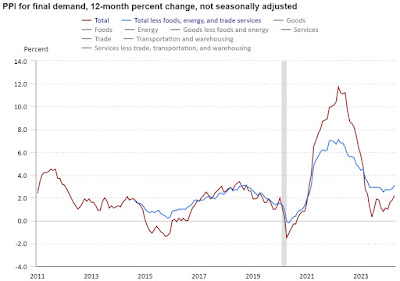
CHART: Producer Price Index, Final Demand (PPI-FD) 12-Month Percent Change - AUGUST 2024 Update
CHART: Producer Price Index
  Final Demand (PPI-FD)
12-Month Percent Change
AUGUST 2024 Update

==============

Labels: , , , , , ,


--> www.FedPrimeRate.com Privacy Policy <--

>  SITEMAP  <

Friday, July 12, 2024

Producer Price Index - Final Demand (PPI-FD) for June 2024

The Producer Price Index - Final Demand (PPI-FD) for June 2024 was released this morning:

===============================

Previous Month (revised): FLAT

  • Actual: +0.2%

Change from 12 months previous:  +2.6%  (prior = +2.2%)

=============


Below is the PPI-FD when food, energy and trade services are removed:

Previous Month (revised): +0.2%

  • Actual: FLAT
Change from 12 months previous:  +3.1%  (prior = +3.2%)

===============================

The above, yellow-highlighted percentages represent the month-to-month change in prices received by domestic producers of goods and services, for goods, services and construction in the United States, for final demand.

Final Demand = personal consumption (consumers), exports, government purchases and capital investment.

The PPI-FD is released by the Labor Department's Bureau of Labor Statistics.

The "predicted" figure is what economists were expecting, while the "actual" is the true or real figure.


 ==============

CHART: Producer Price Index   Final Demand (PPI-FD) 12-Month Percent Change - JUNE 2024 Update
CHART: Producer Price Index
  Final Demand (PPI-FD)
12-Month Percent Change
JUNE 2024 Update
==============

Labels: , , , , , ,


--> www.FedPrimeRate.com Privacy Policy <--

>  SITEMAP  <

Wednesday, May 15, 2024

Producer Price Index - Final Demand (PPI-FD) for April 2024

The Producer Price Index - Final Demand (PPI-FD) for April 2024 was released this morning:

Previous Month (unrevised): +0.2%
  • > Actual: +0.5%

Change from 12 months previous:  +2.2%  (prior = +2.1%)

=============

Below is the PPI-FD when food, energy and trade services are removed:

Previous Month (unrevised): +0.2%
  • > Actual: +0.4%
Change from 12 months previous:  +3.1%  (prior = +2.8%)

=============

The above, yellow-highlighted percentages represent the month-to-month change in prices received by domestic producers of goods and services, for goods, services and construction in the United States, for final demand.

Final Demand = personal consumption (consumers), exports, government purchases and capital investment.

The PPI-FD is released by the Labor Department's Bureau of Labor Statistics.

The "predicted" figure is what economists were expecting, while the "actual" is the true or real figure.


 ==============

CHART: Producer Price Index   Final Demand (PPI-FD) 12-Month Percent Change - APRIL 2024 Update
CHART: Producer Price Index
  Final Demand (PPI-FD)
12-Month Percent Change
APRIL 2024 Update
==============

Labels: , , , , , , , , ,


--> www.FedPrimeRate.com Privacy Policy <--

>  SITEMAP  <

Saturday, April 13, 2024

Producer Price Index - Final Demand (PPI-FD) March 2024

The Producer Price Index - Final Demand (PPI-FD) for March 2024 was released this morning:

Previous Month: +0.6%
Actual: +0.2%

Change from 12 months previous:  +2.1%

=============

Below is the PPI-FD when food, energy and trade services are removed:

Previous Month (revised): +0.3%
Actual: +0.2%

Change from 12 months previous:  +2.8%

=============

The above, yellow-highlighted percentages represent the month-to-month change in prices received by domestic producers of goods and services, for goods, services and construction in the United States, for final demand.

Final Demand = personal consumption (consumers), exports, government purchases and capital investment.

The PPI-FD is released by the Labor Department's Bureau of Labor Statistics.

The "predicted" figure is what economists were expecting, while the "actual" is the true or real figure.


 ==============

CHART: Producer Price Index   Final Demand (PPI-FD) 12-Month Percent Change - March 2024 Update
CHART: Producer Price Index
  Final Demand (PPI-FD)
12-Month Percent Change
March 2024 Update
==============

Labels: , , , , , , , , ,


--> www.FedPrimeRate.com Privacy Policy <--

>  SITEMAP  <

Saturday, March 16, 2024

Producer Price Index - Final Demand (PPI-FD) February 2024

The Producer Price Index - Final Demand (PPI-FD) for February 2024 was released this morning:

Previous Month: +0.3%
Actual: +0.6%

Change from 12 months previous:  +1.6%

=============

Below is the PPI-FD when food, energy and trade services are removed:

Previous Month: +0.6%
Actual: +0.4%

Change from 12 months previous:  +2.8%

=============

The above, yellow-highlighted percentages represent the month-to-month change in prices received by domestic producers of goods and services, for goods, services and construction in the United States, for final demand.

Final Demand = personal consumption (consumers), exports, government purchases and capital investment.

The PPI-FD is released by the Labor Department's Bureau of Labor Statistics.

The "predicted" figure is what economists were expecting, while the "actual" is the true or real figure.


 ==============

CHART: Producer Price Index   Final Demand (PPI-FD) 12-Month Percent Change - February 2024 Update
CHART: Producer Price Index
  Final Demand (PPI-FD)
12-Month Percent Change
February 2024 Update

Labels: , , , , , , , , ,


--> www.FedPrimeRate.com Privacy Policy <--

>  SITEMAP  <

Saturday, February 17, 2024

Producer Price Index - Final Demand (PPI-FD) for January 2024

The Producer Price Index - Final Demand (PPI-FD) for January 2024 was released this morning:

Previous Month: -0.1%
Actual: +0.3%

Change from 12 months previous:  +0.9%

=============

Below is the PPI-FD when food, energy and trade services are removed:

Previous Month: +0.2%
Actual: +0.6%

Change from 12 months previous:  +2.6%

=============

The above, yellow-highlighted percentages represent the month-to-month change in prices received by domestic producers of goods and services, for goods, services and construction in the United States, for final demand.

Final Demand = personal consumption (consumers), exports, government purchases and capital investment.

The PPI-FD is released by the Labor Department's Bureau of Labor Statistics.

The "predicted" figure is what economists were expecting, while the "actual" is the true or real figure.


 ==============

CHART: Producer Price Index   Final Demand (PPI-FD) 12-Month Percent Change - January 2024 Update

CHART: Producer Price Index
  Final Demand (PPI-FD)
12-Month Percent Change
January 2024 Update

Labels: , , , , , , , , ,


--> www.FedPrimeRate.com Privacy Policy <--

>  SITEMAP  <

Friday, November 17, 2023

Producer Price Index - Final Demand (PPI-FD) for October 2023

The Producer Price Index - Final Demand (PPI-FD) for October 2023 was released this morning:

Previous Month (revised): +0.4%
Actual: -0.5%

Change from 12 months previous:  +1.3%

=============

Below is the PPI-FD when food, energy and trade services are removed:

Previous Month (revised): +0.3%
Actual: +0.1%

Change from 12 months previous:  +2.9%

=============

The above, yellow-highlighted percentages represent the month-to-month change in prices received by domestic producers of goods and services, for goods, services and construction in the United States, for final demand.

Final Demand = personal consumption (consumers), exports, government purchases and capital investment.

The PPI-FD is released by the Labor Department's Bureau of Labor Statistics.

The "predicted" figure is what economists were expecting, while the "actual" is the true or real figure.


 ==============

CHART: Producer Price Index   Final Demand (PPI-FD) 12-Month Percent Change - October 2023 Update
CHART: Producer Price Index
  Final Demand (PPI-FD)
12-Month Percent Change
October 2023 Update

Labels: , , , , , , , , , , ,


--> www.FedPrimeRate.com Privacy Policy <--

>  SITEMAP  <

Thursday, September 14, 2023

Producer Price Index - Final Demand (PPI-FD) for August 2023

The Producer Price Index - Final Demand (PPI-FD) for August 2023 was released this morning:

Previous Month (revised): +0.4%
Actual: +0.7%

Change from 12 months previous:  +1.6%

=============

Below is the PPI-FD when food, energy and trade services are removed:

Previous Month (revised): +0.3%
Actual: +0.3%

Change from 12 months previous:  +3.0%

=============

The above, yellow-highlighted percentages represent the month-to-month change in prices received by domestic producers of goods and services, for goods, services and construction in the United States, for final demand.

Final Demand = personal consumption (consumers), exports, government purchases and capital investment.

The PPI-FD is released by the Labor Department's Bureau of Labor Statistics.

The "predicted" figure is what economists were expecting, while the "actual" is the true or real figure.


 ==============

 CHART: Producer Price Index Final Demand (PPI-FD) 12-Month Percent Change - August 2023 Update

CHART: Producer Price Index
  Final Demand (PPI-FD)
12-Month Percent Change
August 2023 Update

Labels: , , , , , , , , , , ,


--> www.FedPrimeRate.com Privacy Policy <--

>  SITEMAP  <

Monday, August 14, 2023

Producer Price Index - Final Demand (PPI-FD) for July 2023

The Producer Price Index - Final Demand (PPI-FD) for July 2023 was released this morning:

Previous Month (revised): FLAT
Actual: +0.3%

Change from 12 months previous:  +0.8%

=============

Below is the PPI-FD when food, energy and trade services are removed:

Previous Month: +0.1%
Actual: +0.2%

Change from 12 months previous:  +2.7%

=============

The above, yellow-highlighted percentages represent the month-to-month change in prices received by domestic producers of goods and services, for goods, services and construction in the United States, for final demand.

Final Demand = personal consumption (consumers), exports, government purchases and capital investment.

The PPI-FD is released by the Labor Department's Bureau of Labor Statistics.

The "predicted" figure is what economists were expecting, while the "actual" is the true or real figure.


 ==============

 CHART: Producer Price Index   Final Demand (PPI-FD) 12-Month Percent Change - July 2023 Update

CHART: Producer Price Index
  Final Demand (PPI-FD)
12-Month Percent Change
July 2023 Update

Labels: , , , , , , , , , , ,


--> www.FedPrimeRate.com Privacy Policy <--

>  SITEMAP  <

Friday, July 14, 2023

Producer Price Index - Final Demand (PPI-FD) for June 2023

The Producer Price Index - Final Demand (PPI-FD) for June 2023 was released this morning:

Previous Month: -0.4%
Actual: +0.1%

Change from 12 months previous:  +0.1%

=============

Below is the PPI-FD when food, energy and trade services are removed:

Previous Month: FLAT
Actual: +0.1%

Change from 12 months previous:  +2.6%

=============

The above, yellow-highlighted percentages represent the month-to-month change in prices received by domestic producers of goods and services, for goods, services and construction in the United States, for final demand.

Final Demand = personal consumption (consumers), exports, government purchases and capital investment.

The PPI-FD is released by the Labor Department's Bureau of Labor Statistics.

The "predicted" figure is what economists were expecting, while the "actual" is the true or real figure.


 ==============

 CHART: Producer Price Index   Final Demand (PPI-FD) 12-Month Percent Change - June 2023 Update

CHART: Producer Price Index
  Final Demand (PPI-FD)
12-Month Percent Change
June 2023 Update

Labels: , , , , , , , , , ,


--> www.FedPrimeRate.com Privacy Policy <--

>  SITEMAP  <

Wednesday, June 14, 2023

Producer Price Index - Final Demand (PPI-FD) for May 2023

The Producer Price Index - Final Demand (PPI-FD) for May 2023 was released this morning:

Previous Month: +0.2%
Actual: -0.3%

Change from 12 months previous:  +1.1%

=============

Below is the PPI-FD when food, energy and trade services are removed:

Previous Month: +0.1% (revised)
Actual: FLAT

Change from 12 months previous:  +2.8%

=============

The above, yellow-highlighted percentages represent the month-to-month change in prices received by domestic producers of goods and services, for goods, services and construction in the United States, for final demand.

Final Demand = personal consumption (consumers), exports, government purchases and capital investment.

The PPI-FD is released by the Labor Department's Bureau of Labor Statistics.

The "predicted" figure is what economists were expecting, while the "actual" is the true or real figure.


 ==============

 CHART: Producer Price Index   Final Demand (PPI-FD) 12-Month Percent Change - May 2023 Update

CHART: Producer Price Index
  Final Demand (PPI-FD)
12-Month Percent Change
May 2023 Update

Labels: , , , , , , ,


--> www.FedPrimeRate.com Privacy Policy <--

>  SITEMAP  <

Friday, May 12, 2023

Producer Price Index - Final Demand (PPI-FD) for April 2023

The Producer Price Index - Final Demand (PPI-FD) for April 2023 was released this morning:

Previous Month: -0.5%
Actual: +0.2%

Change from 12 months previous:  +2.3%

=============

Below is the PPI-FD when food, energy and trade services are removed:

Previous Month: +0.1%
Actual: +0.2%

Change from 12 months previous:  +3.4%

=============

The above, yellow-highlighted percentages represent the month-to-month change in prices received by domestic producers of goods and services, for goods, services and construction in the United States, for final demand.

Final Demand = personal consumption (consumers), exports, government purchases and capital investment.

The PPI-FD is released by the Labor Department's Bureau of Labor Statistics.

The "predicted" figure is what economists were expecting, while the "actual" is the true or real figure.


 ==============

 CHART: Producer Price Index  Final Demand (PPI-FD) - April 2023 Update

CHART: Producer Price Index
  Final Demand (PPI-FD)
 April 2023 Update

Labels: , , , , , , ,


--> www.FedPrimeRate.com Privacy Policy <--

>  SITEMAP  <

Friday, April 14, 2023

Producer Price Index - Final Demand (PPI-FD) for March 2023

The Producer Price Index - Final Demand (PPI-FD) for March 2023 was released this morning:

Previous Month: -0.1%
Actual: -0.5%

Change from 12 months previous:  +2.7%

=============

Below is the PPI-FD when food, energy and trade services are removed:

Previous Month: +0.2%
Actual: +0.1%

Change from 12 months previous:  +3.6%

=============

The above, yellow-highlighted percentages represent the month-to-month change in prices received by domestic producers of goods and services, for goods, services and construction in the United States, for final demand.

Final Demand = personal consumption (consumers), exports, government purchases and capital investment.

The PPI-FD is released by the Labor Department's Bureau of Labor Statistics.

The "predicted" figure is what economists were expecting, while the "actual" is the true or real figure.


 ==============

 CHART: Producer Price Index - Final Demand (PPI-FD) - March 2023 Update

CHART: Producer Price Index
 Final Demand (PPI-FD)
 March 2023 Update

==============

Labels: , , , , , , , , , , ,


--> www.FedPrimeRate.com Privacy Policy <--

>  SITEMAP  <

Tuesday, November 15, 2022

Producer Price Index - Final Demand (PPI-FD) for October 2022

The Producer Price Index - Final Demand (PPI-FD) for October 2022 was released this morning:

Predicted: +0.4%
Actual: +0.2%

Change from 12 months previous:  +8.0%

=============

Below is the PPI-FD when food, energy and trade services are removed:

Predicted: +0.3%
Actual: +0.2%

Change from 12 months previous:  +5.4%

=============

The above, yellow-highlighted percentages represent the month-to-month change in prices received by domestic producers of goods and services, for goods, services and construction in the United States, for final demand.

Final Demand = personal consumption (consumers), exports, government purchases and capital investment.

The PPI-FD is released by the Labor Department's Bureau of Labor Statistics.

The "predicted" figure is what economists were expecting, while the "actual" is the true or real figure.


==============

Labels: , , , , , , , , , , ,


--> www.FedPrimeRate.com Privacy Policy <--

>  SITEMAP  <

Thursday, August 11, 2022

Producer Price Index - Final Demand (PPI-FD) for July 2022

The Producer Price Index - Final Demand (PPI-FD) for July 2022 was released this morning:

Predicted: FLAT
Actual: -0.5%

Change from 12 months previous:  +9.8%

=============

Below is the PPI-FD when food, energy and trade services are removed:

Predicted: +0.3%
Actual: +0.2%

Change from 12 months previous:  +5.8%

=============

The above, yellow-highlighted percentages represent the month-to-month change in prices received by domestic producers of goods and services, for goods, services and construction in the United States, for final demand.

Final Demand = personal consumption (consumers), exports, government purchases and capital investment.

The PPI-FD is released by the Labor Department's Bureau of Labor Statistics.

The "predicted" figure is what economists were expecting, while the "actual" is the true or real figure.

==============


CHART: Producer Price Index  Final Demand (PPI-FD) 12 Month Percent Changes July 2022 Update
CHART: Producer Price Index
  Final Demand (PPI-FD)
12 Month Percent Changes
July 2022 Update


 ==============


Labels: , , , , , , , , , , ,


--> www.FedPrimeRate.com Privacy Policy <--

>  SITEMAP  <

Friday, July 15, 2022

Producer Price Index - Final Demand (PPI-FD) for June 2022

The Producer Price Index - Final Demand (PPI-FD) for June 2022 was released this morning:

Predicted: +1.0%
Actual: +1.1%

Change from 12 months previous:  +11.3%

=============

Below is the PPI-FD when food, energy and trade services are removed:

Predicted: +0.5%
Actual: +0.3%

Change from 12 months previous:  +6.4%

=============

The above, yellow-highlighted percentages represent the month-to-month change in prices received by domestic producers of goods and services, for goods, services and construction in the United States, for final demand.

Final Demand = personal consumption (consumers), exports, government purchases and capital investment.

The PPI-FD is released by the Labor Department's Bureau of Labor Statistics.

The "predicted" figure is what economists were expecting, while the "actual" is the true or real figure.

==============


CHART: Producer Price Index | Final Demand (PPI-FD) 12 Month Percent Changes - June 2022 Update

CHART: Producer Price Index
 Final Demand (PPI-FD)
12 Month Percent Changes
June 2022 Update

 ==============


Labels: , , , , , , , , , , ,


--> www.FedPrimeRate.com Privacy Policy <--

>  SITEMAP  <

Tuesday, June 14, 2022

Producer Price Index - Final Demand (PPI-FD) for May 2022

The Producer Price Index - Final Demand (PPI-FD) for May 2022 was released this morning:

Predicted: +0.6%
Actual: +0.8%

Change from 12 months previous:  +10.8%

=============

Below is the PPI-FD when food, energy and trade services are removed:

Predicted: +0.5%
Actual: +0.5%

Change from 12 months previous:  +6.8%

=============

The above, yellow-highlighted percentages represent the month-to-month change in prices received by domestic producers of goods and services, for goods, services and construction in the United States, for final demand.

Final Demand = personal consumption (consumers), exports, government purchases and capital investment.

The PPI-FD is released by the Labor Department's Bureau of Labor Statistics.

The "predicted" figure is what economists were expecting, while the "actual" is the true or real figure.

==============


CHART: Producer Price Index | Final Demand (PPI-FD) 12 Month Percent Changes - May 2022 Update

CHART: Producer Price Index | Final Demand (PPI-FD)
12 Month Percent Changes
May 2022 Update

 ==============

Labels: , , , , , , , , , , ,


--> www.FedPrimeRate.com Privacy Policy <--

>  SITEMAP  <

Thursday, May 12, 2022

Producer Price Index - Final Demand (PPI-FD) for April 2022

The Producer Price Index - Final Demand (PPI-FD) for April 2022 was released this morning:

Predicted: +0.6%
Actual: +0.5%

Change from 12 months previous:  +11.0%

=============

Below is the PPI-FD when food, energy and trade services are removed:

Predicted: +0.7%
Actual: +0.6%

Change from 12 months previous:  +6.9%

=============

The above, yellow-highlighted percentages represent the month-to-month change in prices received by domestic producers of goods and services, for goods, services and construction in the United States, for final demand.

Final Demand = personal consumption (consumers), exports, government purchases and capital investment.

The PPI-FD is released by the Labor Department's Bureau of Labor Statistics.

The "predicted" figure is what economists were expecting, while the "actual" is the true or real figure.

==============


CHART: Producer Price Index | Final Demand (PPI-FD) 12 Month Percent Changes - April 2022 Update

CHART: Producer Price Index | Final Demand (PPI-FD)
12 Month Percent Changes
April 2022 Update

 ==============


Labels: , , , , , , , , , , ,


--> www.FedPrimeRate.com Privacy Policy <--

>  SITEMAP  <

Wednesday, April 13, 2022

Producer Price Index - Final Demand (PPI-FD) for March 2022

The Producer Price Index - Final Demand (PPI-FD) for March 2022 was released this morning:

Predicted: +1.0%
Actual: +1.4%

Change from 12 months previous:  +11.2%

=============

Below is the PPI-FD when food, energy and trade services are removed:

Predicted: +0.7%
Actual: +0.9%

Change from 12 months previous:  +7.0%

=============

The above, yellow-highlighted percentages represent the month-to-month change in prices received by domestic producers of goods and services, for goods, services and construction in the United States, for final demand.

Final Demand = personal consumption (consumers), exports, government purchases and capital investment.

The PPI-FD is released by the Labor Department's Bureau of Labor Statistics.

The "predicted" figure is what economists were expecting, while the "actual" is the true or real figure.

==============

From Today's Report:

"...The Producer Price Index for final demand increased 1.4 percent in March, seasonally adjusted, the U.S. Bureau of Labor Statistics reported today. This rise followed advances of 0.9 percent in February and 1.2 percent in January. On an unadjusted basis, final demand prices moved up 11.2 percent for the 12 months ended in March, the largest increase since 12-month data were first calculated in November 2010..."

==============

 
CHART: Producer Price Index | Final Demand (PPI-FD) 12 Month Percent Changes - March 2022 Update

CHART: Producer Price Index | Final Demand (PPI-FD)
12 Month Percent Changes
March 2022 Update

 ==============


Labels: , , , , , , , , , , ,


--> www.FedPrimeRate.com Privacy Policy <--

>  SITEMAP  <

Tuesday, March 15, 2022

Producer Price Index - Final Demand (PPI-FD) for February 2022

The Producer Price Index - Final Demand (PPI-FD) for February 2022 was released this morning:

Predicted: +0.9%
Actual: +0.8%

Change from 12 months previous:  +10.0%

=============

Below is the PPI-FD when food, energy and trade services are removed:

Predicted: +0.5%
Actual: +0.2%

Change from 12 months previous:  +6.6%

=============

The above, yellow-highlighted percentages represent the month-to-month change in prices received by domestic producers of goods and services, for goods, services and construction in the United States, for final demand.

Final Demand = personal consumption (consumers), exports, government purchases and capital investment.

The PPI-FD is released by the Labor Department's Bureau of Labor Statistics.

The "predicted" figure is what economists were expecting, while the "actual" is the true or real figure.

==============

 
CHART: Producer Price Index Final Demand (PPI-FD) 12 Month Percent Changes - February 2022 Update
CHART: Producer Price Index | Final Demand
(PPI-FD) 12 Month Percent Changes
February 2022 Update

 ==============


Labels: , , , , , , , , , ,


--> www.FedPrimeRate.com Privacy Policy <--

>  SITEMAP  <

bing

bing

www.FedPrimeRate.com
Entire Website © 2024 FedPrimeRate.comSM


This website is neither affiliated nor associated with The United States Federal Reserve
in any way. Information in this website is provided for educational purposes only. The owners
of this website make no warranties with respect to any and all content contained within this
website. Consult a financial professional before making important decisions related to any
investment or loan product, including, but not limited to, business loans, personal loans,
education loans, first or second mortgages, credit cards, car loans or any type of insurance.