.comment-link {margin-left:.6em;}

Economy

Economic Data (USA)

Tuesday, August 22, 2023

Existing Home Sales During July 2023

The Existing Home Sales report for July 2023 was released by The National Association of Realtors® (NAR®) this morning:

======================

Previous Month: 4,160,000

  • Actual: 4,070,000
======================

  •  Change from Previous Month: -2.16% (-9,000 homes)

  •  Change from A Year Ago: -16.6% (-81,000 homes)
==========

Inventory: 1,110,000 (3.3 months supply.)

==========

The yellow-highlighted, "actual" figure above represents the preliminary, seasonally adjusted annualized sales count of existing homes, co-ops and condominiums for the indicated month. The "predicted" figure is what economists were expecting, while the "actual" is the true or real figure.

------------------------------------------------------

  • Median Price: $406,700

  • Price Change from A Year Ago: +1.93% (+$7,000)


------------------------------------------------------ 

==========


==========

From Today's Report:

"...'Two factors are driving current sales activity – inventory availability and mortgage rates,' said NAR Chief Economist Lawrence Yun. 'Unfortunately, both have been unfavorable to buyers.'

'Most homeowners continue to enjoy large wealth gains from recent years with little concern about home price declines,' Yun said. 'However, many renters are concerned as they’re facing growing affordability challenges because of high interest rates.'

According to Freddie Mac, the 30-year fixed-rate mortgage averaged 7.09% as of August 17. That’s up from 6.96% the prior week and 5.13% one year ago.
.."

==================


==================

INFOGRAPHIC: Existing Home Sales - July 2023 UPDATE

INFOGRAPHIC: Existing Home Sales
July 2023 UPDATE


==================


==================

Labels: , , , , , , , , ,


--> www.FedPrimeRate.com Privacy Policy <--

>  SITEMAP  <

Thursday, September 22, 2022

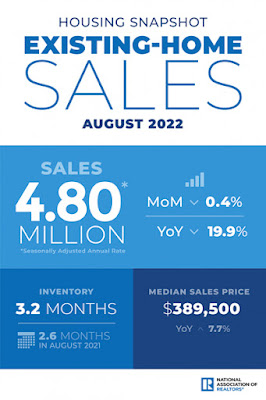
Existing Home Sales During August 2022

The Existing Home Sales report for August 2022 was released by The National Association of Realtors® (NAR®) this morning:

Predicted: 4,800,000
  • Actual: 4,800,000
==========

  •  Change from Previous Month: -0.415% (-20,000 homes)

  •  Change from A Year Ago: -19.87% (-1,190,000 homes)
==========

Inventory: 1,280,000 (3.2 months supply.)

==========

The yellow-highlighted, "actual" figure above represents the preliminary, seasonally adjusted annualized sales count of existing homes, co-ops and condominiums for the indicated month. The "predicted" figure is what economists were expecting, while the "actual" is the true or real figure.

------------------------------------------------------

  • Median Price: $389,500

  • Price Change from A Year Ago: +7.75% (+$28,000)


------------------------------------------------------ 

==========


==========

From Today's Report:

"...'The housing sector is the most sensitive to and experiences the most immediate impacts from the Federal Reserve's interest rate policy changes,' said NAR Chief Economist Lawrence Yun. 'The softness in home sales reflects this year's escalating mortgage rates. Nonetheless, homeowners are doing well with near nonexistent distressed property sales and home prices still higher than a year ago.'


'Inventory will remain tight in the coming months and even for the next couple of years,' Yun added. 'Some homeowners are unwilling to trade up or trade down after locking in historically-low
mortgage rates in recent years, increasing the need for more new-home construction to boost supply.'


The median existing-home price for all housing types in August was $389,500, a 7.7% jump from August 2021 ($361,500), as prices ascended in all regions. This marks 126 consecutive months of year-over-year increases, the longest-running streak on record. However, it was the second month in a row that the median sales price retracted after reaching a record high of $413,800 in June, the usual seasonal trend of prices declining after peaking in the early summer.


Properties typically remained on the market for 16 days in August, up from 14 days in July and down from 17 days in August 2021. Eighty-one percent of homes sold in August 2022 were on the market for less than a month.
.."

==================


==================
 
INFOGRAPHIC: Existing Home Sales - August 2022 UPDATE
INFOGRAPHIC: Existing Home Sales
August 2022 UPDATE

 
==================


Labels: , , , , , , , , , , , ,


--> www.FedPrimeRate.com Privacy Policy <--

>  SITEMAP  <

Friday, August 19, 2022

Existing Home Sales During July 2022

The Existing Home Sales report for July 2022 was released by The National Association of Realtors® (NAR®) this morning:

Predicted: 5,000,000
  • Actual: 4,810,000
==========

  •  Change from Previous Month: -5.87% (-300,000 homes)

  •  Change from A Year Ago: -20.23% (-1,220,000 homes)
==========

Inventory: 1,310,000 (3.3 months supply.)

==========

The yellow-highlighted, "actual" figure above represents the preliminary, seasonally adjusted annualized sales count of existing homes, co-ops and condominiums for the indicated month. The "predicted" figure is what economists were expecting, while the "actual" is the true or real figure.

------------------------------------------------------

  • Median Price: $403,800

  • Price Change from A Year Ago: +10.75% (+$39,200)


------------------------------------------------------ 

==========


==========

From Today's Report:

"...'The ongoing sales decline reflects the impact of the mortgage rate peak of 6% in early June,' said NAR Chief Economist Lawrence Yun. 'Home sales may soon stabilize since mortgage rates have fallen to near 5%, thereby giving an additional boost of purchasing power to home buyers.'

'We're witnessing a housing recession in terms of declining home sales and home building,' Yun added. 'However, it's not a recession in home prices. Inventory remains tight and prices continue to rise nationally with nearly 40% of homes still commanding the full list price.'

Properties typically remained on the market for 14 days in July, the same as in June and down from 17 days in July 2021. The 14 days on market are the fewest since NAR began tracking it in May 2011. Eighty-two percent of homes sold in July 2022 were on the market for less than a month.

Realtor.com®'s Market Trends Report in July shows that the largest year-over-year median list price growth occurred in Miami (+36.2%), Memphis (+32.7%) and Orlando (+28.4%). Phoenix reported the highest increase in the share of homes that had their prices reduced compared to last year (+31.8 percentage points), followed by Las Vegas (+28.6 percentage points) and Austin (+27.8 percentage points).
.."

==================


==================
 
INFOGRAPHIC: Existing Home Sales - July 2022 UPDATE
INFOGRAPHIC: Existing Home Sales
July 2022 UPDATE


==================


Labels: , , , , , , , , , , , ,


--> www.FedPrimeRate.com Privacy Policy <--

>  SITEMAP  <

Wednesday, July 20, 2022

Existing Home Sales During June 2022

The Existing Home Sales report for June 2022 was released by The National Association of Realtors® (NAR®) this morning:

Predicted: 5,400,000
  • Actual: 5,120,000
==========

  •  Change from Previous Month: -5.36% (-29,000 homes)

  •  Change from A Year Ago: -14.24% (-85,000 homes)
==========

Inventory: 1,260,000 (3.0 months supply; +20.0% year-on-year.)

==========

The yellow-highlighted, "actual" figure above represents the preliminary, seasonally adjusted annualized sales count of existing homes, co-ops and condominiums for the indicated month. The "predicted" figure is what economists were expecting, while the "actual" is the true or real figure.

------------------------------------------------------

  • Median Price: $416,000 (New Record-High)

  • Price Change from A Year Ago: +13.38% (+$49,100)


------------------------------------------------------ 

==========


==========

From Today's Report:

"...'Falling housing affordability continues to take a toll on potential home buyers,' said NAR Chief Economist Lawrence Yun. 'Both mortgage rates and home prices have risen too sharply in a short span of time.'

'Finally, there are more homes on the market,' Yun added. 'Interestingly though, the record-low pace of days on market implies a fuzzier picture on home prices. Homes priced right are selling very quickly, but homes priced too high are deterring prospective buyers.'

First-time buyers were responsible for 30% of sales in June, up from 27% in May and down from 31% in June 2021. NAR's 2021 Profile of Home Buyers and Sellers reported that the annual share of first-time buyers was 34%.

All-cash sales accounted for 25% of transactions in June, the same share as in May and up from 23% in June 2021.

Distressed sales --
foreclosures and short sales -- represented less than 1% of sales in June, essentially unchanged from May 2022 and June 2021.

'If consumer price inflation continues to rise, then mortgage rates will move higher,' Yun said. 'Rates will stabilize only when signs of peak inflation appear. If inflation is contained, then
mortgage rates may even decline somewhat.'..."

==================


==================
 
INFOGRAPHIC: Existing Home Sales - June 2022 UPDATE

INFOGRAPHIC: Existing Home Sales
June 2022 UPDATE


==================


Labels: , , , , , , , , , , ,


--> www.FedPrimeRate.com Privacy Policy <--

>  SITEMAP  <

Wednesday, June 22, 2022

Existing Home Sales During May 2022

The Existing Home Sales report for May 2022 was released by The National Association of Realtors® (NAR®) this morning:

Predicted: 5,400,000
Actual: 5,410,000

  •  Change from Previous Month: -3.39% (-190,000 homes)

  •  Change from One Year Previous: -8.61% (-510,000 homes)
==========

Inventory: 1,160,000 (2.6 months supply; -4.1% year-on-year.)

==========

The yellow-highlighted, "actual" figure above represents the preliminary, seasonally adjusted annualized sales count of existing homes, co-ops and condominiums for the indicated month. The "predicted" figure is what economists were expecting, while the "actual" is the true or real figure.

------------------------------------------------------

  • Median Price During May 2022: $407,600 (New Record-High)

  • Price Change from One Year Previous: +14.82% (+$52,600)


------------------------------------------------------ 

==========


==========

From Today's Report:

"...'Home sales have essentially returned to the levels seen in 2019 – prior to the pandemic – after two years of gangbuster performance,' said NAR Chief Economist Lawrence Yun. 'Also, the market movements of single-family and condominium sales are nearly equal, possibly implying that the preference towards suburban living over city life that had been present over the past two years is fading with a return to pre-pandemic conditions.'

'Further sales declines should be expected in the upcoming months given housing affordability challenges from the sharp rise in
mortgage rates this year,' Yun added. 'Nonetheless, homes priced appropriately are selling quickly and inventory levels still need to rise substantially -- almost doubling -- to cool home price appreciation and provide more options for home buyers.'


Properties typically remained on the market for 16 days in May, down from 17 days in April and 17 days in May 2021. Eighty-eight percent of homes sold in May 2022 were on the market for less than a month.

All-cash sales accounted for 25% of transactions in May, down from 26% in April and up from 23% recorded in May 2021.

Distressed sales --
foreclosures and short sales -- represented less than 1% of sales in May, essentially unchanged from April 2022 and May 2021.

Realtor.com®'s Market Trends Report(link is external) in May shows that the largest year-over-year median list price growth occurred in Miami (+45.9%), Nashville (+32.5%), and Orlando (+32.4%). Austin reported the highest growth in the share of homes that had their prices reduced compared to last year (+14.7 percentage points), followed by Las Vegas (+12.3 percentage points) and Phoenix (+11.6 percentage points)
..."

==================


==================
  
INFOGRAPHIC: Existing Home Sales During May 2022
INFOGRAPHIC: Existing Home Sales
May 2022 UPDATE


==================


Labels: , , , , , , , , , , ,


--> www.FedPrimeRate.com Privacy Policy <--

>  SITEMAP  <

Thursday, May 19, 2022

Existing Home Sales During April 2022

The Existing Home Sales report for April 2022 was released by The National Association of Realtors® (NAR®) this morning:

Predicted: 5,600,000
Actual: 5,610,000

  •  Change from Previous Month: -2.435% (-140,000 homes)

  •  Change from One Year Previous: -5.872% (-350,000 homes)
==========

Inventory: 1,030,000 (2.2 months supply; -4.3% year-on-year.)

==========

The yellow-highlighted, "actual" figure above represents the preliminary, seasonally adjusted annualized sales count of existing homes, co-ops and condominiums for the indicated month. The "predicted" figure is what economists were expecting, while the "actual" is the true or real figure.

------------------------------------------------------

Median Price for A Used Home During April 2022: $391,200

Change from One Year Previous: +14.822% (+$50,500)

---------

Average Price for A Used Home During April 2022: $397,600

Change from One Year Previous: +9.2% (+$33,500)

------------------------------------------------------ 

==========


==========

From Today's Report:

"...Higher home prices and sharply higher mortgage rates have reduced buyer activity,' said Lawrence Yun, NAR's chief economist. 'It looks like more declines are imminent in the upcoming months, and we'll likely return to the pre-pandemic home sales activity after the remarkable surge over the past two years.'

'Housing supply has started to improve, albeit at an extremely sluggish pace,' said Yun.

He also noted the rare state of the current marketplace.

'The market is quite unusual as sales are coming down, but listed homes are still selling swiftly, and home prices are much higher than a year ago,' said Yun.

'Moreover, an increasing number of buyers with short tenure expectations could opt for 5-year adjustable-rate
mortgages , thereby assuring fixed payments over five years because of the rate reset,' he added. 'The cash buyers, not impacted by mortgage rate changes, remain elevated.'

Properties typically remained on the market for 17 days in April, equal to both the number of days in March 2022 and in April 2021. Eighty-eight percent of homes sold in April 2022 were on the market for less than a month.

First-time buyers were responsible for 28% of sales in April, down from 30% in March and from 31% in April 2021.

All-cash sales accounted for 26% of transactions in April, down from 28% in March and up from the 25% recorded in April 2021.

Distressed sales --
foreclosures and short sales -- represented less than 1% of sales in April, equal to the percentage seen in March and down from 2% in April 2021.

According to Freddie Mac, the average commitment rate for a 30-year, conventional, fixed-rate mortgage was 4.98% in April, up from 4.17% in March. The average commitment rate across all of 2021 was 2.96%.

Realtor.com®'s Market Trends Report in April shows that the largest year-over-year median list price growth occurred in Miami (+38.3%), Las Vegas (+32.6%), and Orlando (+30.7%). Austin reported the highest growth in the share of homes that had their prices reduced compared to last year (+6.8 percentage points), followed by Las Vegas (+5.3 percentage points) and Sacramento (+4.7 percentage points).
.."

==================


==================
  

INFOGRAPHIC: Existing Home Sales During April 2022
INFOGRAPHIC: Existing Home Sales
During April 2022


==================


Labels: , , , , , , , , , , ,


--> www.FedPrimeRate.com Privacy Policy <--

>  SITEMAP  <

Wednesday, April 20, 2022

Existing Home Sales During March 2022

The Existing Home Sales report for March 2022 was released by The National Association of Realtors® (NAR®) this morning:

Predicted: 6,000,000
Actual: 5,770,000

  •  Change from Previous Month: -2.698% (-160,000 homes)

  •  Change from One Year Previous: -4.47% (-270,000 homes)
==========

Inventory: 950,000 (2.0 months supply; -9.5% year-on-year.)

==========

The yellow-highlighted, "actual" figure above represents the preliminary, seasonally adjusted annualized sales count of existing homes, co-ops and condominiums for the indicated month. The "predicted" figure is what economists were expecting, while the "actual" is the true or real figure.

------------------------------------------------------

Median Price for A Used Home During March 2022: $375,300

Change from One Year Previous: +15.017% (+$49,000)

---------

Average Price for A Used Home During March 2022: $387,100

Change from One Year Previous: +9.629% (+$34,000)

------------------------------------------------------ 

==========


==========

From Today's Report:


"..."The housing market is starting to feel the impact of sharply rising mortgage rates and higher inflation taking a hit on purchasing power," said Lawrence Yun, NAR's chief economist. "Still, homes are selling rapidly, and home price gains remain in the double-digits."

With mortgage rates expected to rise further, Yun predicts transactions to contract by 10% this year, for home prices to readjust, and for gains to grow around 5%.

"Home prices have consistently moved upward as supply remains tight," Yun said. "However, sellers should not expect the easy-profit gains and should look for multiple offers to fade as demand continues to subside."

Properties typically remained on the market for 17 days in March, down from 18 days in February and 18 days in March 2021. Eighty-seven percent of homes sold in March 2022 were on the market for less than a month.

First-time buyers were responsible for 30% of sales in March, up from 29% in February and down from 32% in March 2021. NAR's 2021 Profile of Home Buyers and Sellers – released in late 2021 – reported that the annual share of first-time buyers was 34%.

"It appears first-time homebuyers are still looking to lock in at current mortgage rates before they inevitably increase," Yun said.

Distressed sales – foreclosures and short sales – represented less than 1% of sales in March, equal to the percentage seen in both February 2022 and March 2021.
.."

==================


==================
  

Existing Home Sales During March 2022

Existing Home Sales During March 2022


==================


Labels: , , , , , , , , , , ,


--> www.FedPrimeRate.com Privacy Policy <--

>  SITEMAP  <

Friday, March 18, 2022

Existing Home Sales During February 2022

The Existing Home Sales report for February 2022 was released by The National Association of Realtors® (NAR®) this morning:

Predicted: 6,000,000
Actual: 6,020,000

  •  Change from Previous Month: -7.242% (-470,000 homes)

  •  Change from One Year Previous: -2.431% (-150,000 homes)
==========

Inventory: 870,000 (1.7 months supply)

==========

The yellow-highlighted, "actual" figure above represents the preliminary, seasonally adjusted annualized sales count of existing homes, co-ops and condominiums for the indicated month. The "predicted" figure is what economists were expecting, while the "actual" is the true or real figure.

------------------------------------------------------

Median Price for A Used Home During February 2022: $357,300

Change from One Year Previous: +15.035% (+$46,700)

---------

Average Price for A Used Home During February 2022: $370,700

Change from One Year Previous: +8.36% (+$28,600)

------------------------------------------------------ 

==========


==========

From Today's Report:


"...'Housing affordability continues to be a major challenge, as buyers are getting a double whammy: rising mortgage rates and sustained price increases,' said Lawrence Yun, NAR's chief economist. 'Some who had previously qualified at a 3% mortgage rate are no longer able to buy at the 4% rate.

'Monthly payments have risen by 28% from one year ago – which interestingly is not a part of the consumer price index – and the market remains swift with multiple offers still being recorded on most properties.'


Yun notes that rising rates and escalating prices have prevented many consumers from making a purchase.

'The sharp jump in
mortgage rates and increasing inflation is taking a heavy toll on consumers' savings,' he said. 'However, I expect the pace of price appreciation to slow as demand cools and as supply improves somewhat due to more home construction.'

According to Freddie Mac, the average commitment rate for a 30-year, conventional, fixed-rate mortgage was 3.76% in February, up from 3.45% in January. The average commitment rate across all of 2021 was 2.96%.

Realtor.com®'s Market Trends Report in February shows that the greatest year-over-year median list price growth occurred in Las Vegas (+39.6%), Miami (+31.6%) and Tampa (+31.5%). Austin posted the highest growth in the share of homes which had their prices reduced compared to last year (+3.3 percentage points), followed by Milwaukee (+2.1 percentage points), Pittsburgh and Baltimore (+1.4 percentage points each).
..'"

==================


==================


Labels: , , , , , , , , , , ,


--> www.FedPrimeRate.com Privacy Policy <--

>  SITEMAP  <

Friday, February 18, 2022

Existing Home Sales During January 2022

The Existing Home Sales report for January 2022 was released by The National Association of Realtors® (NAR®) this morning:

Predicted: 6,250,000
Actual: 6,500,000

  •  Change from Previous Month: +6.732% (+410,000 homes)

  •  Change from One Year Previous: -2.256% (-150,000 homes)
==========

Inventory: 860,000 (1.6 months supply)

==========

The yellow-highlighted, "actual" figure above represents the preliminary, seasonally adjusted annualized sales count of existing homes, co-ops and condominiums for the indicated month. The "predicted" figure is what economists were expecting, while the "actual" is the true or real figure.

------------------------------------------------------

Median Price for A Used Home During January 2022: $350,300

Change from One Year Previous: +15.382% (+$46,700)

---------

Average Price for A Used Home During January 2022: $368,700

Change from One Year Previous: +9.147% (+$30,900)

------------------------------------------------------ 

==========


==========

From Today's Report:


"...'Buyers were likely anticipating further rate increases and locking-in at the low rates, and investors added to overall demand with all-cash offers,' said Lawrence Yun, NAR's chief economist. 'Consequently, housing prices continue to move solidly higher.'

'The inventory of homes on the market remains woefully depleted, and in fact is currently at an all-time low,' Yun said.

Yun explained that the forthcoming increase in mortgage rates will be problematic for at least two market segments.

'First, some moderate-income buyers who barely qualified for a mortgage when interest rates were lower will now be unable to afford a mortgage,' he said. 'Second, consumers in expensive markets, such as California and the New York City metro area, will feel the sting of nearly an additional $500 to $1000 in monthly payments due to rising rates.'
..."

==================


==================


Labels: , , , , , , , , , , ,


--> www.FedPrimeRate.com Privacy Policy <--

>  SITEMAP  <

Thursday, December 30, 2021

Pending Home Sales Index for November 2021

The Pending Home Sales Index (PHSI) report for November 2021 was released by The National Association of Realtors® (NAR) this morning:


==========

Predicted: Unchanged.

  • Actual: 122.4

==========

-- Previous Month (revised): 125.2

-- 12 Months Previous: 125.8

  •  Change from Previous Month: -2.236% (-2.8 points)

  •  Change from One Year Previous: -2.703% (-3.4 points)
==========


========
 
From the NAR website:

  • An index above 100 coincides with a historically high level of home sales activity.

  • An index of 100 is equal to the average level of contract activity during 2001, the first year to be analyzed. Coincidentally, 2001 was the first of four consecutive record years for existing-home sales. 2001 sales are fairly close to the higher level of home sales expected in the coming decade relative to the norms experienced in the mid-1990s. As such, an index of 100 coincides with a historically high level of home sales activity.
========
 
From Today's Report:

"...Pending home sales slipped in November, receding slightly after a previous month of gains, according to the National Association of Realtors®. Each of the four major U.S. regions witnessed contract transactions decline month-over-month. Year-over-year activity mostly retreated too, as three regions reported drops and only the Midwest saw an increase.

The Pending Home Sales Index (PHSI), www.nar.realtor/pending-home-sales, a forward-looking indicator of home sales based on contract signings, fell 2.2.% to 122.4 in November. Year-over-year, signings slid 2.7%. An index of 100 is equal to the level of contract activity in 2001.

"There was less pending home sales action this time around, which I would ascribe to low housing supply, but also to buyers being hesitant about home prices," said Lawrence Yun, NAR's chief economist. "While I expect neither a price reduction, nor another year of record-pace price gains, the market will see more inventory in 2022 and that will help some consumers with affordability."

Yun notes that housing demand continues to be high, explaining that homes placed on the market for sale go from "listed status" to "under contract" in approximately 18 days.

"Buyer competition alone is unrelenting, but home seekers have also had to contend with the negative impacts of supply chain disruptions and labor shortages this year," he said. "These aspects, along with the exorbitant prices and a lack of available homes, have created a much tougher buying season."

Yun adds that a countrywide surge of the omicron variant poses a risk to the housing market's performance, as buyers and sellers are sidelined, and home construction is delayed.

Realtor.com®'s Hottest Housing Markets (link is external) most recent data showed that out of the largest 40 metros, the most improved markets over the past year were Orlando-Kissimmee-Sanford, Fla.; Tampa-St. Petersburg, Fla.; Dallas-Fort Worth-Arlington, Texas; Jacksonville, Fla.; and Denver-Aurora-Lakewood, Colo..."
========
   
Housing Snapshot Pending Home Sales November 2021

 Housing Snapshot
Pending Home Sales
November 2021

 ========


Labels: , , , , , , , , , , , , , , , ,


--> www.FedPrimeRate.com Privacy Policy <--

>  SITEMAP  <

Monday, August 30, 2021

Pending Home Sales Index for July 2021

The Pending Home Sales Index (PHSI) report for July 2021 was released by The National Association of Realtors® (NAR) this morning:


==========

Predicted: Unchanged.

  • Actual: 110.7

==========

-- Previous Month (revised): 112.7

-- 12 Months Previous: 121.0

  •  Change from Previous Month: -1.775% (-2.0 points)

  •  Change from One Year Previous: -8.512% (-10.3 points)
==========


========
 
From the NAR website:

  • An index above 100 coincides with a historically high level of home sales activity.

  • An index of 100 is equal to the average level of contract activity during 2001, the first year to be analyzed. Coincidentally, 2001 was the first of four consecutive record years for existing-home sales. 2001 sales are fairly close to the higher level of home sales expected in the coming decade relative to the norms experienced in the mid-1990s. As such, an index of 100 coincides with a historically high level of home sales activity.
========
 
From Today's Report:

"...Pending home sales dipped modestly in July, noting two consecutive months of declines, according to the National Association of Realtors®.  Only the West region registered a month-over-month gain in contract activity, while the other three major U.S. regions reported drops. All four regions saw transactions decrease year-over-year.

The Pending Home Sales Index (PHSI), www.nar.realtor/pending-home-sales, a forward-looking indicator of home sales based on contract signings, declined 1.8% to 110.7 in July. Year-over-year, signings fell 8.5%. An index of 100 is equal to the level of contract activity in 2001.

'The market may be starting to cool slightly, but at the moment there is not enough supply to match the demand from would-be buyers,' said Lawrence Yun, NAR's chief economist. 'That said, inventory is slowly increasing and home shoppers should begin to see more options in the coming months.

'Homes listed for sale are still garnering great interest, but the multiple, frenzied offers -- sometimes double-digit bids on one property -- have dissipated in most regions,' Yun said. 'Even in a somewhat calmer market, a number of potential buyers are still choosing to waive appraisals and inspections.'

As of July, 27% of buyers bypassed appraisal and inspection contingencies. By refraining from these evaluations, in most cases, buyers are looking to accelerate the homebuying process, according to Yun.
July Pending Home Sales Regional Breakdown

Month-over-month, the Northeast PHSI fell 6.6% to 92.0 in July, a 16.9% decrease from a year ago. In the Midwest, the index dropped 3.3% to 104.6 last month, down 8.5% from July 2020.

Pending home sales transactions in the South declined 0.9% to an index of 130.9 in July, down 6.7% from July 2020. The index in the West rose 1.9% in July to 99.8, but still down 5.7% from a year prior.

The National Association of Realtors® is America's largest trade association, representing more than 1.5 million members involved in all aspects of the residential and commercial real estate industries.

====================

*The Pending Home Sales Index is a leading indicator for the housing sector, based on pending sales of existing homes. A sale is listed as pending when the contract has been signed but the transaction has not closed, though the sale usually is finalized within one or two months of signing.

Pending contracts are good early indicators of upcoming sales closings. However, the amount of time between pending contracts and completed sales are not identical for all home sales. Variations in the length of the process from pending contract to closed sale can be caused by issues such as buyer difficulties with obtaining mortgage financing, home inspection problems, or appraisal issues.

The index is based on a sample that covers about 40% of multiple listing service data each month. In developing the model for the index, it was demonstrated that the level of monthly sales contract activity parallels the level of closed existing-home sales in the following two months.

An index of 100 is equal to the average level of contract activity during 2001, which was the first year to be examined. By coincidence, the volume of existing-home sales in 2001 fell within the range of 5.0 to 5.5 million, which is considered normal for the current U.S. population..."
========
 
Housing Snapshot - Pending Home Sales - July 2021

Housing Snapshot
Pending Home Sales
July 2021

 ========


Labels: , , , , , , , , , , , ,


--> www.FedPrimeRate.com Privacy Policy <--

>  SITEMAP  <

Friday, July 23, 2021

Existing Home Sales During June 2021

The Existing Home Sales report for June 2021 was released by The National Association of Realtors® (NAR®) this morning:

Predicted: 5,500,000
Actual: 5,860,000

  •  Change from Previous Month: +1.384% (+80,000 homes)

  •  Change from One Year Previous: +22.851% (+1,090,000 homes)
==========

Inventory: 1,250,000 (2.6 months supply)

==========

The yellow-highlighted, "actual" figure above represents the preliminary, seasonally adjusted annualized sales count of existing homes, co-ops and condominiums for the indicated month. The "predicted" figure is what economists were expecting, while the "actual" is the true or real figure.

------------------------------------------------------

Median Price for A Used Home During June 2021: $363,300

Change from One Year Previous: +23.404% (+$689,000)

---------

Average Price for A Used Home During June 2021: $381,800

Change from One Year Previous: +16.084% (+$529,000)


------------------------------------------------------ 

==========


==========

From Today's Report:


"...'Supply has modestly improved in recent months due to more housing starts and existing homeowners listing their homes, all of which has resulted in an uptick in sales,' said Lawrence Yun, NAR's chief economist. 'Home sales continue to run at a pace above the rate seen before the pandemic.'

Total housing inventory at the end of June amounted to 1.25 million units, up 3.3% from May's inventory and down 18.8% from one year ago (1.54 million). Unsold inventory sits at a 2.6-month supply at the current sales pace, modestly up from May's 2.5-month supply but down from 3.9 months in June 2020.

The median existing-home price for all housing types in June was $363,300, up 23.4% from June 2020 ($294,400), as every region recorded price jumps. This marks 112 straight months of year-over-year gains.

'At a broad level, home prices are in no danger of a decline due to tight inventory conditions, but I do expect prices to appreciate at a slower pace by the end of the year,' Yun said. 'Ideally, the costs for a home would rise roughly in line with income growth, which is likely to happen in 2022 as more listings and new construction become available.'

Properties typically remained on the market for 17 days in June, unchanged from May and down from 24 days in June 2020. Eighty-nine percent of homes sold in June 2021 were on the market for less than a month.

First-time buyers accounted for 31% of sales in June, also even with May but down from 35% in June 2020. NAR's 2020 Profile of Home Buyers and Sellers -- released in late 2020 -- revealed that the annual share of first-time buyers was 31%.

Individual investors or second-home buyers, who account for many cash sales, purchased 14% of homes in June, down from 17% in May and up from 9% in June 2020. All-cash sales accounted for 23% of transactions in June, even with May and up from 16% in June 2020.

Distressed sales – foreclosures and short sales – represented less than 1% of sales in June, equal to May's percentage but down from 3% in June 2020.

'Huge wealth gains from both housing equity and the stock market have nudged up all-cash transactions, but first-time buyers who need
mortgage financing are being uniquely challenged with record-high home prices and low inventory,' Yun explained. 'Although rates are favorably low, these hurdles have been overwhelming to some potential buyers.'

According to Freddie Mac, the average commitment rate for a 30-year, conventional, fixed-rate mortgage was 2.98% in June, slightly up from 2.96% in May. The average commitment rate across all of 2020 was 3.11%.
.."

==================


==================

Labels: , , , , , , , , , , ,


--> www.FedPrimeRate.com Privacy Policy <--

>  SITEMAP  <

Tuesday, December 22, 2020

Existing Home Sales During November 2020

The Existing Home Sales report for November 2020 was released by The National Association of Realtors® (NAR®) this morning:

Predicted: 6,500,000
Actual: 6,690,000

  •  Change from Previous Month: -2.478% (-170,000 homes)

  •  Change from One Year Previous: +25.752% (+1,370,000 homes)
==========

Inventory: 1,280,000 (2.3 months supply)

==========

The yellow-highlighted, "actual" figure above represents the preliminary, seasonally adjusted annualized sales count of existing homes, co-ops and condominiums for the indicated month. The "predicted" figure is what economists were expecting, while the "actual" is the true or real figure.

------------------------------------------------------

Median Price for A Used Home During November 2020: $310,800

Change from One Year Previous: +14.56% (+$39,500)

---------

Average Price for A Used Home During November 2020: $343,000

Change from One Year Previous: +11.291% (+$34,800)


------------------------------------------------------ 

==========


==========

From Today's Report:


"...Existing-home sales fell in November, snapping a five-month streak of month-over-month gains, according to the National Association of Realtors®. All major regions either took a step back or held steady in terms of their respective month-over-month status, but each of the four areas experienced significant year-over-year growth.

Total existing-home sales, https://www.nar.realtor/existing-home-sales, completed transactions that include single-family homes, townhomes, condominiums and co-ops, decreased 2.5% from October to a seasonally-adjusted annual rate of 6.69 million in November. However, sales in total rose year-over-year, up 25.8% from a year ago (5.32 million in November 2019).

'Home sales in November took a marginal step back, but sales for all of 2020 are already on pace to surpass last year's levels,' said
Lawrence Yun, NAR's chief economist. 'Given the COVID-19 pandemic, it's amazing that the housing sector is outperforming expectations.'

Yun notes that job recoveries have stalled in the past few months, and fast-rising coronavirus cases along with stricter lockdowns have weakened consumer confidence.

'Circumstances are far from being back to the pre-pandemic normal,' he said. 'However, the latest stimulus package and with the vaccine distribution underway, and a very strong demand for homeownership still prevalent, robust growth is forthcoming for 2021.'

The median existing-home price for all housing types in November was $310,800, up 14.6% from November 2019 ($271,300), as prices increased in every region. November's national price increase marks 105 straight months of year-over-year gains.

Total housing inventory at the end of November totaled 1.28 million units, down 9.9% from October and down 22% from one year ago (1.64 million). Unsold inventory sits at an all-time low 2.3-month supply at the current sales pace, down from 2.5 months in October and down from the 3.7-month figure recorded in November 2019.

Properties typically remained on the market for 21 days in November, seasonally even with October and down from 38 days in November 2019. Seventy-three percent of homes sold in November 2020 were on the market for less than a month.

'The positive momentum that home sellers are seeing will carry on well into the new year,' Yun predicted, citing low mortgage rates and remote-work flexibilities.

Yun's projections of a continued housing market rebound were the consensus among economic and housing experts during NAR's Real Estate Forecast Summit, held earlier this month. Industry insiders in attendance agreed that mortgage rates will hover around 3% in the coming year, and said they expect an annual median home price increase of 8.0%.

'Housing affordability, which had greatly benefitted from falling mortgage rates, are now being challenged due to record-high home prices,' Yun said. 'That could place strain on some potential consumers, particularly first-time buyers.'

First-time buyers were responsible for 32% of sales in November, equal to the percentage seen in both October 2020 and November 2019. NAR's 2020 Profile of Home Buyers and Sellers -- released last month -- revealed that the annual share of first-time buyers was 31%.

Individual investors or second-home buyers, who account for many cash sales, purchased 14% of homes in November, identical to the share recorded in October 2020 and a small decline from 16% in October 2019. All-cash sales accounted for 20% of transactions in November, up from 19% in October but unchanged from November 2019.

Distressed sales – foreclosures and short sales – represented less than 1% of sales in November, equal to October's percentage but down from 2% in November 2019.

'While we still face economic and health challenges ahead, I have zero doubt that the nation will continue to recover from this pandemic,' said NAR President Charlie Oppler, a Realtor® from Franklin Lakes, N.J., and broker/owner of Prominent Properties Sotheby's International Realty. 'Whether it's through volunteering or philanthropy, or helping a given buyer secure that dream home, Realtors® have stepped up in a major way and we will continue with those efforts in 2021 and beyond.'

According to Freddie Mac, the average commitment rate for a 30-year, conventional, fixed-rate mortgage decreased to 2.77% in November, down from 2.83% in October. The average commitment rate across all of 2019 was 3.94%.
.."

==================


==================


Labels: , , , , , , , , , , ,


--> www.FedPrimeRate.com Privacy Policy <--

>  SITEMAP  <

bing

bing

www.FedPrimeRate.com
Entire Website © 2024 FedPrimeRate.comSM


This website is neither affiliated nor associated with The United States Federal Reserve
in any way. Information in this website is provided for educational purposes only. The owners
of this website make no warranties with respect to any and all content contained within this
website. Consult a financial professional before making important decisions related to any
investment or loan product, including, but not limited to, business loans, personal loans,
education loans, first or second mortgages, credit cards, car loans or any type of insurance.