.comment-link {margin-left:.6em;}

Economy

Economic Data (USA)

Friday, April 28, 2023

Employment Cost Index for Q1, 2023

Employment Cost Index (ECI) for the first quarter of 2023 was released by The Labor Department's Bureau of Labor Statistics this morning:

Predicted: +1.1%
Actual: +1.2%


  • Reading from previous quarter: +1.1%
     
  • Change from 12 months previous (Y/Y): +4.8%


The yellow-highlighter figure represents the seasonally adjusted, quarter-to-quarter change for the ECI, which is the Labor Department's broadest measure of employee-compensation costs, and includes wages, salaries and benefits.

==================

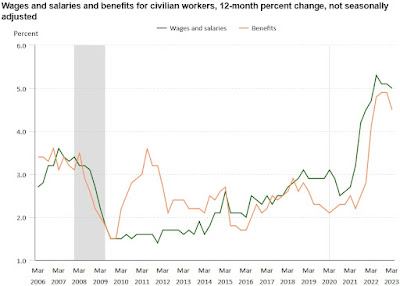
  • Wages and Salaries: +1.2%

  • Change from 12 months previous (Y/Y): +5.0% 

==================

  • Benefits: +1.2%

  • Change from 12 months previous (Y/Y): +4.5% 

==================


From the Labor Department website:


"...The Employment Cost Index (ECI) measures the change in the cost of labor, free from the influence of employment shifts among occupations and industries..."

==================


CHART: Wages and Salaries and Benefits for Civilian Workers 12 Month Percent Change Not Seasonally Adjusted - First Quarter, 2023 UPDATE
CHART: Wages and Salaries and Benefits
for Civilian Workers
12 Month Percent Change
Not Seasonally Adjusted
 First Quarter, 2023 UPDATE

==================


==================

Labels: , , , , , , , , , , ,


--> www.FedPrimeRate.com Privacy Policy <--

>  SITEMAP  <

Saturday, April 30, 2022

Employment Cost Index for Q1, 2022

The Employment Cost Index (ECI) for the first quarter of 2022 was released by The Labor Department's Bureau of Labor Statistics this morning:

Predicted: +1.0%
Actual: +1.4%


  • Reading from previous quarter: +1.0%
     
  • Change from 12 months previous (Y/Y): +4.5%


The yellow-highlighter figure represents the seasonally adjusted, quarter-to-quarter change for the ECI, which is the Labor Department's broadest measure of employee-compensation costs, and includes wages, salaries and benefits.

==================

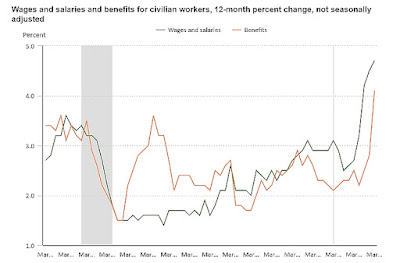
  • Wages and Salaries: +1.2%

  • Change from 12 months previous (Y/Y): +4.7% 

==================

  • Benefits: +1.8%

  • Change from 12 months previous (Y/Y): +4.1% 

==================


From the Labor Department website:


"...The Employment Cost Index (ECI) measures the change in the cost of labor, free from the influence of employment shifts among occupations and industries..."

==================


CHART: Wages and Salaries and Benefits for Civilian Workers 12 Month Percent Change - Q1, 2022 UPDATE

CHART: Wages and Salaries and Benefits for Civilian Workers
12 Month Percent Change - Q1, 2022 UPDATE


==================


==================

Labels: , , , , , , , , , , , ,


--> www.FedPrimeRate.com Privacy Policy <--

>  SITEMAP  <

Friday, January 28, 2022

Employment Cost Index for Q4, 2021

The Employment Cost Index (ECI) for the fourth quarter of 2021 was released by The Labor Department's Bureau of Labor Statistics this morning:

Predicted: +0.9%
Actual: +1.0%


  • Reading from previous quarter: +1.3%
     
  • Change from 12 months previous (Y/Y): +4.0%


The yellow-highlighter figure represents the seasonally adjusted, quarter-to-quarter change for the ECI, which is the Labor Department's broadest measure of employee-compensation costs, and includes wages, salaries and benefits.

==================

  • Wages and Salaries: +1.1%

  • Change from 12 months previous (Y/Y): +4.5% 

==================

  • Benefits: +0.9%

  • Change from 12 months previous (Y/Y): +2.8% 

==================


From the Labor Department website:


"...The Employment Cost Index (ECI) measures the change in the cost of labor, free from the influence of employment shifts among occupations and industries..."

==================


CHART: Wages and Salaries and Benefits for Civilian Workers 12 Month Percent Change

CHART: Wages and Salaries and Benefits
for Civilian Workers 12 Month Percent Change

==================


==================


Labels: , , , , , , , ,


--> www.FedPrimeRate.com Privacy Policy <--

>  SITEMAP  <

Wednesday, July 31, 2019

Employment Cost Index for Q2, 2019

The Employment Cost Index (ECI) for the second quarter of 2019 was released by The Labor Department's Bureau of Labor Statistics this morning:

Predicted: +0.7%
Actual: +0.6%


  • Reading from previous quarter: +0.7%
     
  • Change from 12 months previous (Y/Y): +2.7%


The yellow-highlighter figure represents the seasonally adjusted, quarter-to-quarter change for the ECI, which is the Labor Department's broadest measure of employee-compensation costs, and includes wages, salaries and benefits.

==================

  • Wages and Salaries: +0.7%

  • Change from 12 months previous (Y/Y): +2.9% 

==================

  • Benefits: +0.5%

  • Change from 12 months previous (Y/Y): +2.3% 

==================


From the Labor Department website:


"...The Employment Cost Index (ECI) measures the change in the cost of labor, free from the influence of employment shifts among occupations and industries..."

==================

Chart: Employment Cost Index - Q2, 2019 Update

==================

  • The ECI report for the third quarter of 2019 is scheduled for release on October 31, 2019.


==================


Labels: , , , , , , , ,


--> www.FedPrimeRate.com Privacy Policy <--

>  SITEMAP  <

Thursday, January 31, 2019

Employment Cost Index for Q4, 2018

The Employment Cost Index (ECI) for the fourth quarter of 2018 was released by The Labor Department's Bureau of Labor Statistics this morning:

Predicted: +0.7%
Actual: +0.7%


  • Reading from previous quarter: +0.8%
     
  • Change from 12 months previous (Y/Y): +2.9%


The yellow-highlighter figure represents the seasonally adjusted, quarter-to-quarter change for the ECI, which is the Labor Department's broadest measure of employee-compensation costs, and includes wages, salaries and benefits.

==================

  • Wages and Salaries: +0.6%

  • Change from 12 months previous (Y/Y): +3.1% 

==================

  • Benefits: +0.7%

  • Change from 12 months previous (Y/Y): +2.8% 

==================


From the Labor Department website:


"...The Employment Cost Index (ECI) measures the change in the cost of labor, free from the influence of employment shifts among occupations and industries..."

==================

Employment Cost Index - Q4, 2018 Update

==================

  • The ECI report for the fourth quarter of 2018 is scheduled for release on April 30, 2019.


==================


Labels: , , , , , , , ,


--> www.FedPrimeRate.com Privacy Policy <--

>  SITEMAP  <

Wednesday, October 31, 2018

Employment Cost Index for Q3, 2018

The Employment Cost Index (ECI) for the third quarter of 2018 was released by The Labor Department's Bureau of Labor Statistics this morning:

Predicted: +0.7%
Actual: +0.8%


  • Reading from previous quarter: +0.6%
     
  • Change from 12 months previous (Y/Y): +2.8%


The yellow-highlighter figure represents the seasonally adjusted, quarter-to-quarter change for the ECI, which is the Labor Department's broadest measure of employee-compensation costs, and includes wages, salaries and benefits.

==================

  • Wages and Salaries: +0.9%

  • Change from 12 months previous (Y/Y): +2.9% 

==================

  • Benefits: +0.4%

  • Change from 12 months previous (Y/Y): +2.6% 

==================


From the Labor Department website:


"...The Employment Cost Index (ECI) measures the change in the cost of labor, free from the influence of employment shifts among occupations and industries..."

==================

Employment Cost Index - Q3, 2018 Update

==================

  • The ECI report for the fourth quarter of 2018 is scheduled for release on January 31, 2019.


==================


    Labels: , , , , , , , ,


    --> www.FedPrimeRate.com Privacy Policy <--

    >  SITEMAP  <

    Tuesday, July 31, 2018

    Employment Cost Index for Q2, 2018

    The Employment Cost Index (ECI) for the second quarter of 2018 was released by The Labor Department's Bureau of Labor Statistics this morning:

    Predicted: +0.7%
    Actual: +0.6%


    • Reading from previous quarter: +0.8%
       
    • Change from 12 months previous (Y/Y): +2.8%


    The yellow-highlighter figure represents the seasonally adjusted, quarter-to-quarter change for the ECI, which is the Labor Department's broadest measure of employee-compensation costs, and includes wages, salaries and benefits.

    ==================

    • Wages and Salaries: +0.5%

    • Change from 12 months previous (Y/Y): +2.8% 

    ==================

    • Benefits: +0.9%

    • Change from 12 months previous (Y/Y): +2.9% 

    ==================


    From the Labor Department website:


    "...The Employment Cost Index (ECI) measures the change in the cost of labor, free from the influence of employment shifts among occupations and industries..."

    ==================

    Employment Cost Index - Q2, 2018 Update
    Employment Cost Index - Q2, 2018 Update

    ==================

    • The ECI report for September 2018 will be released on October 31, 2018.


    Labels: , , , , , , , ,


    --> www.FedPrimeRate.com Privacy Policy <--

    >  SITEMAP  <

    Friday, April 27, 2018

    Employment Cost Index for Q1, 2018

    The Employment Cost Index (ECI) for the first quarter of 2018 was released by The Labor Department's Bureau of Labor Statistics this morning:

    Predicted: +0.7%
    Actual: +0.8%

    ==================

    • Reading from previous quarter: +0.6%
       
    • Change from 12 months previous (Y/Y): +2.7%

    ==================

    The yellow-highlighter figure represents the quarter-to-quarter change for the ECI, which is the Labor Department's broadest measure of employee-compensation costs, and includes wages, salaries and benefits.

    ==================

    • Wages and Salaries: +0.9%

    • Benefits: +0.7%
    ==================


    From the Labor Department website:


    "...The Employment Cost Index (ECI) measures the change in the cost of labor, free from the influence of employment shifts among occupations and industries..."

    ==================

    • The ECI report for the second quarter of 2018 will be released on July 31, 2018.

    Labels: , , , , , , , ,


    --> www.FedPrimeRate.com Privacy Policy <--

    >  SITEMAP  <

    Wednesday, January 31, 2018

    Employment Cost Index for Q4, 2017

    The Employment Cost Index (ECI) for the fourth quarter of 2017 was released by The Labor Department's Bureau of Labor Statistics this morning:

    Predicted: +0.6%
    Actual: +0.6%

    ==================

    • Reading from previous quarter: +0.7%
       
    • Change from 12 months previous (Y/Y): +2.6%

    ==================

    The yellow-highlighter figure represents the quarter-to-quarter change for the ECI, which is the Labor Department's broadest measure of employee-compensation costs, and includes wages, salaries and benefits.

    ==================

    • Wages and Salaries: +0.5%

    • Benefits: +0.5%
    ==================


    From the Labor Department website:


    "...The Employment Cost Index (ECI) measures the change in the cost of labor, free from the influence of employment shifts among occupations and industries..."

    ==================

    • The ECI report for the first quarter of 2018 will be released on April 27, 2018.


    Labels: , , , , , , , ,


    --> www.FedPrimeRate.com Privacy Policy <--

    >  SITEMAP  <

    Friday, July 28, 2017

    Employment Cost Index for Q2, 2017

    The Employment Cost Index (ECI) for the second quarter of 2017 was released by The Labor Department's Bureau of Labor Statistics this morning:

    Predicted: +0.6%
    Actual: +0.5%

    ==================

    • Reading from previous quarter: +0.8%
       
    • Change from 12 months previous: +2.4%
    ==================

    The yellow-highlighter figure represents the quarter-to-quarter change for the ECI, which is the Labor Department's broadest measure of employee-compensation costs, and includes wages, salaries and benefits.

    From the Labor Department website:


    "...The Employment Cost Index (ECI) measures the change in the cost of labor, free from the influence of employment shifts among occupations and industries..."

    ==================

    • The ECI report for the third quarter of 2017 will be released on October 31, 2017.

    Labels: , , , , ,


    --> www.FedPrimeRate.com Privacy Policy <--

    >  SITEMAP  <

    Friday, April 28, 2017

    Employment Cost Index for Q1, 2017

    The Employment Cost Index (ECI) for the first quarter of 2017 was released by The Labor Department's Bureau of Labor Statistics this morning:

    Predicted: +0.6%
    Actual: +0.8%

    • Reading from previous quarter: +0.5%
       
    • Change from 12 months previous: +2.4%

    The yellow-highlighter figure represents the quarter-to-quarter change for the ECI, which is the Labor Department's broadest measure of employee-compensation costs, and includes wages, salaries and benefits.

    From the Labor Department website:


    "...The Employment Cost Index (ECI) measures the change in the cost of labor, free from the influence of employment shifts among occupations and industries..."

    ==================

    • The ECI report for the second quarter of 2017 will be released on July 28, 2017.

    Labels: , , , , ,


    --> www.FedPrimeRate.com Privacy Policy <--

    >  SITEMAP  <

    bing

    bing

    www.FedPrimeRate.com
    Entire Website © 2024 FedPrimeRate.comSM


    This website is neither affiliated nor associated with The United States Federal Reserve
    in any way. Information in this website is provided for educational purposes only. The owners
    of this website make no warranties with respect to any and all content contained within this
    website. Consult a financial professional before making important decisions related to any
    investment or loan product, including, but not limited to, business loans, personal loans,
    education loans, first or second mortgages, credit cards, car loans or any type of insurance.