.comment-link {margin-left:.6em;}

Economy

Economic Data (USA)

Monday, April 21, 2025

Housing Starts During March 2025

The U.S. Commerce Department this morning released its Housing Starts report for March 2025:

---------------------------------------------------

Housing Starts:
Previous Reading: 1,501,000

  • Actual: 1,324,000

Month-on-Month Change: -11.38% (-170,000 New Units)

  • Year-on-Year Change: +1.92% (+25,000 New Units)

---------------------------------------------------

Building Permits:
Previous Reading: 1,456,000

  • Actual: 1,482,000

Month-on-Month Change: +1.58% (+23,000 New Permits)

  • Year-on-Year Change: -0.2%  (-3,000 New Permits)

----------------------------------------------------

Housing Starts: The top, yellow-highlighted figure is a measure of initial construction of single and multi-family residential units in the United States for the indicated month. Seasonally adjusted annual rate. The "predicted" figure is what economists were expecting, while the "actual" is the true or real figure.

If you're wondering about the demand for new homes in the United States, or about the American residential construction industry in general, then you should pay attention to the monthly Housing Starts report. This report also offers insight into specific types of consumer spending: when housing starts are up, demand for the stuff that a consumer would purchase for a new home (large appliances, consumer electronics, furniture, etc.) tends to also rise -- and vice versa.


=================

CHART: Housing Starts + Building Permits + Completions - MARCH 2025 UPDATE
CHART: Housing Starts
+ Building Permits
+ Completions
MARCH 2025 UPDATE

=================


=================

Labels: , , , , , , , ,


--> www.FedPrimeRate.com Privacy Policy <--

>  SITEMAP  <

Thursday, March 20, 2025

Housing Starts During February 2025

The U.S. Commerce Department this morning released its Housing Starts report for February 2025:

---------------------------------------------------

Housing Starts:
Predicted: 1,400,000

  • Actual: 1,501,000

Month-on-Month Change: +11.19% (+151,000 New Units)

  • Year-on-Year Change: -2.91% (-45,000 New Units)

---------------------------------------------------

Building Permits:
Predicted: 1,450,000

  • Actual: 1,456,000

Month-on-Month Change: -1.15.% (-17,000 New Permits)

  • Year-on-Year Change: -6.85%  (-107,000 New Permits)

----------------------------------------------------

Housing Starts: The top, yellow-highlighted figure is a measure of initial construction of single and multi-family residential units in the United States for the indicated month. Seasonally adjusted annual rate. The "predicted" figure is what economists were expecting, while the "actual" is the true or real figure.

If you're wondering about the demand for new homes in the United States, or about the American residential construction industry in general, then you should pay attention to the monthly Housing Starts report. This report also offers insight into specific types of consumer spending: when housing starts are up, demand for the stuff that a consumer would purchase for a new home (large appliances, consumer electronics, furniture, etc.) tends to also rise -- and vice versa.


=================

CHART: Housing Starts + Building Permits + Completions FEBRUARY 2025 UPDATE
CHART: Housing Starts
+ Building Permits
+ Completions
FEBRUARY 2025 UPDATE

=================


=================

Labels: , , , , , , , ,


--> www.FedPrimeRate.com Privacy Policy <--

>  SITEMAP  <

Wednesday, February 19, 2025

Housing Starts During January 2025

The U.S. Commerce Department this morning released its Housing Starts report for January 2025:

---------------------------------------------------

Housing Starts:
Predicted: 1,400,000

  • Actual: 1,366,000

Month-on-Month Change: -9.83% (-149,000 New Units)

  • Year-on-Year Change: -0.73% (-10,000 New Units)

---------------------------------------------------

Building Permits:
Predicted: 1,400,000

  • Actual: 1,483,000

Month-on-Month Change: +0.067% (+1,000 New Permits)

  • Year-on-Year Change: -1.7%  (-379,000 New Permits)

----------------------------------------------------

Housing Starts: The top, yellow-highlighted figure is a measure of initial construction of single and multi-family residential units in the United States for the indicated month. Seasonally adjusted annual rate. The "predicted" figure is what economists were expecting, while the "actual" is the true or real figure.

If you're wondering about the demand for new homes in the United States, or about the American residential construction industry in general, then you should pay attention to the monthly Housing Starts report. This report also offers insight into specific types of consumer spending: when housing starts are up, demand for the stuff that a consumer would purchase for a new home (large appliances, consumer electronics, furniture, etc.) tends to also rise -- and vice versa.


=================

CHART: Housing Starts + Building Permits + Completions - JANUARY 2025 UPDATE
CHART: Housing Starts
+ Building Permits
+ Completions
JANUARY 2025 UPDATE

=================


=================

Labels: , , , , , ,


--> www.FedPrimeRate.com Privacy Policy <--

>  SITEMAP  <

Tuesday, February 18, 2025

Will Privatizing Fannie Mae And Freddie Mac Cause Mortgage Rates to Rise?

Labels: , , , , , , , , , , ,


--> www.FedPrimeRate.com Privacy Policy <--

>  SITEMAP  <

Wednesday, May 17, 2023

Housing Starts During April 2023

The U.S. Commerce Department this morning released its Housing Starts report for April 2023:

---------------------------------------------------

Housing Starts:
Predicted: 1,400,000
Actual: 1,401,000

Change From Previous Month: +2.19% (+30,000 New Units)

  • Change From One Year Previous: -22.3% (-402,000 New Units)

---------------------------------------------------

Building Permits:
Predicted: 1,400,000
Actual: 1,416,000

Change From Previous Month: -1.46% (-21,000 New Permits)

  • Change From One Year Previous: -21.11%  (-379,000 New Permits)

----------------------------------------------------

Housing Starts: The top, yellow-highlighted figure is a measure of initial construction of single and multi-family residential units in the United States for the indicated month. Seasonally adjusted annual rate. The "predicted" figure is what economists were expecting, while the "actual" is the true or real figure.

If you're wondering about the demand for new homes in the United States, or about the American residential construction industry in general, then you should pay attention to the monthly Housing Starts report. This report also offers insight into specific types of consumer spending: when housing starts are up, demand for the stuff that a consumer would purchase for a new home (large appliances, consumer electronics, furniture, etc.) tends to also rise -- and vice versa.


=================

CHART: Housing Starts + Building Permits + Completions - April 2023 Update

CHART: Housing Starts
+ Building Permits
+ Completions
 April 2023 Update


=================


================


Labels: , , , , , ,


--> www.FedPrimeRate.com Privacy Policy <--

>  SITEMAP  <

Tuesday, December 20, 2022

Housing Starts During November 2022

The U.S. Commerce Department this morning released its Housing Starts report for November 2022:

---------------------------------------------------

Housing Starts:
Predicted: 1,500,000
Actual: 1,427,000

Change From Previous Month: -0.49% (-7,000 New Units)

  • Change From One Year Previous: -16.35% (-279,000 New Units)

---------------------------------------------------

Building Permits:
Predicted: 1,400,000
Actual: 1,342,000

Change From Previous Month: -11.24% (-170,000 New Permits)

  • Change From One Year Previous: -22.38%  (-387,000 New Permits)

----------------------------------------------------

Housing Starts: The top, yellow-highlighted figure is a measure of initial construction of single and multi-family residential units in the United States for the indicated month. Seasonally adjusted annual rate. The "predicted" figure is what economists were expecting, while the "actual" is the true or real figure.

If you're wondering about the demand for new homes in the United States, or about the American residential construction industry in general, then you should pay attention to the monthly Housing Starts report. This report also offers insight into specific types of consumer spending: when housing starts are up, demand for the stuff that a consumer would purchase for a new home (large appliances, consumer electronics, furniture, etc.) tends to also rise -- and vice versa.


=================

CHART: Housing Starts + Building Permits + Completions November 2022 Update
CHART: Housing Starts
+ Building Permits
+ Completions
November 2022 Update


=================


================


Labels: , , , , , , , , , ,


--> www.FedPrimeRate.com Privacy Policy <--

>  SITEMAP  <

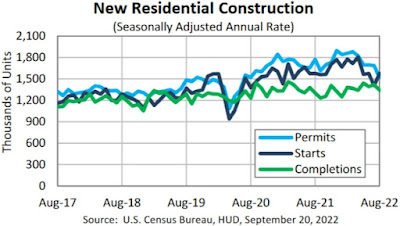
Tuesday, September 20, 2022

Housing Starts During August 2022

The U.S. Commerce Department this morning released its Housing Starts report for August 2022:

---------------------------------------------------

Housing Starts:
Predicted: 1,600,000
Actual: 1,575,000

Change From Previous Month: +12.18% (+171,000 New Units)

  • Change From One Year Previous: -0.063% (-1,000 New Units)

---------------------------------------------------

Building Permits:
Predicted: 1,600,000
Actual: 1,517,000

Change From Previous Month: -9.97% (-168,000 New Permits)

  • Change From One Year Previous: -14.39%  (-255,000 New Permits)

----------------------------------------------------

Housing Starts: The top, yellow-highlighted figure is a measure of initial construction of single and multi-family residential units in the United States for the indicated month. Seasonally adjusted annual rate. The "predicted" figure is what economists were expecting, while the "actual" is the true or real figure.

If you're wondering about the demand for new homes in the United States, or about the American residential construction industry in general, then you should pay attention to the monthly Housing Starts report. This report also offers insight into specific types of consumer spending: when housing starts are up, demand for the stuff that a consumer would purchase for a new home (large appliances, consumer electronics, furniture, etc.) tends to also rise -- and vice versa.


=================


CHART: Housing Starts + Building Permits + Completions - August 2022 Update
CHART: Housing Starts
+ Building Permits
+ Completions
August 2022 Update


=================


================

Labels: , , , , , , , , , ,


--> www.FedPrimeRate.com Privacy Policy <--

>  SITEMAP  <

Wednesday, August 17, 2022

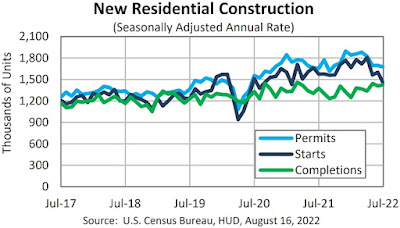
Housing Starts During July 2022

The U.S. Commerce Department this morning released its Housing Starts report for July 2022:

---------------------------------------------------

Housing Starts:
Predicted: 1,500,000
Actual: 1,446,000

Change From Previous Month: -9.57% (-153,000 New Units)

  • Change From One Year Previous: -8.07% (-127,000 New Units)

---------------------------------------------------

Building Permits:
Predicted: 1,700,000
Actual: 1,674,000

Change From Previous Month: -1.3% (-22,000 New Permits)

  • Change From One Year Previous: +1.15%  (+19,000 New Permits)

----------------------------------------------------

Housing Starts: The top, yellow-highlighted figure is a measure of initial construction of single and multi-family residential units in the United States for the indicated month. Seasonally adjusted annual rate. The "predicted" figure is what economists were expecting, while the "actual" is the true or real figure.

If you're wondering about the demand for new homes in the United States, or about the American residential construction industry in general, then you should pay attention to the monthly Housing Starts report. This report also offers insight into specific types of consumer spending: when housing starts are up, demand for the stuff that a consumer would purchase for a new home (large appliances, consumer electronics, furniture, etc.) tends to also rise -- and vice versa.


=================


CHART: Housing Starts + Building Permits + Completions - July 2022 Update

CHART: Housing Starts
+ Building Permits
+ Completions
 July 2022 Update


=================


================


Labels: , , , , , , , , , ,


--> www.FedPrimeRate.com Privacy Policy <--

>  SITEMAP  <

Tuesday, July 19, 2022

Housing Starts During June 2022

The U.S. Commerce Department this morning released its Housing Starts report for June 2022:

---------------------------------------------------

Housing Starts:
Predicted: 1,600,000
Actual: 1,559,000

Change From Previous Month: -2.011% (-32,000 New Units)

  • Change From One Year Previous: -6.31% (-105,000 New Units)

---------------------------------------------------

Building Permits:
Predicted: 1,700,000
Actual: 1,685,000

Change From Previous Month: -0.59% (-10,000 New Permits)

  • Change From One Year Previous: +1.44%  (+24,000 New Permits)

----------------------------------------------------

Housing Starts: The top, yellow-highlighted figure is a measure of initial construction of single and multi-family residential units in the United States for the indicated month. Seasonally adjusted annual rate. The "predicted" figure is what economists were expecting, while the "actual" is the true or real figure.

If you're wondering about the demand for new homes in the United States, or about the American residential construction industry in general, then you should pay attention to the monthly Housing Starts report. This report also offers insight into specific types of consumer spending: when housing starts are up, demand for the stuff that a consumer would purchase for a new home (large appliances, consumer electronics, furniture, etc.) tends to also rise -- and vice versa.


=================

 
CHART: Housing Starts + Building Permits + Completions June 2022 Update

 CHART: Housing Starts
+ Building Permits
+ Completions
June 2022 Update
 
=================


================


Labels: , , , , , , , , , ,


--> www.FedPrimeRate.com Privacy Policy <--

>  SITEMAP  <

Friday, June 17, 2022

Housing Starts During May 2022

The U.S. Commerce Department this morning released its Housing Starts report for May 2022:

---------------------------------------------------

Housing Starts:
Predicted: 1,600,000
Actual: 1,549,000

Change From Previous Month: -14.42% (-261,000 New Units)

  • Change From One Year Previous: -3.49% (-56,000 New Units)

---------------------------------------------------

Building Permits:
Predicted: 1,700,000
Actual: 1,695,000

Change From Previous Month: -7.021% (-128,000 New Permits)

  • Change From One Year Previous: +0.237%  (+4,000 New Permits)

----------------------------------------------------

Housing Starts: The top, yellow-highlighted figure is a measure of initial construction of single and multi-family residential units in the United States for the indicated month. Seasonally adjusted annual rate. The "predicted" figure is what economists were expecting, while the "actual" is the true or real figure.

If you're wondering about the demand for new homes in the United States, or about the American residential construction industry in general, then you should pay attention to the monthly Housing Starts report. This report also offers insight into specific types of consumer spending: when housing starts are up, demand for the stuff that a consumer would purchase for a new home (large appliances, consumer electronics, furniture, etc.) tends to also rise -- and vice versa.


=================

 
CHART: Housing Starts + Building Permits + Completions May 2022 Update

CHART: Housing Starts
+ Building Permits
+ Completions
May 2022 Update

=================


================


Labels: , , , , , , , , , ,


--> www.FedPrimeRate.com Privacy Policy <--

>  SITEMAP  <

Wednesday, May 18, 2022

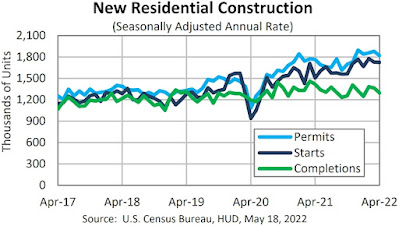
Housing Starts During April 2022

The U.S. Commerce Department this morning released its Housing Starts report for April 2022:

---------------------------------------------------

Housing Starts:
Predicted: 1,780,000
Actual: 1,724,000

Change From Previous Month: -0.231% (-4,000 New Units)

  • Change From One Year Previous: +14.551% (+219,000 New Units)

---------------------------------------------------

Building Permits:
Predicted: 1,850,000
Actual: 1,819,000

Change From Previous Month: -3.193% (-60,000 New Permits)

  • Change From One Year Previous: +3.06%  (+54,000 New Permits)

----------------------------------------------------

Housing Starts: The top, yellow-highlighted figure is a measure of initial construction of single and multi-family residential units in the United States for the indicated month. Seasonally adjusted annual rate. The "predicted" figure is what economists were expecting, while the "actual" is the true or real figure.

If you're wondering about the demand for new homes in the United States, or about the American residential construction industry in general, then you should pay attention to the monthly Housing Starts report. This report also offers insight into specific types of consumer spending: when housing starts are up, demand for the stuff that a consumer would purchase for a new home (large appliances, consumer electronics, furniture, etc.) tends to also rise -- and vice versa.


=================

 
CHART: Housing Starts + Building Permits + Completions - April 2022 Update

CHART: Housing Starts
+ Building Permits
+ Completions
April 2022 Update

=================


================


Labels: , , , , , , , , , ,


--> www.FedPrimeRate.com Privacy Policy <--

>  SITEMAP  <

Tuesday, April 19, 2022

Housing Starts During March 2022

The U.S. Commerce Department this morning released its Housing Starts report for March 2022:

---------------------------------------------------

Housing Starts:
Predicted: 1,780,000
Actual: 1,793,000

Change From Previous Month: +0.28% (+5,000 New Units)

  • Change From One Year Previous: +3.942% (+68,000 New Units)

---------------------------------------------------

Building Permits:
Predicted: 1,850,000
Actual: 1,873,000

Change From Previous Month: +0.429% (+8,000 New Permits)

  • Change From One Year Previous: +6.724%  (+118,000 New Permits)

----------------------------------------------------

Housing Starts: The top, yellow-highlighted figure is a measure of initial construction of single and multi-family residential units in the United States for the indicated month. Seasonally adjusted annual rate. The "predicted" figure is what economists were expecting, while the "actual" is the true or real figure.

If you're wondering about the demand for new homes in the United States, or about the American residential construction industry in general, then you should pay attention to the monthly Housing Starts report. This report also offers insight into specific types of consumer spending: when housing starts are up, demand for the stuff that a consumer would purchase for a new home (large appliances, consumer electronics, furniture, etc.) tends to also rise -- and vice versa.


=================

 
CHART: Housing Starts - March 2022 Update

CHART: Housing Starts
March 2022 Update


=================


================


Labels: , , , , , , , , , ,


--> www.FedPrimeRate.com Privacy Policy <--

>  SITEMAP  <

Thursday, March 17, 2022

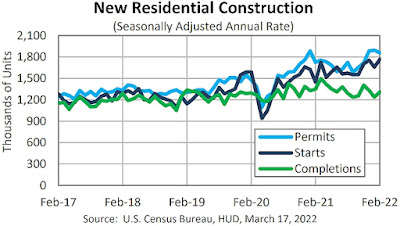
Housing Starts During February 2022

The U.S. Commerce Department this morning released its Housing Starts report for February 2022:

---------------------------------------------------

Housing Starts:
Predicted: 1,700,000
Actual: 1,769,000

Change From Previous Month: +6.76% (+112,000 New Units)

  • Change From One Year Previous: +22.25% (+322,000 New Units)

---------------------------------------------------

Building Permits:
Predicted: 1,800,000
Actual: 1,859,000

Change From Previous Month: -1.9% (-36,000 New Permits)

  • Change From One Year Previous: +7.71%  (+133,000 New Permits)

----------------------------------------------------

Housing Starts: The top, yellow-highlighted figure is a measure of initial construction of single and multi-family residential units in the United States for the indicated month. Seasonally adjusted annual rate. The "predicted" figure is what economists were expecting, while the "actual" is the true or real figure.

If you're wondering about the demand for new homes in the United States, or about the American residential construction industry in general, then you should pay attention to the monthly Housing Starts report. This report also offers insight into specific types of consumer spending: when housing starts are up, demand for the stuff that a consumer would purchase for a new home (large appliances, consumer electronics, furniture, etc.) tends to also rise -- and vice versa.


=================

 
CHART: Housing Starts - February 2022 Update

 CHART: Housing Starts
February 2022 Update
 
=================


================


Labels: , , , , , , , , , ,


--> www.FedPrimeRate.com Privacy Policy <--

>  SITEMAP  <

Monday, February 21, 2022

Housing Starts During January 2022

The U.S. Commerce Department this morning released its Housing Starts report for January 2022:

---------------------------------------------------

Housing Starts:
Predicted: 1,700,000
Actual: 1,638,000

Change From Previous Month: -4.098% (-70,000 New Units)
Change From One Year Previous: +0.8% (+13,000 New Units)

---------------------------------------------------

Building Permits:
Predicted: 1,800,000
Actual: 1,899,000

Change From Previous Month: +0.743% (+14,000 New Permits)
Change From One Year Previous: +0.85%  (+16,000 New Permits)

----------------------------------------------------

Housing Starts: The top, yellow-highlighted figure is a measure of initial construction of single and multi-family residential units in the United States for the indicated month. Seasonally adjusted annual rate. The "predicted" figure is what economists were expecting, while the "actual" is the true or real figure.

If you're wondering about the demand for new homes in the United States, or about the American residential construction industry in general, then you should pay attention to the monthly Housing Starts report. This report also offers insight into specific types of consumer spending: when housing starts are up, demand for the stuff that a consumer would purchase for a new home (large appliances, consumer electronics, furniture, etc.) tends to also rise -- and vice versa.


=================

CHART: Housing Starts - January 2022 Update

CHART: Housing Starts
January 2022 Update
 
=================


================


Labels: , , , , , , , , , ,


--> www.FedPrimeRate.com Privacy Policy <--

>  SITEMAP  <

Wednesday, January 19, 2022

Housing Starts During December 2021

The U.S. Commerce Department this morning released its Housing Starts report for December 2021:

---------------------------------------------------

Housing Starts:
Predicted: 1,700,000
Actual: 1,702,000

Change From Previous Month: +1.43% (+24,000 New Units)
Change From One Year Previous: +2.47% (+41,000 New Units)

---------------------------------------------------

Building Permits:
Predicted: 1,800,000
Actual: 1,873,000

Change From Previous Month: +9.09% (+156,000 New permits)
Change From One Year Previous: +6.54%  (+115,000 New Permits)

----------------------------------------------------

Housing Starts: The top, yellow-highlighted figure is a measure of initial construction of single and multi-family residential units in the United States for the indicated month. Seasonally adjusted annual rate. The "predicted" figure is what economists were expecting, while the "actual" is the true or real figure.

If you're wondering about the demand for new homes in the United States, or about the American residential construction industry in general, then you should pay attention to the monthly Housing Starts report. This report also offers insight into specific types of consumer spending: when housing starts are up, demand for the stuff that a consumer would purchase for a new home (large appliances, consumer electronics, furniture, etc.) tends to also rise -- and vice versa.


=================


CHART: Housing Starts - December 2021 Update

CHART: Housing Starts
December 2021 Update

=================


================


Labels: , , , , , , , , , ,


--> www.FedPrimeRate.com Privacy Policy <--

>  SITEMAP  <

Thursday, December 30, 2021

Pending Home Sales Index for November 2021

The Pending Home Sales Index (PHSI) report for November 2021 was released by The National Association of Realtors® (NAR) this morning:


==========

Predicted: Unchanged.

  • Actual: 122.4

==========

-- Previous Month (revised): 125.2

-- 12 Months Previous: 125.8

  •  Change from Previous Month: -2.236% (-2.8 points)

  •  Change from One Year Previous: -2.703% (-3.4 points)
==========


========
 
From the NAR website:

  • An index above 100 coincides with a historically high level of home sales activity.

  • An index of 100 is equal to the average level of contract activity during 2001, the first year to be analyzed. Coincidentally, 2001 was the first of four consecutive record years for existing-home sales. 2001 sales are fairly close to the higher level of home sales expected in the coming decade relative to the norms experienced in the mid-1990s. As such, an index of 100 coincides with a historically high level of home sales activity.
========
 
From Today's Report:

"...Pending home sales slipped in November, receding slightly after a previous month of gains, according to the National Association of Realtors®. Each of the four major U.S. regions witnessed contract transactions decline month-over-month. Year-over-year activity mostly retreated too, as three regions reported drops and only the Midwest saw an increase.

The Pending Home Sales Index (PHSI), www.nar.realtor/pending-home-sales, a forward-looking indicator of home sales based on contract signings, fell 2.2.% to 122.4 in November. Year-over-year, signings slid 2.7%. An index of 100 is equal to the level of contract activity in 2001.

"There was less pending home sales action this time around, which I would ascribe to low housing supply, but also to buyers being hesitant about home prices," said Lawrence Yun, NAR's chief economist. "While I expect neither a price reduction, nor another year of record-pace price gains, the market will see more inventory in 2022 and that will help some consumers with affordability."

Yun notes that housing demand continues to be high, explaining that homes placed on the market for sale go from "listed status" to "under contract" in approximately 18 days.

"Buyer competition alone is unrelenting, but home seekers have also had to contend with the negative impacts of supply chain disruptions and labor shortages this year," he said. "These aspects, along with the exorbitant prices and a lack of available homes, have created a much tougher buying season."

Yun adds that a countrywide surge of the omicron variant poses a risk to the housing market's performance, as buyers and sellers are sidelined, and home construction is delayed.

Realtor.com®'s Hottest Housing Markets (link is external) most recent data showed that out of the largest 40 metros, the most improved markets over the past year were Orlando-Kissimmee-Sanford, Fla.; Tampa-St. Petersburg, Fla.; Dallas-Fort Worth-Arlington, Texas; Jacksonville, Fla.; and Denver-Aurora-Lakewood, Colo..."
========
   
Housing Snapshot Pending Home Sales November 2021

 Housing Snapshot
Pending Home Sales
November 2021

 ========


Labels: , , , , , , , , , , , , , , , ,


--> www.FedPrimeRate.com Privacy Policy <--

>  SITEMAP  <

Thursday, December 16, 2021

Housing Starts During November 2021

The U.S. Commerce Department this morning released its Housing Starts report for November 2021:

---------------------------------------------------

Housing Starts:
Predicted: 1,600,000
Actual: 1,679,000

Change From Previous Month: +11.784% (+177,000 New Units)
Change From One Year Previous: +8.253% (+128,000 New Units)

---------------------------------------------------

Building Permits:
Predicted: 1,600,000
Actual: 1,712,000

Change From Previous Month: +3.569% (+59,000 New permits)
Change From One Year Previous: +0.943%  (+16,000 New Permits)

----------------------------------------------------

Housing Starts: The top, yellow-highlighted figure is a measure of initial construction of single and multi-family residential units in the United States for the indicated month. Seasonally adjusted annual rate. The "predicted" figure is what economists were expecting, while the "actual" is the true or real figure.

If you're wondering about the demand for new homes in the United States, or about the American residential construction industry in general, then you should pay attention to the monthly Housing Starts report. This report also offers insight into specific types of consumer spending: when housing starts are up, demand for the stuff that a consumer would purchase for a new home (large appliances, consumer electronics, furniture, etc.) tends to also rise -- and vice versa.


=================


CHART: Housing Starts - November 2021 Update

CHART: Housing Starts - November 2021 Update

=================


================


Labels: , , , , , , , , , ,


--> www.FedPrimeRate.com Privacy Policy <--

>  SITEMAP  <

Wednesday, November 17, 2021

Housing Starts During October 2021

The U.S. Commerce Department this morning released its Housing Starts report for October 2021:

---------------------------------------------------

Housing Starts:
Predicted: 1,600,000
Actual: 1,520,000

Change From Previous Month: -0.654% (-10,000 New Units)
Change From One Year Previous: +0.396% (+6,000 New Units)

---------------------------------------------------

Building Permits:
Predicted: 1,600,000
Actual: 1,650,000

Change From Previous Month: +4.035% (+64,000 New permits)
Change From One Year Previous: +3.448%  (+55,000 New Permits)

----------------------------------------------------

Housing Starts: The top, yellow-highlighted figure is a measure of initial construction of single and multi-family residential units in the United States for the indicated month. Seasonally adjusted annual rate. The "predicted" figure is what economists were expecting, while the "actual" is the true or real figure.

If you're wondering about the demand for new homes in the United States, or about the American residential construction industry in general, then you should pay attention to the monthly Housing Starts report. This report also offers insight into specific types of consumer spending: when housing starts are up, demand for the stuff that a consumer would purchase for a new home (large appliances, consumer electronics, furniture, etc.) tends to also rise -- and vice versa.


=================


CHART: Housing Starts - October 2021 Update

CHART: Housing Starts - October 2021 Update

=================


================


Labels: , , , , , , , , , ,


--> www.FedPrimeRate.com Privacy Policy <--

>  SITEMAP  <

bing

bing


SCAMS!

FedPrimeRate.com
Entire Website © 1999 - 2025 FedPrimeRate.comSM


This website is neither affiliated nor associated with The United States Federal Reserve
in any way. Information in this website is provided for educational purposes only. The owners
of this website make no warranties with respect to any and all content contained within this
website. Consult a financial professional before making important decisions related to any
investment or loan product, including, but not limited to, business loans, personal loans,
education loans, first or second mortgages, credit cards, car loans or any type of insurance.