.comment-link {margin-left:.6em;}

Economy

Economic Data (USA)

Thursday, January 16, 2025

U.S. Retail And Food Services Sales Report for December 2024

The Commerce Department this morning released advance estimates of U.S. Retail and Food Services Sales for December 2024:

=================

Previous Month (revised): +0.8%

  • Actual: +0.45% (+3,266,000)
=================

The yellow-highlighted percentage above represents the month-to-month , seasonally adjusted change in total sales receipts for retailers that sell durable and non-durable goods, and retailers that provide food and beverage services.

=================

  • Est. Retail Sales During December 2024: 729,191,000,000
  • Change From A Year Ago: +3.92% (+$27,519,000,000)

=================

CHART: Retail Sales - Monthly January 2005 Thru December 2025 - DECEMBER 2024 UPDATE
CHART: Retail Sales - Monthly
January 2005 Thru December 2025
DECEMBER 2024 UPDATE
=================

=================

Labels: , , , , , , , , ,


--> www.FedPrimeRate.com Privacy Policy <--

>  SITEMAP  <

Friday, November 15, 2024

U.S. Retail And Food Services Sales Report for October 2024

The Commerce Department this morning released advance estimates of U.S. Retail and Food Services Sales for October 2024:

=================

Previous Month (revised): +0.8%

  • Actual: +0.4% (+2,841,000)
=================

The yellow-highlighted percentage above represents the month-to-month , seasonally adjusted change in total sales receipts for retailers that sell durable and non-durable goods, and retailers that provide food and beverage services.

=================

  • Est. Retail Sales During October 2024: 718,867,000,000
  • Change From A Year Ago: +2.85% (+$19,911,000,000)

=================

CHART: Retail Sales - Monthly January 2004 Thru December 2024 -- OCTOBER 2024 UPDATE - Seasonally Adjusted
CHART: Retail Sales - Monthly
January 2004 Thru December 2024
OCTOBER 2024 UPDATE - Seasonally Adjusted
=================

=================

Labels: , , , , , , , , ,


--> www.FedPrimeRate.com Privacy Policy <--

>  SITEMAP  <

Thursday, August 15, 2024

U.S. Retail And Food Services Sales Report for July 2024

The Commerce Department this morning released advance estimates of U.S. Retail and Food Services Sales for July 2024:

=================

Previous Month (revised): -0.2%

  • Actual: +0.97% (+6,806,000)
=================

The yellow-highlighted percentage above represents the month-to-month , seasonally adjusted change in total sales receipts for retailers that sell durable and non-durable goods, and retailers that provide food and beverage services.

=================

  • Estimated Retail Sales During July 2024: $709,668,000,000
  • Change From A Year Ago: +2.66% (+$18,418,000,000)

=================
CHART: Retail Sales - Monthly January 2004 Thru December 2024 JULY 2024 UPDATE - Seasonally Adjusted
CHART: Retail Sales - Monthly
January 2004 Thru December 2024
JULY 2024 UPDATE - Seasonally Adjusted

=================

=================

Labels: , , , , , , , , ,


--> www.FedPrimeRate.com Privacy Policy <--

>  SITEMAP  <

Wednesday, July 17, 2024

U.S. Retail And Food Services Sales Report for June 2024

The Commerce Department this morning released advance estimates of U.S. Retail and Food Services Sales for June 2024:

=================

Previous Month (revised): +0.3%

  • Actual:  -0.023% (-159,000)
=================

The yellow-highlighted percentage above represents the month-to-month , seasonally adjusted change in total sales receipts for retailers that sell durable and non-durable goods, and retailers that provide food and beverage services.

=================

  • Estimated Retail Sales During June 2024: $704,324,000,000
  • Change From A Year Ago: +2.28% (+$15,694,000,000)

=================
CHART: Retail Sales - Monthly January 2004 Thru December 2024 JUNE 2024 UPDATE - Seasonally Adjusted
CHART: Retail Sales - Monthly
January 2004 Thru December 2024
JUNE 2024 UPDATE - Seasonally Adjusted
=================

=================

Labels: , , , , , , , , ,


--> www.FedPrimeRate.com Privacy Policy <--

>  SITEMAP  <

Wednesday, June 19, 2024

U.S. Retail And Food Services Sales Report for May 2024

The Commerce Department this morning released advance estimates of U.S. Retail and Food Services Sales for May 2024:

Previous Month (revised): -0.2%
  • Actual:  +0.09%(+630,000)

The yellow-highlighted percentage above represents the month-to-month , seasonally adjusted change in total sales receipts for retailers that sell durable and non-durable goods, and retailers that provide food and beverage services.

=================

  • Estimated Retail Sales During May 2024: $703,088,000,000
  • Change From A Year Ago: +2.27% (+$15,618,000,000)

=================

CHART: Retail Sales - Monthly January 2004 Thru December 2024 Seasonally Adjusted
CHART: Retail Sales - Monthly
January 2004 Thru December 2024
Seasonally Adjusted

=================

=================

Labels: , , , , , , , , ,


--> www.FedPrimeRate.com Privacy Policy <--

>  SITEMAP  <

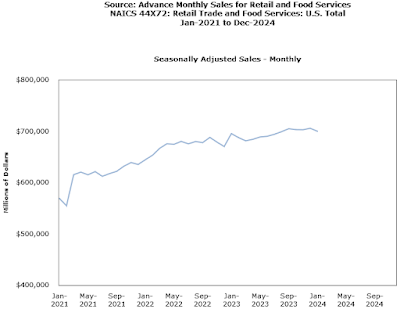
Friday, February 16, 2024

U.S. Retail And Food Services Sales Report for January 2024

The Commerce Department this morning released advance estimates of U.S. Retail and Food Services Sales for January 2024:

Previous Month: +0.4%
  • Actual:  -0.83%(-$5,889,000)

The yellow-highlighted percentage above represents the month-to-month , seasonally adjusted change in total sales receipts for retailers that sell durable and non-durable goods, and retailers that provide food and beverage services.

=================

  • Estimated Retail Sales During January 2024: $700,291,000,000
  • Change From A Year Ago: +0.65% (+$4,515,000,000)

=================

CHART: Retail Sales - Monthly January 2021 Thru December 2024 Seasonally Adjusted
CHART: Retail Sales - Monthly
January 2021 Thru December 2024
Seasonally Adjusted

=================

================= 

Labels: , , , , , , , , ,


--> www.FedPrimeRate.com Privacy Policy <--

>  SITEMAP  <

Saturday, January 20, 2024

U.S. Retail And Food Services Sales Report for December 2023

The Commerce Department this morning released advance estimates of U.S. Retail and Food Services Sales for December 2023:

Previous Month+0.3%
  • Actual:  +0.554%(+$3,909,000)

The yellow-highlighted percentage above represents the month-to-month , seasonally adjusted change in total sales receipts for retailers that sell durable and non-durable goods, and retailers that provide food and beverage services.

=================

  • Estimated Retail Sales During December 2023: $709,890,000,000
  • Change From 12 Months Previous: +5.59% (+$37,554,000,000)

=================

CHART: Retail Sales - Monthly January 2021 Thru December 2023 Seasonally Adjusted
CHART: Retail Sales - Monthly
January 2021 Thru December 2023
Seasonally Adjusted

=================

================= 
 

Labels: , , , , , , , , ,


--> www.FedPrimeRate.com Privacy Policy <--

>  SITEMAP  <

Friday, November 17, 2023

U.S. Retail And Food Services Sales Report for October 2023

The Commerce Department this morning released advance estimates of U.S. Retail and Food Services Sales for October 2023:

Predicted: -0.2%
  • Actual:  -0.106%(-$747,000)

The yellow-highlighted percentage above represents the month-to-month , seasonally adjusted change in total sales receipts for retailers that sell durable and non-durable goods, and retailers that provide food and beverage services.

=================

  • Estimated Retail Sales During October 2023: $704,954,000,000
  • Change From 12 Months Previous: +2.48% (+$17,083,000,000)

=================

CHART: Retail Sales - Monthly January 2021 Thru October 2023 Seasonally Adjusted
CHART: Retail Sales - Monthly
January 2021 Thru October 2023
Seasonally Adjusted

=================

================= 
 

Labels: , , , , , , , , ,


--> www.FedPrimeRate.com Privacy Policy <--

>  SITEMAP  <

Tuesday, October 17, 2023

U.S. Retail And Food Services Sales Report for September 2023

The Commerce Department this morning released advance estimates of U.S. Retail and Food Services Sales for September 2023:

Predicted: +0.5%
  • Actual:  +0.714%(+$4,999,000)

The yellow-highlighted percentage above represents the month-to-month change in total sales receipts for retailers that sell durable and non-durable goods, and retailers that provide food and beverage services.

=================

  • Estimated Retail Sales During September 2023: $704,881,000,000
  • Change From 12 Months Previous: +3.75% (+$25,502,000,000)

=================
CHART: Retail Sales - Monthly January 2021 Thru September 2023 Seasonally Adjusted
CHART: Retail Sales - Monthly
January 2021 Thru September 2023
Seasonally Adjusted

=================

=================

Labels: , , , , , , , , ,


--> www.FedPrimeRate.com Privacy Policy <--

>  SITEMAP  <

Tuesday, August 15, 2023

U.S. Retail And Food Services Sales Report for July 2023

The Commerce Department this morning released advance estimates of U.S. Retail and Food Services Sales for July 2023:

Predicted: +0.5%
  • Actual:  +0.73%(+$5,042,000)

The yellow-highlighted percentage above represents the month-to-month change in total sales receipts for retailers that sell durable and non-durable goods, and retailers that provide food and beverage services.

=================

  • Estimated Retail Sales During July 2023: $696,354,000,000
  • Change From 12 Months Previous: +3.17% (+$21,422,000,000)

=================

CHART: Retail Sales - Monthly January 2022 Thru July 2023 Seasonally Adjusted
CHART: Retail Sales - Monthly
January 2022 Thru July 2023
Seasonally Adjusted

=================

=================

Labels: , , , , , , , , ,


--> www.FedPrimeRate.com Privacy Policy <--

>  SITEMAP  <

Tuesday, July 18, 2023

U.S. Retail And Food Services Sales Report for June 2023

The Commerce Department this morning released advance estimates of U.S. Retail and Food Services Sales for June 2023:

Predicted: +0.5%
  • Actual:  +0.194%(+$1,338,000)

The yellow-highlighted percentage above represents the month-to-month change in total sales receipts for retailers that sell durable and non-durable goods, and retailers that provide food and beverage services.

=================

  • Estimated Retail Sales During June 2023: $689,499,000,000
  • Change From 12 Months Previous: +1.49% (+$10,123,000,000)

=================
 
CHART: Retail Sales During - June 2023
CHART: Retail Sales During June 2023

=================

=================

Labels: , , , , , , , , ,


--> www.FedPrimeRate.com Privacy Policy <--

>  SITEMAP  <

Wednesday, May 17, 2023

U.S. Retail And Food Services Sales Report for April 2023

The Commerce Department this morning released advance estimates of U.S. Retail and Food Services Sales for April 2023:

Predicted: +0.5%
  • Actual:  +0.421%(+$2,873,000)

The yellow-highlighted percentage above represents the month-to-month change in total sales receipts for retailers that sell durable and non-durable goods, and retailers that provide food and beverage services.

=================

  • Estimated Retail Sales During April 2023: $686,052,000,000
  • Change From 12 Months Previous: +1.57% (+$10,775,000,000)

=================
 
CHART: Retail Sales During 2023
CHART: Retail Sales During April 2023

=================

=================

Labels: , , , , , , , ,


--> www.FedPrimeRate.com Privacy Policy <--

>  SITEMAP  <

Thursday, November 17, 2022

U.S. Retail And Food Services Sales Report for October 2022

The Commerce Department this morning released advance estimates of U.S. Retail and Food Services Sales for October 2022:

Predicted: +1.0%
  • Actual:  +1.272%(+$8,724,000)

The yellow-highlighted percentage above represents the month-to-month change in total sales receipts for retailers that sell durable and non-durable goods, and retailers that provide food and beverage services.

=================

  • Estimated Retail Sales During October 2022: $694,518,000,000
  • Change From 12 Months Previous: +8.27% (+$53,059,000,000)

=================
 

U.S. Retail And Food Services Sales Report for October 2022
Retail Sales for October 2022

=================

=================

Labels: , , , , , , , , , , ,


--> www.FedPrimeRate.com Privacy Policy <--

>  SITEMAP  <

Wednesday, August 17, 2022

U.S. Retail And Food Services Sales Report for July 2022

The Commerce Department this morning released advance estimates of U.S. Retail and Food Services Sales for July 2022:

Predicted: FLAT
  • Actual:  +0.034%(+$230,000)

The yellow-highlighted percentage above represents the month-to-month change in total sales receipts for retailers that sell durable and non-durable goods, and retailers that provide food and beverage services.

=================

  • Estimated Retail Sales During July 2022: $682,815,000,000
  • Change From 12 Months Previous: +10.277% (+$63,635,000,000)

=================
 
CHART: Retail Sales - July 2022 Update

=================

================= 


Labels: , , , , , , , , , , ,


--> www.FedPrimeRate.com Privacy Policy <--

>  SITEMAP  <

Thursday, June 16, 2022

U.S. Retail And Food Services Sales Report for May 2022

The Commerce Department this morning released advance estimates of U.S. Retail and Food Services Sales for May 2022:

Predicted: FLAT
  • Actual: -0.267% (-$1,800,000,000)

The yellow-highlighted percentage above represents the month-to-month change in total sales receipts for retailers that sell durable and non-durable goods, and retailers that provide food and beverage services.

=================

  • Estimated Retail Sales During May 2022: $672,874,000,000
  • Change From 12 Months Previous: +8.09% (+$50,351,000,000)

=================
 

CHART: Retail Sales - May 2022 Update
=================

================= 
 

Labels: , , , , , , , , , , ,


--> www.FedPrimeRate.com Privacy Policy <--

>  SITEMAP  <

Tuesday, May 17, 2022

U.S. Retail And Food Services Sales Report for April 2022

The Commerce Department this morning released advance estimates of U.S. Retail and Food Services Sales for April 2022:

Predicted: +0.5%
  • Actual: +0.903% (+$6,063,000,000)

The yellow-highlighted percentage above represents the month-to-month change in total sales receipts for retailers that sell durable and non-durable goods, and retailers that provide food and beverage services.

=================

  • Estimated Retail Sales During April 2022: $677,711,000,000
  • Change From 12 Months Previous: +8.186% (+$51,281,000,000)

=================
 

CHART: Retail Sales - April 2022 Update

CHART: Retail Sales - April 2022 Update

=================

================= 
 

Labels: , , , , , , , , , , ,


--> www.FedPrimeRate.com Privacy Policy <--

>  SITEMAP  <

Thursday, April 14, 2022

U.S. Retail And Food Services Sales Report for March 2022

The Commerce Department this morning released advance estimates of U.S. Retail and Food Services Sales for March 2022:

Predicted: +0.5%
  • Actual: +0.5% (+$3,309,000,000)

The yellow-highlighted percentage above represents the month-to-month change in total sales receipts for retailers that sell durable and non-durable goods, and retailers that provide food and beverage services.

=================

  • Estimated Retail Sales During March2022: $665,726,000,000
  • Change From 12 Months Previous: +6.876% (+$42,829,000,000)

=================
 
CHART: Retail Sales - March 2022 Update

=================

================= 
 

Labels: , , , , , , , , , ,


--> www.FedPrimeRate.com Privacy Policy <--

>  SITEMAP  <

Wednesday, March 16, 2022

U.S. Retail And Food Services Sales Report for February 2022

The Commerce Department this morning released advance estimates of U.S. Retail and Food Services Sales for February 2022:

Predicted: +0.5%
  • Actual: +0.307% (+$2,011,000,000)

The yellow-highlighted percentage above represents the month-to-month change in total sales receipts for retailers that sell durable and non-durable goods, and retailers that provide food and beverage services.

=================

  • Estimated Retail Sales During February 2022: $662,417,000,000
  • Change From 12 Months Previous: +17.617% (+$98,574,000,000)

=================
 

CHART: Retail Sales - February 2022 Update

CHART: Retail Sales - February 2022 Update

=================

================= 
 

Labels: , , , , , , , , , ,


--> www.FedPrimeRate.com Privacy Policy <--

>  SITEMAP  <

Wednesday, February 16, 2022

U.S. Retail And Food Services Sales Report for January 2022

The Commerce Department this morning released advance estimates of U.S. Retail and Food Services Sales for January 2022:

Predicted: +3.0%
  • Actual: +3.75% (+23,487,000,000)

The yellow-highlighted percentage above represents the month-to-month change in total sales receipts for retailers that sell durable and non-durable goods, and retailers that provide food and beverage services.

=================

  • Estimated Retail Sales During January 2022: $649,776,000,000
  • Change From 12 Months Previous: +12.96% (+$74,531,000,000)

=================
 

CHART: Retail Sales - January 2022 Update

CHART: Retail Sales - January 2022 Update

=================

================= 
 

Labels: , , , , , , , , ,


--> www.FedPrimeRate.com Privacy Policy <--

>  SITEMAP  <

Friday, January 14, 2022

U.S. Retail And Food Services Sales Report for December 2021

The Commerce Department this morning released advance estimates of U.S. Retail and Food Services Sales for December 2021:

Predicted: Unchanged
  • Actual: -1.914% (-$12,234,000,000)

The yellow-highlighted percentage above represents the month-to-month change in total sales receipts for retailers that sell durable and non-durable goods, and retailers that provide food and beverage services.

=================

  • Estimated Retail Sales During December 2021: $626,833,000,000
  • Change From 12 Months Previous: +16.95% (+$90,848,000,000)

=================
 

CHART: Retail Sales - December 2021 Update

CHART: Retail Sales - December 2021 Update
 
=================

================= 
 

Labels: , , , , , , , , ,


--> www.FedPrimeRate.com Privacy Policy <--

>  SITEMAP  <

bing

bing


SCAMS!

FedPrimeRate.com
Entire Website © 1999 - 2025 FedPrimeRate.comSM


This website is neither affiliated nor associated with The United States Federal Reserve
in any way. Information in this website is provided for educational purposes only. The owners
of this website make no warranties with respect to any and all content contained within this
website. Consult a financial professional before making important decisions related to any
investment or loan product, including, but not limited to, business loans, personal loans,
education loans, first or second mortgages, credit cards, car loans or any type of insurance.