.comment-link {margin-left:.6em;}

Economy

Economic Data (USA)

Tuesday, January 31, 2017

Consumer Confidence Index (CCI) for January 2017

The Consumer Confidence Index® (CCI) for this month (January 2017) was released by The Conference Board® this morning:

Predicted: 112.2
Actual: 111.8

The "predicted" figure is what economists were expecting, while the "actual" is the true or real figure.

From Today's Report:

"...'Consumer confidence decreased in January, after reaching a 15-year high in December (August 2001 = 114.0),' said Lynn Franco, Director of Economic Indicators at The Conference Board. 'The decline in confidence was driven solely by a less optimistic outlook for business conditions, jobs, and especially consumers’ income prospects. Consumers’ assessment of current conditions, on the other hand, improved in January. Despite the retreat in confidence, consumers remain confident that the economy will continue to expand in the coming months'..."

Every month, The Conference Board sends a questionnaire to 5,000 U.S. households. Survey participants are polled about their feelings regarding the U.S. economy, current and future, and about their own fiscal circumstances. On average, 3,500 participants complete and return the 5-question survey.

The baseline "100" score for the CCI is associated with 1985 survey data.

When consumers feel good about the economy, they tend to do more spending, and vice versa.

Based in New York City, The Conference Board is a private, not-for-profit organization with a mission to, "create and disseminate knowledge about management and the marketplace to help businesses strengthen their performance and better serve society."

The CCI is usually released on the last Tuesday of the month.

Last month, the CCI was 113.3 (revised.)


Labels: ,


--> www.FedPrimeRate.com Privacy Policy <--

>  SITEMAP  <

Monday, January 30, 2017

PCE Price Index + Personal Income + Consumer Spending Report for December 2016

Earlier today, the Commerce Department's Bureau of Economic Analysis (BEA) released its report on The PCE Price Index, Consumer Spending and Personal Income for December 2016:

Consumer Spending (Personal Consumption Expenditures)
Predicted: +0.5%
Actual: +0.5%

----------------------

Personal Income
Predicted: +0.4%
Actual: 0.3%


The highlighted percentages represent the month-to-month change in Consumer Spending (aka Personal Consumption Expenditures) and Personal Income for the entire United States.

=====================
=====================

Personal Consumption Expenditures (PCE) Price Index
Predicted: +0.2%
Actual: +0.2%

  • Change from 12 months previous: +1.6%
=====================

Core PCE Price Index
( = PCE Price Index minus food and energy)
Predicted: +0.2%
Actual: +0.1%

  • Change from 12 months previous: +1.7%
=====================

The yellow-highlighted percentages represent the month-to-month change in the prices associated with domestic personal consumption.  The PCE Price Index is different from the Consumer Price Index (CPI) in that it is a very broad measure of the prices associated with domestic products and services, while the CPI measures a more limited fixed basket of goods and services.

The broad nature of the PCE Price Index is key to why it is the Federal Reserve's preferred measure of inflation.  The Federal Open Market Committee (FOMC) pays very close attention to it.

=====================

The "predicted" figures are what economists were expecting, while the "actual" figures are the true or real figure.


Labels: , , , , , , , ,


--> www.FedPrimeRate.com Privacy Policy <--

>  SITEMAP  <

Friday, January 27, 2017

Consumer Sentiment: Final Result for January 2017

The University of Michigan's Index of Consumer Sentiment (ICS) - Final Result for January 2017 was released today:

Predicted: 98.2
Actual: 98.5

  • Change from Last Month: +0.3055%
  • Change from 12 Months Ago: +7.0652%

=========

From today's report:

"...Consumers expressed a higher level of confidence January than any other time in the last dozen years. The post-election surge in confidence was driven by a more optimistic outlook for the economy and job growth during the year ahead as well as more favorable economic prospects over the next five years. Consumers also reported much more positive assessments of their current financial situation due to gains in both incomes and household wealth, and anticipated the most positive outlook for their personal finances in more than a decade.

Consumers have become more convinced that the stronger economy would finally prompt the Fed to increase interest rates at a quicker pace, which caused one-in-five consumers to favor borrowing-in-advance of anticipated increases in mortgage rates, the highest level in more than twenty years.

Overall, the post-election surge in consumer confidence was based on political promises, and not, as yet, on economic outcomes. Moreover, over the past half century the surveys have never recorded as dominant an impact of partisanship on economic expectations. When the same consumers were re-interviewed from six months ago, the survey recorded extreme swings based on political party affiliation, with Democrats becoming much more pessimistic and Republicans much more optimistic. Such divergences will ultimately converge since consumers hold economic expectations to be useful decision guides, which will require both sides to temper their extreme views..."

=========

The ICS is derived from the following five survey questions:

  1. "We are interested in how people are getting along financially these days. Would you say that you (and your family living there) are better off or worse off financially than you were a year ago?"


  2. "Now looking ahead, do you think that a year from now you (and your family living there) will be better off financially, or worse off, or just about the same as now?"


  3. "Now turning to business conditions in the country as a whole, do you think that during the next twelve months we'll have good times financially, or bad times, or what?"


  4. "Looking ahead, which would you say is more likely: that in the country as a whole we'll have continuous good times during the next five years or so, or that we will have periods of widespread unemployment or depression, or what?"


  5. "About the big things people buy for their homes, such as furniture, a refrigerator, stove, television, and things like that. Generally speaking, do you think now is a good or bad time for people to buy major household items?"

=========


=========

The ICS uses a 1966 baseline, i.e. for 1966, the ICS = 100. So any number that is below the 1966 baseline of 100 means that the folks who were polled recently aren't as optimistic about the U.S. economy as the sample that was polled back in 1966.

The ICS is similar to the Consumer Confidence Index in that they both measure consumer attitudes and offer valuable insight into consumer spending.

=========

The "predicted" figure is what economists were expecting, while the "actual" is the true or real figure.

=========

Last month's final ICS reading was 98.2.


Labels:


--> www.FedPrimeRate.com Privacy Policy <--

>  SITEMAP  <

Durable Goods Orders During December 2016

The Durable Goods Orders report for December 2016 was released by the Commerce Department this morning:

Predicted: +2.6%
Actual: -0.4%

================

  • Previous month, revised: -4.8%

  • Change from 12 months previous: +1.6%
================

The highlighted figure represents the month-to-month change in orders for durable or hard goods for immediate or future delivery from U.S. manufacturers. Examples of durable goods: cars, airplanes, computers, furniture -- items that are built to last at least three years.

The "predicted" figure is what economists were expecting, while the "actual" is the true or real figure. The Durable Goods Orders report is produced by the Commerce Department.

Click here to view the full Commerce Department report (PDF).

Labels:


--> www.FedPrimeRate.com Privacy Policy <--

>  SITEMAP  <

Gross Domestic Product (GDP) First Estimate Released Today for Q4, 2016

The U.S. Gross Domestic Product (GDP) "advance" (first estimate) report for the fourth quarter of 2016 was released this morning by the Commerce Department's Bureau of Economic Analysis (BEA):

Predicted: +2.2%
Actual: +1.9%

The highlighted figure represents the quarter-to-quarter change in the Gross Domestic Product for the United States.

The GDP is the broadest measure of economic activity in the entire United States, covering all sectors of the economy.

The "advance" estimate is based on data that are subject to future revision.

----------------------------------

GDP - First Estimate - Q4 2016
----------------------------------

  • On February 28, 2017, the Commerce Department will release a "preliminary" GDP report for Q4 2016, which will contain a second estimate (more accurate data.)

  • On March 30, 2017, a "final" GDP report will be released by the BEA, which will contain the government's best estimates for Q4 2016.

Click here to view the full Commerce Department report.


Labels: ,


--> www.FedPrimeRate.com Privacy Policy <--

>  SITEMAP  <

Thursday, January 26, 2017

New Home Sales During December 2016

The December 2016 New Home Sales report was released by the Commerce Department this morning:

Predicted: 593,000
Actual New Home Sales: 536,000

------------------------------------------------------

Change from One Month Previous: -10.4%

Change from One Year Previous: -0.4%

------------------------------------------------------

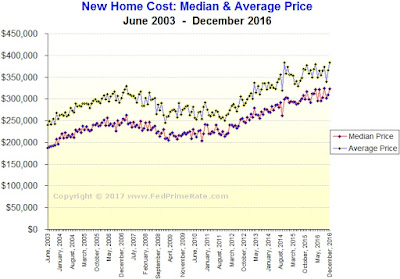
Median Price for a New Home during December: $322,500

Average Price for a New Home during December: $384,000


------------------------------------------------------

New Home Sales During December 2016
------------------------------------------------------

From today's report:

"...An estimated 563,000 new homes were sold in 2016. This is 12.2 percent (±3.5%) above the 2015 figure of 501,000..."

------------------------------------------------------

Compiled jointly by the U.S. Commerce Department and the U.S. Department of Housing and Urban Development, the monthly New Home Sales report measures the number of newly-built homes with committed buyers during the indicated month.

The "predicted" figure is what economists were expecting, while the "actual" is the true or real figure.

The New Home Sales report is watched by economists and investors because it offers insight into the state of the U.S. housing market, and also provides data that can be used to predict sales of large household furniture and appliances like refrigerators, air conditioners, microwave ovens, etc.


Labels: ,


--> www.FedPrimeRate.com Privacy Policy <--

>  SITEMAP  <

New Unemployment Insurance Claims for The Week of January 21, 2017

Earlier today, the Labor Department released its weekly report on New Jobless Insurance Claims for the week that ended on January 21, 2017:

Predicted: 246,000
Actual: 259,000

The yellow-highlighted figure represents the number of first-time claims for unemployment benefits for the entire United States. The "predicted" figure is what economists were expecting, while the "actual" is the true or real figure.

  • Last Week (revised): 237,000
  • 4-Week Moving Average: 245,500

========


Labels: , ,


--> www.FedPrimeRate.com Privacy Policy <--

>  SITEMAP  <

Leading Economic Index for December 2016

The Conference Board® released its Leading Economic Index® for December 2016 this morning:

==============

Index for December: 124.6 (The baseline 100 score is associated with 2010 data.)

Predicted: +0.4%
Actual: +0.5%

  • Previous Month: +0.1%

  • 2 Months Previous: +0.2%
==============


The yellow-highlighted percentage represents the month-to-month change for the index.  The "predicted" figure is what economists were expecting, while the "actual" is the true or real figure.

The Leading Economic Indicators Index is a composite of 10 of the nation's economic data releases that's put together by The Conference Board. Statistically, the components listed below have shown a significant increase or decrease before national economic upturns or downturns:

  1. The Standard + Poor's 500 Index

  2. Average weekly claims for unemployment insurance

  3. Building permits for new private housing

  4. The interest rate spread between the yield on the benchmark 10-Year Treasury Note and Federal Funds

  5. ISM® Index of New Orders

  6. Manufacturer's new orders for consumer goods or materials

  7. Manufacturers' new orders, nondefense capital goods excluding aircraft orders

  8. Average weekly manufacturing hours

  9. Average consumer expectations for business conditions

  10. Leading Credit Index™

Labels: ,


--> www.FedPrimeRate.com Privacy Policy <--

>  SITEMAP  <

Wednesday, January 25, 2017

Crude Oil Inventories Report for Week of January 20, 2017

The U.S. Crude Oil Inventories report for the week that ended on January 20, 2017 was released this morning:

Weekly Change: +2,800,000 Barrels

Yearly Change: +24,700,000 Barrels

Current U.S. Crude Oil Stocks: 488,300,000 Barrels

Diminishing crude oil inventories often translate to higher crude oil prices (and vice versa), but not always.

The report is produced by the U.S. Energy Information Administration (EIA).

Labels: , ,


--> www.FedPrimeRate.com Privacy Policy <--

>  SITEMAP  <

Tuesday, January 24, 2017

Existing Home Sales During December 2016

The Existing Home Sales report for December 2016 was released by The National Association of Realtors® this morning:

Predicted: 5,550,000
Actual: 5,490,000

Change from Previous Month: -2.8%
Change from One Year Previous: +0.7%

Inventory: 1,650,000 (3.6 months supply)

==========

The "actual" figure above represents the preliminary, seasonally adjusted annualized sales count of existing homes, co-ops and condominiums for last month. The "predicted" figure is what economists were expecting, while the "actual" is the true or real figure.

------------------------------------------------------

Median Price for A Used Home During December 2016: $232,200
Change from One Year Previous: +4.0%

---------

Average Price for A Used Home During December 2016: $274,000
Change from One Year Previous: +3.0%

------------------------------------------------------ 

Click here for historical prices and a chart.


==========

Existing Home Sales During December 2016

==========

  • The monthly Existing Home Sales report is released on or around the 25TH day of each month.
Click here to view the NAR report.

Labels: ,


--> www.FedPrimeRate.com Privacy Policy <--

>  SITEMAP  <

Thursday, January 19, 2017

Crude Oil Inventories Report for Week of January 13, 2017

The U.S. Crude Oil Inventories report for the week that ended on January 13, 2017 was released this morning:

Weekly Change: +2,300,000 Barrels

Yearly Change: +30,300,000 Barrels

Current U.S. Crude Oil Stocks: 485,500,000 Barrels

Diminishing crude oil inventories often translate to higher crude oil prices (and vice versa), but not always.

The report is produced by the U.S. Energy Information Administration (EIA).

Labels: , ,


--> www.FedPrimeRate.com Privacy Policy <--

>  SITEMAP  <

Housing Starts During December 2016

The U.S. Commerce Department this morning released its Housing Starts report for December 2016:

---------------------------------------------------

Housing Starts:
Predicted: 1,200,000
Actual: 1,226,000

Change From Previous Month: +11.3%
Change From One Year Previous: +5.7%

---------------------------------------------------

Building Permits:
Predicted: 1,230,000
Actual: 1,210,000

Change From Previous Month: -0.2%
Change From One Year Previous: +0.7%

----------------------------------------------------

Housing Starts: The above is a measure of initial construction of single and multi-family residential units in the United States for the indicated month. The "predicted" figure is what economists were expecting, while the "actual" is the true or real figure.

If you're wondering about the demand for new homes in the United States,or about the American construction industry in general, then you should pay attention to the monthly Housing Starts report. This report also offers insight into specific types of consumer spending: when housing starts are up, demand for the stuff that a consumer would purchase for a new home (large appliances, consumer electronics, furniture, etc.) tends to also rise --  and vice versa.

Click here to view the full Commerce Department report (PDF).

Labels: , ,


--> www.FedPrimeRate.com Privacy Policy <--

>  SITEMAP  <

New Unemployment Insurance Claims for The Week of January 14, 2017

Earlier today, the Labor Department released its weekly report on New Jobless Insurance Claims for the week that ended on January 14, 2017:

Predicted: 255,000
Actual: 234,000

The yellow-highlighted figure represents the number of first-time claims for unemployment benefits for the entire United States. The "predicted" figure is what economists were expecting, while the "actual" is the true or real figure.

  • Last Week (revised): 249,000
  • 4-Week Moving Average: 246,750

======


Labels: , ,


--> www.FedPrimeRate.com Privacy Policy <--

>  SITEMAP  <

Wednesday, January 18, 2017

Industrial Production + Manufacturing + Capacity Utilization for December 2016

The Industrial Production, Manufacturing and Capacity Utilization numbers for December 2016 were released by the Federal Reserve this morning:

Industrial Production:
Predicted: +0.6%
Actual: +0.8%

Manufacturing:
Predicted: +0.3%
Actual: +0.2%

The above numbers (highlighted) represent the month-to-month change in manufacturing, and physical output from mining operations, utility plants and factories for the entire United States.

Capacity Utilization Rate:
Predicted: 75.4%
Actual: 75.5

The Capacity Utilization Rate represents the use of available resources at mining operations, utility plants and factories for the entire United States last month.

The "predicted" figures are what economists were expecting, while the "actual" is the true or real figure.

Click here to view the full Federal Reserve report
 

Labels: , ,


--> www.FedPrimeRate.com Privacy Policy <--

>  SITEMAP  <

Consumer Price Index (CPI) for December 2016

Earlier this morning, the Labor Department's Bureau of Labor Statistics released the Consumer Price Index (CPI) for December 2016:

=========================================

Predicted: +0.3%
Actual: +0.3%

(Change from 12 months previous: +2.1%)

=========================================

Below is the CPI when food and energy are removed, also known as core CPI:

Predicted: +0.2%
Actual: +0.2%

(Change from 12 months previous: +2.2%)

=========================================

The above, yellow-highlighted figures represent the seasonally adjusted, month-to-month change in prices for a specific group of goods and services that consumers buy, and is, therefore, a very important part of the overall inflation picture for the country.

The "predicted" figure is what economists were expecting, while the "actual" is the true or real figure.

General categories that constitute the CPI are:

  • Healthcare
  • Housing
  • Clothing
  • Communications
  • Education
  • Transportation
  • Food and Beverages
  • Recreation
  • Miscellaneous Goods and Services (grooming expenses, etc.)
Click here to view the full Labor Department report.

Labels: , ,


--> www.FedPrimeRate.com Privacy Policy <--

>  SITEMAP  <

Friday, January 13, 2017

Producer Price Index - Final Demand (PPI-FD) for December 2016

The Producer Price Index - Final Demand (PPI-FD) for December 2016 was released this morning:

Predicted: +0.3%
Actual: +0.3%

Change from 12 months previous: +1.6%

=============

Below is the PPI-FD when food and energy are removed:

Predicted: +0.1%
Actual: +0.2%

Change from 12 months previous: +1.6%

=============

The above, yellow-highlighted percentages represent the month-to-month change in prices received by domestic producers of goods and services, for goods, services and construction in the United States, for final demand.

Final Demand = personal consumption (consumers), exports, government purchases and capital investment.

The PPI-FD is released by the Labor Department's Bureau of Labor Statistics.

The "predicted" figure is what economists were expecting, while the "actual" is the true or real figure.

Click here to view the full Labor Department report.

Labels: , , ,


--> www.FedPrimeRate.com Privacy Policy <--

>  SITEMAP  <

U.S. Retail & Food Services Sales Report for December 2016

The Commerce Department this morning released advanced estimates of U.S. Retail and Food Services Sales for December 2016:

Predicted: +0.7%
Actual: +0.6%

The yellow-highlighted percentage represents the month-to-month change in total sales receipts for retailers that sell durable and non-durable goods,and retailers that provide food and beverage services.

=================

Previous Month (revised): +0.2%

Estimated Retail Sales During December: $469,100,000,000

Change from 12 Months Previous: +4.1%

=================

The "predicted" figure is what economists were expecting, while the "actual" is the true or real figure.


Labels: ,


--> www.FedPrimeRate.com Privacy Policy <--

>  SITEMAP  <

Thursday, January 12, 2017

Import and Export Price Indexes for December 2016

The Labor Department's Bureau of Labor Statistics this morning released its report on U.S. Import and Export Price Indexes for December 2016:

Import Prices
Predicted: +0.7%
Actual: +0.4%

Change From 12 Months Previous: +1.8%

===============

Export Prices
Predicted: +0.2%
Actual: +0.3%

Change From 12 Months Previous: +1.1%

===============
 
The above percentages, highlighted in yellow, represent the month-to-month change in prices for:

  • Imports: the cost of goods produced in other countries and sold in the United States.
  • Exports: the cost of goods produced in the USA and sold in other countries.

Together, these indexes offer insight into the status of inflation in the United States, and for the global economy as well. The "predicted" figure is what economists were expecting, while the "actual" is the true or real figure.

Click here to view the full Labor Department report.


Labels: , , ,


--> www.FedPrimeRate.com Privacy Policy <--

>  SITEMAP  <

New Unemployment Insurance Claims for The Week of January 7, 2017

Earlier today, the Labor Department released its weekly report on New Jobless Insurance Claims for the week that ended on January 7, 2017:

Predicted: 255,000
Actual: 247,000

The yellow-highlighted figure represents the number of first-time claims for unemployment benefits for the entire United States. The "predicted" figure is what economists were expecting, while the "actual" is the true or real figure.

  • Last Week (revised): 237,000
  • 4-Week Moving Average: 256,500

From today's report:

"...There were no special factors impacting this week's initial claims. This marks 97 consecutive weeks of initial claims below 300,000, the longest streak since 1970..."

Labels: , ,


--> www.FedPrimeRate.com Privacy Policy <--

>  SITEMAP  <

Wednesday, January 11, 2017

Crude Oil Inventories Report for Week of January 6, 2017

The U.S. Crude Oil Inventories report for the week that ended on January 6, 2017 was released this morning:

Weekly Change: +4,100,000 Barrels

Yearly Change: +31,900,000 Barrels

Current U.S. Crude Oil Stocks: 483,100,000 Barrels

Diminishing crude oil inventories often translate to higher crude oil prices (and vice versa), but not always.

The report is produced by the U.S. Energy Information Administration (EIA).

Labels: , ,


--> www.FedPrimeRate.com Privacy Policy <--

>  SITEMAP  <

Tuesday, January 10, 2017

NFIB Small Business Optimism Index for December 2016

The National Federation of Independent Business® (NFIB®) released its Small Business Optimism Index for December 2016:

=========

Predicted: 99.6
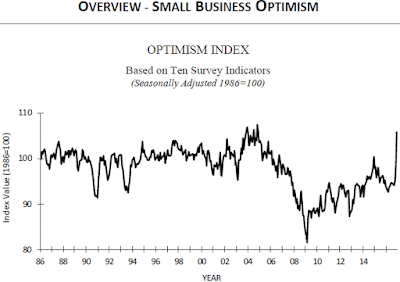
Actual: 105.8

  • Change from Previous Month: +7.52%
  • Change from 12 Months Previous: +11.13%

=========

Small Business Optimism Index - December 2016

=========

From today's report:

"...The Index of Small Business Optimism rose 7.4 points to 105.8, the highest reading since December 2004. Seven of the 10 Index components posted a gain, 2 declined and 1 was unchanged. Expectations for real sales gains and outlook for business conditions accounted for 73 percent of the gain. The percent of owners viewing the current period as a good time to expand is now triple the average level in the recovery. GDP related hiring and inventor investment showed little gain. Capital spending though, the laggard in this recovery, posted a strong advance, both in reported outlays and plans for spending in the first half. Job creation plans remained at the highest levels seen since 2007. Reports of compensation gains were robust while reports of higher prices, though the highest all year, were infrequent..."
=========

  • Small business survey questions can be found at the end of today's report.
  • The baseline "100" score is associated with 1986 survey data.
=========

Last month's Small Business Optimism Index was 98.4.

=========


Labels: , , ,


--> www.FedPrimeRate.com Privacy Policy <--

>  SITEMAP  <

Friday, January 06, 2017

U.S. Factory Orders During November 2016

The U.S. Census Bureau this morning released their report on Manufacturers' Shipments, Inventories and Orders -- also known as Factory Orders -- for November 2016:

Predicted: -2.5%
Actual: -2.4%

The highlighted percentage is the month-to-month change in orders for both durable and nondurable goods made by from U.S. manufacturers. The "predicted" figure is what economists were expecting, while the "actual" is the true or real figure.

Previous Month (revised): +2.8.

Click here to view the full Census Bureau report.

Labels: ,


--> www.FedPrimeRate.com Privacy Policy <--

>  SITEMAP  <

Employment Situation Report for December 2016

The Employment Situation Report for December 2016 was released by The Department of Labor's Bureau of Labor Statistics this morning:

Nonfarm Payrolls (month-to-month change)
Predicted: +175,000
Actual: +156,000


U-3 Unemployment Rate (Headline)
Predicted: 4.7%
Actual: 4.7%

U-6 Unemployment Rate*
Actual: 9.2%
Previous Reading: 9.3%

Average Hourly Earnings (month-to-month change)
Predicted: +0.3%
Actual: +0.386%

Civilian Labor Force Participation Rate: 62.7%
Previous Reading (revised): 62.6%

Average Workweek
Predicted: 34.4 hours
Actual: 34.3 hours

Economist, academics, central bankers and investors pay very close attention to the monthly Employment Situation report as it offers penetrating insight as to the current and near-future state of the overall U.S. economy. If a) Americans are earning more money and b) the economy is creating new jobs, this typically translates to more money being pumped into the economy (and vice versa.)

The "predicted" figure is what economists were expecting, while the "actual" is the true or real figure.

From today's report:

"...In December, average hourly earnings for all employees on private nonfarm payrolls increased by 10 cents to $26.00 [+0.386%], after edging down by 2 cents in November. Over the year, average hourly earnings have risen by 2.9%. In December, average hourly earnings of private-sector production and nonsupervisory employees increased by 7 cents to $21.80 [+0.322%]...

...
The change in total nonfarm payroll employment for October was revised down from +142,000 to +135,000, and the change for November was revised up from +178,000 to +204,000. With these revisions, employment gains in October and November were 19,000 higher than previously reported. Over the past 3 months, job gains have averaged 165,000 per month..." [Establishment Survey Data]

====

* =  The U-6 Unemployment Rate is defined as:

"Total unemployed, plus all persons marginally attached to the labor force, plus total employed part time for economic reasons, as a percent of the civilian labor force plus all persons marginally attached to the labor force."

Labels: , , , ,


--> www.FedPrimeRate.com Privacy Policy <--

>  SITEMAP  <

Thursday, January 05, 2017

Crude Oil Inventories Report for Week of December 30, 2016

The U.S. Crude Oil Inventories report for the week that ended on December 30, 2016 was released this morning:

Weekly Change: -7,100,000 Barrels

Yearly Change: +28,100,000 Barrels

Current U.S. Crude Oil Stocks: 479,000,000 Barrels

Diminishing crude oil inventories often translate to higher crude oil prices (and vice versa), but not always.

The report is produced by the U.S. Energy Information Administration (EIA).

Labels: , ,


--> www.FedPrimeRate.com Privacy Policy <--

>  SITEMAP  <

ISM Non-Manufacturing Index (NMI®) for December 2016

Earlier today, the Institute for Supply Management (ISM®) released their Non-Manufacturing Index (NMI®) for December 2016:

Predicted: 56.8%
Actual: 57.2%

==========

The NMI® is a reliable barometer of the U.S. services sector; above 50% implies expansion, while a reading below 50% implies that the services sector contracted.

Service categories include: Agriculture, Forestry, Fishing + Hunting; Mining; Utilities; Construction; Wholesale Trade; Retail Trade; Transportation + Warehousing; Information; Finance + Insurance; Real Estate, Rental + Leasing; Professional, Scientific + Technical Services; Management of Companies + Support Services; Educational Services; Health Care + Social Assistance; Arts, Entertainment + Recreation; Accommodation + Food Services; Public Administration; and Other Services (services such as Equipment + Machinery Repairing; Promoting or Administering Religious Activities; Grantmaking; Advocacy; and Providing Dry-Cleaning + Laundry Services, Personal Care Services, Death Care Services, Pet Care Services, Photofinishing Services, Temporary Parking Services, and Dating Services).

The previous month's non-manufacturing NMI reading was 57.2%.

Here's a sampling of comments from survey participants:

  •     "New business slowed a little bit, but we are still growing. The key headwinds are holiday season and capex [capital expenditures] tightening due to end of year budgets."
     (Construction)

  •     "Steady with optimism."
     (Finance and Insurance)

  •     "Business is the same and at the same volumes as last month."
     (Health Care and Social Assistance)

  •     "Very busy end to the 4th Qtr due to customers' year-end spending boost."
     (Mining)

  •     "Activity seems to be increasing as more potential client inquiries have been coming in."
     (Professional, Scientific and Technical Services)

  •     "Labor, especially construction labor and construction subcontractors, continue to be in short supply."
     (Public Administration)

  •     "Sales increasing due to [the] holidays."
     (Retail Trade)

  •     "Distribution of finished goods ahead of last year and forecasts in all channels. E-commerce [has the] strongest growth."
     (Transportation and Warehousing)
Click here to view the complete ISM report

Labels: , , ,


--> www.FedPrimeRate.com Privacy Policy <--

>  SITEMAP  <

New Unemployment Insurance Claims for The Week of December 31, 2016

Earlier today, the Labor Department released its weekly report on New Jobless Insurance Claims for the week that ended on December 31, 2016:

Predicted: 260,000
Actual: 235,000

The yellow-highlighted figure represents the number of first-time claims for unemployment benefits for the entire United States. The "predicted" figure is what economists were expecting, while the "actual" is the true or real figure.

  • Last Week (revised): 263,000
  • 4-Week Moving Average: 256,750

From today's report:

"...There were no special factors impacting this week's initial claims. This marks 96 consecutive weeks of initial claims below 300,000, the longest streak since 1970..."

Labels: , ,


--> www.FedPrimeRate.com Privacy Policy <--

>  SITEMAP  <

Tuesday, January 03, 2017

ISM Manufacturing Index for December 2016

Earlier today, the Institute for Supply Management (ISM) released their Manufacturing Purchasing Manager's Index (PMI) for December 2016:

Predicted: 53.8%
Actual: 54.7%

Every month, the ISM surveys purchasing and supply executives at hundreds of companies across the country who are involved in manufacturing in some form. The resulting index is watched closely by academics, economists and investors because manufacturing accounts for about 12% of U.S. Gross Domestic Product (GDP).

The PMI is a reliable barometer of U.S. manufacturing: A PMI above 50% implies that U.S. manufacturing expanded during the month specified, while a reading below 50% implies that the made-in-the-USA sector contracted.

The previous month's PMI reading was 53.2%.

The following is a sampling of quotes from a diverse pool of U.S. manufacturers:


  •     “Ramping up for year-end by reducing inventory.”
     (Chemical Products)

  •     “Very strong month in terms of booking and billing which will contribute to a good overall year revenue-wise.”
     (Computer and Electronic Products)

  •     “Our business remains strong and we are seeing continued growth.”
     (Plastics
    and Rubber Products)

  •     “We have been fairly steady the last few months and it appears business is strong into the 1st quarter of next year.”
     (Primary Metals)

  •     “Moving into [a] more inflationary environment, with lots of pressure to increase prices on a number of fronts.”
     (Food, Beverage
    and Tobacco Products)

  •     “Business continues to be brisk with an uptick of RFQs. Customers are earmarking funds for capital equipment upgrades.”
     (Machinery)

  •     “Hiring still tight on available local labor. Business, by segments, still uneven. Some consumer markets very (seasonally) strong, but industrial markets lagging.”
     (Transportation Equipment)

  •     “Business conditions are good, demand is growing.”
     (Miscellaneous Manufacturing)

  •     “Continued strong demand for product and strong forecast for next year.”
     (Nonmetallic Mineral Products)

  •     “December 2016 is way ahead of December 2015.”
     (Fabricated Metal Products)
Click here to view the complete ISM report

    Labels: , , ,


    --> www.FedPrimeRate.com Privacy Policy <--

    >  SITEMAP  <

    Construction Spending During November 2016

    Earlier today, the U.S. Census Bureau -- which is part of the Commerce Department -- released its Construction Spending report for November 2016:

    Predicted: +0.6%
    Actual: +0.9%

    The yellow-highlighted percentage represents the month-to-month change in new public and private construction activity for the United States. The "predicted" figure is what economists were expecting, while the "actual" is the true or real figure.

    Previous Month (revised): +0.6%

    Change from 12 months previous: +4.1%

    Click here to view the full Census Bureau report

    Labels:


    --> www.FedPrimeRate.com Privacy Policy <--

    >  SITEMAP  <

    bing

    bing


    SCAMS!

    FedPrimeRate.com
    Entire Website © 1999 - 2025 FedPrimeRate.comSM


    This website is neither affiliated nor associated with The United States Federal Reserve
    in any way. Information in this website is provided for educational purposes only. The owners
    of this website make no warranties with respect to any and all content contained within this
    website. Consult a financial professional before making important decisions related to any
    investment or loan product, including, but not limited to, business loans, personal loans,
    education loans, first or second mortgages, credit cards, car loans or any type of insurance.