.comment-link {margin-left:.6em;}

Economy

Economic Data (USA)

Wednesday, June 30, 2021

Consumer Confidence Index (CCI) for June 2021

The Consumer Confidence Index® (CCI) for this month (June 2021) was released by The Conference Board® this morning:

================

Predicted: 120.0
  • Actual: 127.3

================

Previous Month (revised): 120.0

  • Change from Previous Month: +6.083% (+7.3 points)
================

The "predicted" figure is what economists were expecting, while the "actual" is the true or real figure.

From Today's Report:

"...'Consumer confidence increased in June and is currently at its highest level since the onset of the pandemic’s first surge in March 2020,' said Lynn Franco, Senior Director of Economic Indicators at The Conference Board. 'Consumers’ assessment of current conditions improved again, suggesting economic growth has strengthened further in Q2. Consumers’ short-term optimism rebounded, buoyed by expectations that business conditions and their own financial prospects will continue improving in the months ahead. While short-term inflation expectations increased, this had little impact on consumers’ confidence or purchasing intentions. In fact, the proportion of consumers planning to purchase homes, automobiles, and major appliances all rose -- a sign that consumer spending will continue to support economic growth in the short-term. Vacation intentions also rose, reflecting a continued increase in spending on services.'..."

Every month, The Conference Board sends a questionnaire to 5,000 U.S. households. Survey participants are polled about their feelings regarding the U.S. economy, current and future, and about their own fiscal circumstances. On average, 3,500 participants complete and return the 5-question survey.

  • The baseline "100" score for the CCI is associated with 1985 survey data.

When consumers feel good about the economy, they tend to do more spending, and vice versa.

Based in New York City, The Conference Board is a private, not-for-profit organization with a mission to, "create and disseminate knowledge about management and the marketplace to help businesses strengthen their performance and better serve society."

The CCI is usually released on the last Tuesday of the month.

================

================

Labels: , , , , , , , , ,


--> www.FedPrimeRate.com Privacy Policy <--

>  SITEMAP  <

Friday, June 25, 2021

PCE Price Index + Personal Income + Consumer Spending Report for May 2021

The Commerce Department's Bureau of Economic Analysis (BEA) released its report on The PCE Price Index, Consumer Spending and Personal Income for May 2021:

=============

Consumer Spending (Personal Consumption Expenditures)

Predicted: +0.5%

  • Actual: Unchanged
  • Actual (2012 Chained* Dollars): -0.4%
=============

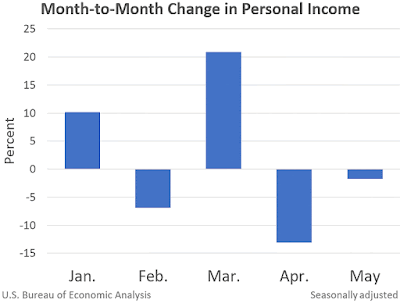
Personal Income

Predicted: -3.0%
  • Actual: -2.0%
=============

  • Disposable Personal Income, Current Dollars: -2.3%
  • Disposable Personal Income (2012 Chained* Dollars): -2.8%

=============

The above highlighted percentages represent the month-to-month change in Consumer Spending (aka Personal Consumption Expenditures), Personal Income and Disposable Personal Income for the entire United States.

=============

===================== 
 

CHART: Month-to-Month Change in Personal Income - May 2021 Update

CHART: Month-to-Month Change in Personal Income
May 2021 Update
 
=====================

=====================

Personal Consumption Expenditures (PCE) Price Index
Predicted: +0.5%
Actual: 0.4% 

  • Change from 12 months previous: +3.9%
=====================

Core PCE Price Index
( = PCE Price Index minus food and energy)
Predicted: +0.5%
Actual: 0.5%

  • Change from 12 months previous: +3.4%
=====================

The yellow-highlighted percentages represent the month-to-month change in the prices associated with domestic personal consumption.  The PCE Price Index is different from the Consumer Price Index (CPI) in that it is a very broad measure of the prices associated with domestic products and services, while the CPI measures a more limited fixed basket of goods and services.

The broad nature of the PCE Price Index is key to why it is the Federal Reserve's preferred measure of inflation.  The Federal Open Market Committee (FOMC) pays very close attention to it.

=====================

The "predicted" figures are what economists were expecting, while the "actual" figures are the true or real figure.


=====================

 =====================

*Chained dollars is a method of adjusting real dollar amounts for inflation over time, so as to allow comparison of figures from different years. The Commerce Department introduced the chained-dollar measure in 1996. Chained dollars generally reflect dollar figures computed with 2012 as the base year.


Labels: , , , , , , , , , , , , ,


--> www.FedPrimeRate.com Privacy Policy <--

>  SITEMAP  <

Durable Goods Orders During May 2021

The Durable Goods Orders report for May 2021 was released by the Commerce Department this morning:

================

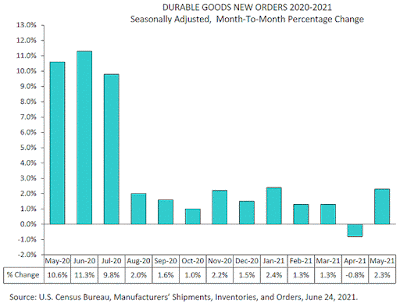
Predicted: +2.5%

  • Actual: $253,323,000,000 (+$5,748,000,000 [+2.322%])

================

CHART: Durable Goods Orders - May 2021 Update

CHART: Durable Goods Orders - May 2021 Update

================

The yellow-highlighted figures represent the dollar amount of new orders for durable or hard goods for immediate or future delivery from U.S. manufacturers, along with both the dollar and month-to-month percentage change.

Examples of durable goods: cars, airplanes, computers, furniture -- items that are built to last at least three years.

================


 ================


Labels: , , , , , ,


--> www.FedPrimeRate.com Privacy Policy <--

>  SITEMAP  <

Thursday, June 24, 2021

Consumer Price Index (CPI) for May 2021

Earlier this morning, the Labor Department's Bureau of Labor Statistics released the Consumer Price Index (CPI) for May 2021:

=========================================

CPI During May 2021: 269.195

=========================================


Predicted: +0.6%
Actual: +0.8017 (+2.141 points)

  • Change From 12 Months Previous: +5.0%

=========================================

Below is the CPI when food and energy are removed, also known as core CPI:

Predicted: 0.5%
Actual: 0.7%

  • Change From 12 Months Previous: +3.8%

=========================================

The above, yellow-highlighted figures represent the seasonally adjusted, month-to-month change in prices for a specific group of goods and services that consumers buy, and is, therefore, a very important part of the overall inflation picture for the country.

The "predicted" figure is what economists were expecting, while the "actual" is the true or real figure.

General categories that constitute the CPI are:

  • Healthcare
  • Housing
  • Clothing
  • Communications
  • Education
  • Transportation
  • Food and Beverages
  • Recreation
  • Miscellaneous Goods and Services (grooming expenses, etc.)


=========================================

CHART: Consumer Price Index (CPI) - May 2021 Update

CHART: Consumer Price Index (CPI)
May 2021 Update

=========================================

CPI During April 2021: 267.054

=========================================


=========================================

Labels: , , , , , , , , ,


--> www.FedPrimeRate.com Privacy Policy <--

>  SITEMAP  <

Wednesday, June 09, 2021

Crude Oil Inventories Report for Week of June 4, 2021

Crude Oil Inventories

The U.S. Crude Oil Inventories report for the week that ended on June 4, 2021 was released this morning:

-- Change from Last Week: -5,200,000 Barrels

-- Change from A Year Ago (Y/Y): -64,000,000 Barrels

-- Current U.S. Crude Oil Stocks: 474,000,000 Barrels

Diminishing crude oil inventories often translate to higher crude oil prices (and vice versa), but not always.

The report is produced by the U.S. Energy Information Administration (EIA).


Labels: , , , , , , , , ,


--> www.FedPrimeRate.com Privacy Policy <--

>  SITEMAP  <

NFIB Small Business Optimism Index for May 2021

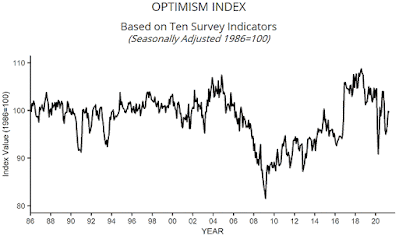
The National Federation of Independent Business® (NFIB®) released its Small Business Optimism Index for May 2021:

=========

Predicted: 100.0
Actual: 99.6

  • Change from Previous Month: -0.2004% (-0.2 point.)
  • Change from 12 Months Previous: +5.508% (+5.2 points.)

=========
=========

From today's report:

"...'Small business owners are struggling at record levels trying to get workers back in open positions,' said NFIB Chief Economist  Bill Dunkelberg. 'Owners are offering higher wages to try to remedy the labor shortage problem. Ultimately, higher labor costs are being passed on to customers in higher selling prices.'..."

 "...Sixty-one percent of owners reporting hiring or trying to hire in May. Owners have plans to fill open positions with a seasonally adjusted net 27% planning to create new jobs in the next three months.

A net 34% of owners (seasonally adjusted) reported raising compensation, the highest level in the past 12 months. A net 22% of owners plan to raise compensation in the next three months, up two points from April.

Small business owners continue to report finding qualified employees remains a problem with 93% of owners hiring or trying to hire reported few or no 'qualified' applications for the positions they were trying to fill in May. Thirty-two percent of owners reported few qualified applicants for their positions and 25% reported none.

Eight percent of owners cited labor costs as their top business problem and 26% said that labor quality was their top business problem, the top business concern.

Forty percent of small business owners have job openings for skilled workers and 27% have openings for unskilled labor. In the construction industry, 51% of job openings are for skilled workers. Sixty-six percent of construction businesses reported few or no qualified applicants..."


 =========

  • Small business survey questions can be found at the end of today's report.
  • The baseline "100" score is associated with 1986 survey data.
=========

The previous month's Small Business Optimism Index was 99.8.

=========

 
=========


Labels: , , , , , , , , , , ,


--> www.FedPrimeRate.com Privacy Policy <--

>  SITEMAP  <

Tuesday, June 08, 2021

Job Openings and Labor Turnover Survey (JOLTS) for April 2021

The Job Openings and Labor Turnover Survey (JOLTS*) for April 2021 was released by the Labor Department this morning:

============

Job Openings

Predicted: 8,000,000
Actual:    9,286,000 (All-Time Record High)

  • Previous Month (revised): 8,288,000

  • One Year Previous: 4,630,000

=============

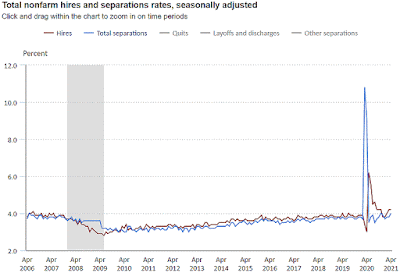
Hires: 6,075,000 

Total Separations §: 5,760,000 

=============

The above, yellow-highlighted percentage represents the estimated number of job openings in the United States during the indicated month. The "predicted" figure is what economists were expecting, while the "actual" is the true or real figure.

=============

From Today's Release:

"...Coronavirus (COVID-19) Pandemic Impact on April 2021 Job Openings and Labor Turnover Survey Data

Data collection for the JOLTS survey was affected by the coronavirus (COVID-19) pandemic. While 42 percent of data are usually collected by phone at the JOLTS data collection center, most phone respondents were asked to report electronically. However, data collection was adversely impacted due to the inability to reach some respondents that normally respond by phone. The JOLTS response rate for April was 44 percent, while response rates prior to the pandemic averaged 54 percent. More information about the impact of the COVID-19 pandemic on the JOLTS survey, including information about the JOLTS estimation methodology, is available at www.bls.gov/covid19/job-openings-and-labor-turnover-covid19-april-2021.htm...
"

=============

CHART: Total Nonfarm Hires and Separation Rates April 2021 Update

CHART: Total Nonfarm Hires and Separation Rates
April 2021 Update
 
=============

§ = Here's How The Labor Department Defines Total Separations:

"Total separations includes quits, layoffs and discharges, and other separations. Total separations is referred to as turnover. Quits are generally voluntary separations initiated by the employee. Therefore, the quits rate can serve as a measure of workers’ willingness or ability to leave jobs. Layoffs and discharges are involuntary separations initiated by the employer. Other separations includes separations due to retirement, death, disability, and transfers to other locations of the same firm."

=============

=============


Labels: , , , , , , , , , , ,


--> www.FedPrimeRate.com Privacy Policy <--

>  SITEMAP  <

Friday, June 04, 2021

U.S. Factory Orders During April 2021

The U.S. Census Bureau this morning released their report on Manufacturers' Shipments, Inventories and Orders -- also known as Factory Orders -- for April 2021:

Predicted: Unchanged
Actual: -0.598% (-$2,917,000,000)

  • April 2021 New Orders: $485,156,000,000.

  • March 2021 New Orders: $488,073,000,000.

========

The yellow-highlighted percentage is the month-to-month change in orders for both durable and nondurable goods made by U.S. manufacturers. The "predicted" figure is what economists were expecting, while the "actual" is the true or real figure.

=============


CHART: U.S. Factory Orders - April 2021 Update

=============


=============


Labels: , , ,


--> www.FedPrimeRate.com Privacy Policy <--

>  SITEMAP  <

Employment Situation Report for May 2021

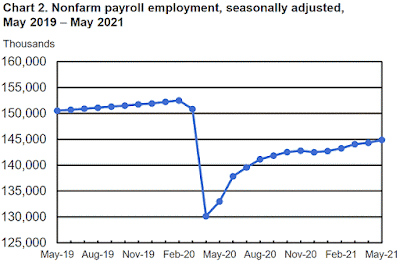
The Employment Situation Report for May 2021 was released by The Department of Labor's Bureau of Labor Statistics this morning:

Nonfarm Payrolls (month-to-month change)
Predicted: +500,000
Actual: +559,000


U-3 Unemployment Rate (Headline)
Actual: 5.8%
Previous Month: 6.1%
12 Months Previous: 13.3%

U-6 Unemployment Rate*
Actual: 10.2%
Previous Month: 10.4%
12 Months Previous: 21.2%

Average Hourly Earnings (month-to-month change)
Predicted: +0.3%
Actual: +0.55% (+$0.14)

Average Hourly Earnings (year-on-year change)
Predicted: +2.0%
Actual: +2.359% (+$0.59)

Average Weekly Earnings (month-to-month change)
Actual: +0.258% (+$2.26)


Average Weekly Earnings (year-on-year change)
Actual: +2.96% (+$25.24)

Civilian Labor Force Participation Rate: 61.6%
Previous Month: 61.7%
12 Months Previous: 60.8%

Average Workweek
Predicted: 34.9 hours
Actual: 34.9 hours

Economist, academics, central bankers and investors pay very close attention to the monthly Employment Situation report as it offers penetrating insight as to the current and near-future state of the overall U.S. economy. If a) Americans are earning more money and b) the economy is creating new jobs, this typically translates to more money being pumped into the economy (and vice versa.)

The "predicted" figure is what economists were expecting, while the "actual" is the true or real figure.

===================

From Today's Report:

 "...The change in total nonfarm payroll employment for March was revised up by 15,000, from +770,000 to +785,000, and the change for April was revised up by 12,000, from +266,000 to +278,000. With these revisions, employment in March and April combined is 27,000 higher than previously reported. (Monthly revisions result from additional reports received from businesses and government agencies since the last published estimates and from the recalculation of seasonal factors.)..."

 "...In May, 16.6 percent of employed persons teleworked because of the coronavirus pandemic, down from 18.3 percent in the prior month. These data refer to employed persons who teleworked or worked at home for pay at some point in the last 4 weeks specifically because of the pandemic.

In May, 7.9 million persons reported that they had been unable to work because their employer closed or lost business due to the pandemic -- that is, they did not work at all or worked fewer hours at some point in the last 4 weeks due to the pandemic. This measure is down from 9.4 million in the previous month.

Among those who reported in May that they were unable to work because of pandemic-related closures or lost business, 9.3 percent received at least some pay from their employer for the hours not worked, unchanged from the previous month.

Among those not in the labor force in May, 2.5 million persons were prevented from looking for work due to the pandemic. This measure is down from 2.8 million the month before. (To be counted as unemployed, by definition, individuals must be either actively looking for work or on temporary layoff.)..."

===================

CHART: Nonfarm Payroll Employment May 2021 Update

CHART: Nonfarm Payroll Employment
May 2021 Update

===================


CHART: U-3 (Headline) Unemployment Rate May 2021 Update

CHART: U-3 (Headline) Unemployment Rate
May 2021 Update

 ===================

 * =  The U-6 Unemployment Rate is defined as:

"Total unemployed, plus all persons marginally attached to the labor force, plus total employed part time for economic reasons, as a percent of the civilian labor force plus all persons marginally attached to the labor force."


===================


 ===================


Labels: , , , , , , , , , ,


--> www.FedPrimeRate.com Privacy Policy <--

>  SITEMAP  <

Thursday, June 03, 2021

ISM Non-Manufacturing Index (NMI®) for May 2021

Earlier today, the Institute for Supply Management (ISM®) released their Non-Manufacturing Index (NMI®) for May 2021:

==========

Predicted: 62.0%
  • Actual: 64.0%  (All-Time Record High)

==========

Previous month: 62.7%

==========

The NMI is a reliable barometer of the U.S. services sector; above 50% implies expansion, while a reading below 50% implies that the services sector contracted.

Service Categories Include: Agriculture, Forestry, Fishing + Hunting; Mining; Utilities; Construction; Wholesale Trade; Retail Trade; Transportation + Warehousing; Information; Finance + Insurance; Real Estate, Rental + Leasing; Professional, Scientific + Technical Services; Management of Companies + Support Services; Educational Services; Health Care + Social Assistance; Arts, Entertainment + Recreation; Accommodation + Food Services; Public Administration; and Other Services (services such as Equipment + Machinery Repairing; Promoting or Administering Religious Activities; Grant-making; Advocacy; and Providing Dry-Cleaning + Laundry Services, Personal Care Services, Death Care Services, Pet Care Services, Photofinishing Services, Temporary Parking Services, and Dating Services).

==========

From today' report:

"...Economic activity in the services sector grew in May for the 12th month in a row, say the nation’s purchasing and supply executives in the latest Services ISM® Report On Business®..."

============

Here's a sampling of comments made by survey participants:

  • "Stimulus money, increased vaccinations, increased dining capacity and pent-up demand are driving a fast recovery for dine-in restaurants -- and all consumer segments, it seems -- resulting in labor shortages and supply chain gaps."
     [Accommodation + Food Services]


  • "Container delays are impacting our supply chain in a significant way. Delays at the Port of Montreal and West Coast ports have impacted our ability to provide products in growing season. Truck availability has generally been tighter than normal. We’ve seen a real impact in the southeastern market."
     [Agriculture, Forestry, Fishing + Hunting]

  • "Business continues to improve, and we have worked through many of the supply chain disruptions at this time. We have begun to return to work at our corporate office on a limited basis."
     [Arts, Entertainment + Recreation]


  • "We are still busy and adding employees. One of the biggest concerns now is shortages of crucial material and equipment. Metal coils for production are especially scarce. Equipment and material suppliers have been raising prices since the first of the year. We hear of a new increase almost daily."
     [Construction]


  • "We anticipated the reopening reasonably well but were caught off guard with respect to some materials. Steel and copper went higher than anticipated, and shortages are having an impact."
     [Finance + Insurance]


  • "As the vaccination rate continues to climb and the coronavirus (COVID-19) infection rate continues to plummet, business conditions are steadily improving: Strong revenue performance is returning, and outlooks are improving. Some supply categories remain constrained (nitrile gloves, sterile wrap and the like), yet are somewhat manageable, limiting the impact to daily operations."
     [Health Care + Social Assistance]


  • "(We are) seeing cost increases and long lead times with steel and steel containers. Worker shortages, temp labor and the like."
     [Management of Companies + Support Services]


  • "Transportation, labor, steel and general commodities are all increasing (in price) based upon general inflation and the rising price of oil."
     [Mining]


  • "Small businesses in the area are reporting stimulus checks and extension of unemployment are hampering their ability to hire workers. Seasonal labor and H-2B (visa) workers are in very short supply, causing an uptick in cost per hour. Some employers are reporting they are offering cash incentives of (US)$50 if you show up for an interview."
     [Professional, Scientific + Technical Services]


  • "Business is very strong, and customer orders continue to increase at a rapid pace. Material shortages, increased prices and qualified personnel shortages are becoming a much larger concern."
     [Real Estate, Rental + Leasing]


  • "Very concerned about the rapid and continuing price escalations for any products with copper, steel, and polyvinyl chloride (PVC). Production issues and lead-time extensions are not improving."
     [Retail Trade]


  • "Business is doing good, exceeding sales target, but we have challenging issues with (1) increases in raw-materials costs and freight rates, (2) huge freight delays from overseas and (3) continued U.S. port delays. The (COVID-19 surges) in India and Taiwan are also causing delays on product availability/shipments."
     [Wholesale Trade]

     
  ============


==========


ISM Non-Manufacturing (Services) Index (NMI®) 12 Month History - May 2021 Update

ISM Non-Manufacturing (Services) Index (NMI®)
12 Month History - May 2021 Update


==========


Labels: , , , , , , , ,


--> www.FedPrimeRate.com Privacy Policy <--

>  SITEMAP  <

Wednesday, June 02, 2021

Construction Spending During April 2021

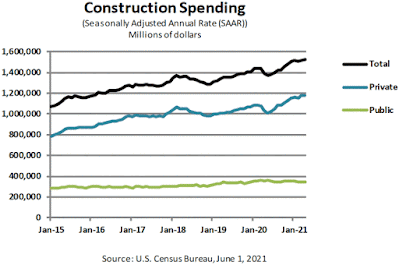
Earlier today, the U.S. Census Bureau -- which is part of the Commerce Department -- released its Construction Spending report for April 2021:

Predicted: +0.5%
Actual: +0.2083% (+$3,169,000,000)

The yellow-highlighted percentage represents the month-to-month change in new public and private construction activity for the United States. The "predicted" figure is what economists were expecting, while the "actual" is the true or real figure.

  • Estimated construction spending during April 2021: $1,524,183,000,000.

  • March 2021 (revised): $1,521,014,000,000.
     
  • Change from 12 months previous: +9.8165% (+$1,36,247,000,000.)


================


CHART: Construction Spending During April 2021


================


 ================


Labels: , , , , , , , ,


--> www.FedPrimeRate.com Privacy Policy <--

>  SITEMAP  <

bing

bing


SCAMS!

FedPrimeRate.com
Entire Website © 1999 - 2025 FedPrimeRate.comSM


This website is neither affiliated nor associated with The United States Federal Reserve
in any way. Information in this website is provided for educational purposes only. The owners
of this website make no warranties with respect to any and all content contained within this
website. Consult a financial professional before making important decisions related to any
investment or loan product, including, but not limited to, business loans, personal loans,
education loans, first or second mortgages, credit cards, car loans or any type of insurance.