.comment-link {margin-left:.6em;}

Economy

Economic Data (USA)

Wednesday, September 03, 2025

ISM Manufacturing Index for August 2025

Earlier today, the Institute for Supply Management® (ISM®) released their Manufacturing Purchasing Manager's Index (PMI®) for August, 2025:

=========

Predicted: 49.0%

  • Actual: 48.7% (+0.7 point month-on-month change)

=========

Previous month: 48.0%

=========

Every month, the ISM surveys purchasing and supply executives at hundreds of companies across the country who are involved in manufacturing in some form. The resulting index is watched closely by academics, economists and investors because manufacturing accounts for about 12% of U.S. Gross Domestic Product (GDP).

The PMI is a reliable barometer of U.S. manufacturing: A PMI above 50% implies that U.S. manufacturing expanded during the month specified, while a reading below 50% implies that the made-in-the-USA sector contracted.

=========

From Today's Report:

"...Economic activity in the manufacturing sector contracted in August for the sixth consecutive month, following a two-month expansion preceded by 26 straight months of contraction, say the nation's supply executives in the latest ISM® Manufacturing PMI® Report..."

=========

The Following Is A Sampling Of Quotes
From A Diverse Pool Of U.S. Manufacturers:


  •     ' A 50-percent tariff on imports from Brazil, combined with the U.S. Department of Agriculture’s elimination of the specialty sugar quota, means certified organic cane sugar -- and everything made with it -- is about to get significantly more expensive.'
      (Food, Beverage + Tobacco Products)


  •     ' Orders across most product lines have decreased. Financial expectations for the rest of 2025 have been reduced. Too much uncertainty for us and our customers regarding tariffs and the U.S./global economy.'
      (Chemical Products)


  •     'Tariffs continue to be unstable, with suppliers adding surcharges ranging between 2.6% to 50%.'
      (Petroleum + Coal Products)


  •     'Tariffs continue to wreak havoc on planning/scheduling activities. New product development costs continue to increase as unexpected tariff increases are announced -- for example, 50% duties on imports from India, and increases to all countries up from original 10%. Our materials/supplies are now rising in price, so our sell pricing is again being reviewed to ensure we keep a sustainable margin.

    Plans to bring production back into U.S. are impacted by higher material costs, making it more difficult to justify the return.'
      (Computer & Electronic Products)


  •     ' The construction industry, especially home building, is still at a lower level. With new construction at a low level, our new sales are impacted. We are mainly now relying on replacement business. Cost of goods sold is higher due to tariff-impacted goods.'
      (Machinery)


  •     "Domestic sales remain flat but are down four percent from plan by unit volume [tariff pricing].

    Export demand is falling as customers do not accept tariff impacts, which likely will require some production transfers out of the U.S. Supplier deliveries remain consistent with ocean shipping costs dropping significantly.

    Tariff costs have biggest financial impact but also costs of copper and of steel products.'
     (Fabricated Metal Products)


  •     ' The trucking industry continues to contract. Our backlog continues to shrink as customers continue to hold off on buying new equipment. This current environment is much worse than the Great Recession of 2008-09. There is absolutely no activity in the transportation equipment industry.

    This is 100% attributable to current tariff policy and the uncertainty it has created. We are also in stagflation: Prices are up due to material tariffs, but volume is way off.'
      (Transportation Equipment)


  •     ' We’ve implemented our second price increase. "Made in the USA" has become even more difficult due to tariffs on many components. Total price increases so far: 24%; that will only offset tariffs.

    No influence on margin percentage, which will actually drop. In two rounds of layoffs, we have let go of about 15 percent of our U.S. workforce. These are high-paying and high-skilled roles: engineers, marketing, design teams, finance, IT and operations.

    The administration wants manufacturing jobs in the U.S., but we are losing higher-skilled and higher-paying roles. With no stability in trade and economics, capital expenditures spending and hiring are frozen. It’s survival.'
      (Electrical Equipment, Appliances + Components)


  •     ' There is still uncertainty in the construction market. Large expansions or investment are hampered by the unknown of costing and the economy. The markets we operate in can be strong short term, but there is an underlying feeling that has you questioning for how long.'
      (Nonmetallic Mineral Products)

==========

CHART: ISM Manufacturing Index - August 2025 Update

CHART: ISM Manufacturing Index
August 2025 Update

Labels: , , , , , , , , , ,


--> www.FedPrimeRate.com Privacy Policy <--

CLICK HERE to JUMP to the TOP of THIS PAGE

>  SITEMAP  <

Monday, August 04, 2025

U.S. Factory Shipments During June 2025

The U.S. Census Bureau this morning released their report on Manufacturers' Shipments, Inventories and Orders -- also known as Factory Orders -- for  June, 2025:

========

Predicted: -5.0%

  • Actual: -4.8% (-30,851,000,000)

========

  • June, 2025 New Shipments: $611,682,000,000.

  • May, 2025 New Shipments: $642,533,000,000.


========

  • Change from 12 Months Ago (Year-on-Year):

    +$39,562,000,000 | +6.62% (not seasonally adjusted)

 ========

The yellow-highlighted percentage is the seasonally adjusted, month-to-month change in new shipments for both durable and nondurable goods made by U.S. manufacturers. The "predicted" figure is what economists were expecting, while the "actual" is the true or real figure.

=============

CHART: U.S. Factory Orders - JUNE 2025 Update
CHART: U.S. Factory Orders
JUNE 2025 Update

=============


=============

Labels: , , , , , , , , , , , , , ,


--> www.FedPrimeRate.com Privacy Policy <--

CLICK HERE to JUMP to the TOP of THIS PAGE

>  SITEMAP  <

Wednesday, June 04, 2025

U.S. Factory Shipments During April 2025

The U.S. Census Bureau this morning released their report on Manufacturers' Shipments, Inventories and Orders -- also known as Factory Orders -- for April 2025:


========

Predicted: -3.5%

  • Actual: -3.69% (-22,804,000,000)

========

  • April 2025 New Shipments: $594,614,000,000.

  • March 2025 New Shipments: $617,418,000,000.


========

  • Change from 12 Months Ago (Year-on-Year):

    +$3,565,000,000 | +0.61% (not seasonally adjusted)

 ========

The yellow-highlighted percentage is the month-to-month change in new shipments for both durable and nondurable goods made by U.S. manufacturers. The "predicted" figure is what economists were expecting, while the "actual" is the true or real figure.

=============

CHART: U.S. Factory Orders - APRIL 2025 Update
CHART: U.S. Factory Orders
APRIL 2025 Update

=============


=============

Labels: , , , , , , , , , , , , , ,


--> www.FedPrimeRate.com Privacy Policy <--

CLICK HERE to JUMP to the TOP of THIS PAGE

>  SITEMAP  <

Thursday, March 06, 2025

U.S. Factory Shipments During January 2025

The U.S. Census Bureau this morning released their report on Manufacturers' Shipments, Inventories and Orders -- also known as Factory Orders -- for January 2025:


========

Predicted: +1.5%

  • Actual: +1.68% (+9,775,000,000)

========

  • January 2025 New Shipments: $589,935,000,000.

  • December 2024 New Shipments: $580,160,000,000.


========

  • Change from 12 Months Ago (Year-on-Year):

    +$18,677,000,000 | +3.5% (not seasonally adjusted)

 ========

The yellow-highlighted percentage is the month-to-month change in new shipments for both durable and nondurable goods made by U.S. manufacturers. The "predicted" figure is what economists were expecting, while the "actual" is the true or real figure.

=============

CHART: U.S. Factory Orders JANUARY 2025 Update
CHART: U.S. Factory Orders
JANUARY 2025 Update

=============


=============

Labels: , , , , , ,


--> www.FedPrimeRate.com Privacy Policy <--

CLICK HERE to JUMP to the TOP of THIS PAGE

>  SITEMAP  <

Friday, February 28, 2025

Durable Goods Orders During January 2025

The Durable Goods Orders report for January 2025 was released by the Commerce Department this morning:

================

Predicted: +2.0%

  • New Orders: $286,002,000,000 (+$8,655,000,000 [+3.12%])

================

CHART: Durable Goods Orders - JANUARY 2025 UPDATE
CHART: Durable Goods Orders
JANUARY 2025 UPDATE

================

The yellow-highlighted figures represent the month-on-month change in new orders for durable or hard goods for immediate or future delivery from U.S. manufacturers, along with both the dollar and month-to-month percentage change.

Examples of durable goods: cars, airplanes, computers, furniture -- items that are built to last at least three years.

================

================

Labels: , , , , , , , ,


--> www.FedPrimeRate.com Privacy Policy <--

CLICK HERE to JUMP to the TOP of THIS PAGE

>  SITEMAP  <

Tuesday, February 04, 2025

U.S. Factory Shipments During December 2024

The U.S. Census Bureau this morning released their report on Manufacturers' Shipments, Inventories and Orders -- also known as Factory Orders -- for December 2024:


========

Predicted: FLAT

  • Actual: -0.888% (-5,181,000,000)

========

  • December 2024 New Shipments: $578,508,000,000.

  • November 2024 New Shipments: $583,689,000,000.


========

  • Change from 12 Months Ago (Year-on-Year):

    -$3,201,000,000 | -0.55% (not seasonally adjusted)

 ========

The yellow-highlighted percentage is the month-to-month change in new shipments for both durable and nondurable goods made by U.S. manufacturers. The "predicted" figure is what economists were expecting, while the "actual" is the true or real figure.

=============

CHART: U.S. Factory Orders - DECEMBER 2024 Update
CHART: U.S. Factory Orders
DECEMBER 2024 Update

=============


=============

Labels: , , , , , ,


--> www.FedPrimeRate.com Privacy Policy <--

CLICK HERE to JUMP to the TOP of THIS PAGE

>  SITEMAP  <

Tuesday, August 27, 2024

Durable Goods Orders During July 2024

The Durable Goods Orders report for July 2024 was released by the Commerce Department this morning:

================

Predicted: +5.0%

  • Actual: $289,645,000,000 (+$26,074,000,000 [+9.89%])

================
CHART: Durable Goods Orders - JULY 2024 UPDATE
CHART: Durable Goods Orders
JULY 2024 UPDATE

================

The yellow-highlighted figures represent the dollar amount of new orders for durable or hard goods for immediate or future delivery from U.S. manufacturers, along with both the dollar and month-to-month percentage change.

Examples of durable goods: cars, airplanes, computers, furniture -- items that are built to last at least three years.

================

================

Labels: , , , , , , , ,


--> www.FedPrimeRate.com Privacy Policy <--

CLICK HERE to JUMP to the TOP of THIS PAGE

>  SITEMAP  <

Wednesday, July 03, 2024

U.S. Factory Shipments During May 2024

The U.S. Census Bureau this morning released their report on Manufacturers' Shipments, Inventories and Orders -- also known as Factory Orders -- for May 2024:

========

Predicted: FLAT

  • Actual: -0.717% (-4,224,000,000)

========

  • May 2024 New Shipments: $584,805,000,000.

  • April 2024 New Shipments: $589,029,000,000.


========

 Year-to-Date Change: +$57,178,000,000 (+2.02%)

 ========

The yellow-highlighted percentage is the month-to-month change in new shipments for both durable and nondurable goods made by U.S. manufacturers. The "predicted" figure is what economists were expecting, while the "actual" is the true or real figure.

=============

CHART: U.S. Factory Orders May 2022 Update

CHART: U.S. Factory Orders
May 2022 Update


=======
======


=============

Labels: , , , , , ,


--> www.FedPrimeRate.com Privacy Policy <--

CLICK HERE to JUMP to the TOP of THIS PAGE

>  SITEMAP  <

Tuesday, July 02, 2024

ISM Manufacturing Index for June 2024

Earlier today, the Institute for Supply Management® (ISM®) released their Manufacturing Purchasing Manager's Index (PMI®) for June 2024:

=========

Predicted: 49.0%

  • Actual: 48.5% (-0.2 point month-on-month change)

=========

Previous month (revised): 48.7%

=========

Every month, the ISM surveys purchasing and supply executives at hundreds of companies across the country who are involved in manufacturing in some form. The resulting index is watched closely by academics, economists and investors because manufacturing accounts for about 12% of U.S. Gross Domestic Product (GDP).

The PMI is a reliable barometer of U.S. manufacturing: A PMI above 50% implies that U.S. manufacturing expanded during the month specified, while a reading below 50% implies that the made-in-the-USA sector contracted.

=========

From Today's Report:

"...Economic activity in the manufacturing sector contracted in June for the third consecutive month and the 19th time in the last 20 months, say the nation's supply executives in the latest Manufacturing ISM® Report On Business®..."

=========

The Following Is A Sampling Of Quotes
From A Diverse Pool Of U.S. Manufacturers:

  •     'High volume of customer orders.'
     [Chemical Products]

  •     'Customers continue to cut orders with short notice, causing a ripple effect throughout lower-tier suppliers.'
     [Transportation Equipment]

  •     'Consumer demand and inventories are no longer stable at retail and food service establishments.'
     [Food, Beverage + Tobacco Products]

  •     'While orders are still steady, inventory from the previous month is enough to satisfy current- and near-term commitments.'
     [Computer + Electronic Products]

  •     'Customers ordering more to create buffer stocks (in case of) future shortages.'
     [Electrical Equipment, Appliances + Components]

  •     'Order levels in two of our main divisions are indicating weak demand, and now we must work to reduce inventory levels.'
     [Fabricated Metal Products]

  •     'Sales backlog is decreasing. We have furloughed a portion of our workforce as a result.'
     [Machinery]

  •     'The level of production is lower due to decreased demand for products.'
     [Miscellaneous Manufacturing]

  •     'Elevated financing costs have dampened demand for residential investment. We have reduced inventories of production components.'
     [Wood Products]

  •     'Orders have increased slightly due to seasonal restocking.'
     [Plastics + Rubber Products]

==========


CHART: ISM Manufacturing Index
 June 2024 Update

Labels: , , , , , ,


--> www.FedPrimeRate.com Privacy Policy <--

CLICK HERE to JUMP to the TOP of THIS PAGE

>  SITEMAP  <

Tuesday, May 03, 2022

U.S. Factory Orders During March 2022

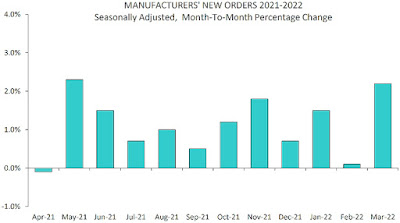
The U.S. Census Bureau this morning released their report on Manufacturers' Shipments, Inventories and Orders -- also known as Factory Orders -- for March 2022:

========

Predicted: +1.5%

  • Actual: +2.167% (+$11,821,000,000)

========

  • March 2022 New Orders: $557,321,000,000.

  • February 2022 New Orders: $545,500,000,000.

========

The yellow-highlighted percentage is the month-to-month change in orders for both durable and nondurable goods made by U.S. manufacturers. The "predicted" figure is what economists were expecting, while the "actual" is the true or real figure.

=============


CHART: U.S. Factory Orders - March 2022 Update

CHART: U.S. Factory Orders
March 2022 Update


=============


=============


Labels: , , , , , , , , , , ,


--> www.FedPrimeRate.com Privacy Policy <--

CLICK HERE to JUMP to the TOP of THIS PAGE

>  SITEMAP  <

Monday, May 02, 2022

ISM Manufacturing Index for April 2022

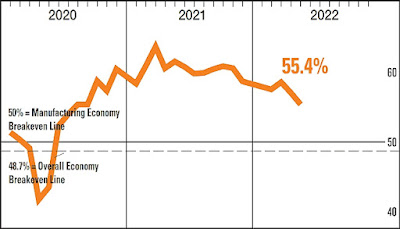
Earlier today, the Institute for Supply Management® (ISM®) released their Manufacturing Purchasing Manager's Index (PMI®) for April 2022:

=========

Predicted: 57.0%

  • Actual: 55.4% (-1.7 point month-on-month change)

=========

Previous month (revised): 57.1%

=========

Every month, the ISM surveys purchasing and supply executives at hundreds of companies across the country who are involved in manufacturing in some form. The resulting index is watched closely by academics, economists and investors because manufacturing accounts for about 12% of U.S. Gross Domestic Product (GDP).

The PMI is a reliable barometer of U.S. manufacturing: A PMI above 50% implies that U.S. manufacturing expanded during the month specified, while a reading below 50% implies that the made-in-the-USA sector contracted.

=========

From Today's Report:

"...The April Manufacturing PMI® registered 55.4%. This is the lowest reading since the July 2020 (53.9%.)

Economic activity in the manufacturing sector grew in April, with the overall economy achieving a 23rd consecutive month of growth, say the nation’s supply executives in the latest Manufacturing ISM® Report On Business®..."

=========

The Following Is A Sampling Of Quotes
From A Diverse Pool Of U.S. Manufacturers:

  • "...'Tier-2 supplier shutdowns in Shanghai are causing a ripple effect for our suppliers in other parts of China. Long delays at ports, including in the U.S., are still providing supply challenges. Inflation is out of control. Fuel costs, and therefore freight costs, are leading the upward cycle. At some point, the economy must give way; it will be tough to have real growth with such pressure on costs. Despite the issues and poor outlook, business remains brisk.'
     [Chemical Products]


  • 'Continued strong demand with improvements in the supply chain. Delays still exist, but supply issues are slowly improving. Cost increases in multiple categories.'
     [Transportation Equipment]


  • 'Supply chain is still constrained, and prices continue to rise. We are focusing on ways to stay profitable while continuing to fill customer orders. Relationship management and strong negotiation skills are extremely important right now.'
     [Food, Beverage + Tobacco Products]


  • 'New order entries are still very strong. Unfortunately, logistics issues have (not) yet improved, so lead times remain extended.'
     [Machinery]


  • 'Due to electronic component supply chain issues, production output has been lower than normal. Backlog is growing due to the supply chain issues. New order sales are steady, except international orders are lower.'
     [Fabricated Metal Products]


  • 'Business is strong. Backlog continues to grow due to new orders and inconsistent supply chain conditions. Shortages of components are the main factor limiting our production.'
     [Electrical Equipment, Appliances + Components]


  • 'The shutdowns in China due to a new COVID-19 wave are causing supply concerns for late second quarter and early third quarter. We have extended lead times to customers and are ordering product from China to cover demand through Q4 and early 1Q 2023.'
     [Miscellaneous Manufacturing]


  • 'Overall, improvements in supply chain are occurring on larger scale items, but we see suppliers that sell us low-volume items struggling in some cases with getting feed stocks and raw materials they need. Freight continues to plague things as well.'
     [Nonmetallic Mineral Products]


  • 'Business is still very robust. Material price increases continue to be passed on (to customers) based on costs of raw materials, logistics and labor to produce products.'
     [Plastics + Rubber Products]..."


==========

 
CHART: ISM Manufacturing Index - April 2022 Update

CHART: ISM Manufacturing Index - April 2022 Update
 

Labels: , , , , , , , , , , , ,


--> www.FedPrimeRate.com Privacy Policy <--

CLICK HERE to JUMP to the TOP of THIS PAGE

>  SITEMAP  <

Wednesday, April 27, 2022

Durable Goods Orders During March 2022

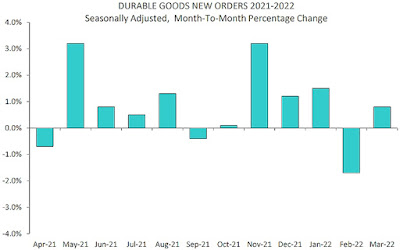
The Durable Goods Orders report for March 2022 was released by the Commerce Department this morning:

================

Predicted: +1.1%

  • Actual: $272,718,000,000 (+$2,295,000,000 [+0.842%])

================

 CHART: Durable Goods Orders - March 2022 Update


CHART: Durable Goods Orders
March 2022 Update

================

From Today's Report:

"...Excluding transportation, new orders increased 1.1 percent. Excluding defense, new orders increased 1.2 percent. Computers and electronic products, up two of the last three months, led the increase, $0.7 billion or 2.6 percent to $26.3 billion..."

================

The yellow-highlighted figures represent the dollar amount of new orders for durable or hard goods for immediate or future delivery from U.S. manufacturers, along with both the dollar and month-to-month percentage change.

Examples of durable goods: cars, airplanes, computers, furniture -- items that are built to last at least three years.

================


 ================

Labels: , , , , , ,


--> www.FedPrimeRate.com Privacy Policy <--

CLICK HERE to JUMP to the TOP of THIS PAGE

>  SITEMAP  <

Monday, April 04, 2022

U.S. Factory Orders During February 2022

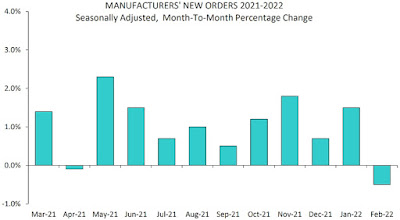
The U.S. Census Bureau this morning released their report on Manufacturers' Shipments, Inventories and Orders -- also known as Factory Orders -- for February 2022:

========

Predicted: -0.3%

  • Actual: -0.5% (-$2,724,000,000)

========

  • February 2022 New Orders: $541,993,000,000.

  • January 2022 New Orders: $544,717,000,000.

========

The yellow-highlighted percentage is the month-to-month change in orders for both durable and nondurable goods made by U.S. manufacturers. The "predicted" figure is what economists were expecting, while the "actual" is the true or real figure.

=============


CHART: U.S. Factory Orders - February 2022 Update

CHART: U.S. Factory Orders
February 2022 Update


=======
======


=============


Labels: , , , , , , , , , , ,


--> www.FedPrimeRate.com Privacy Policy <--

CLICK HERE to JUMP to the TOP of THIS PAGE

>  SITEMAP  <

Friday, April 01, 2022

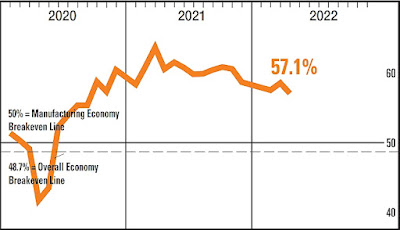
ISM Manufacturing Index for March 2022

Earlier today, the Institute for Supply Management® (ISM®) released their Manufacturing Purchasing Manager's Index (PMI®) for March 2022:

=========

Predicted: 58.0%

  • Actual: 57.1% (-1.5 point month-on-month change)

=========

Previous month (revised): 58.6%

=========

Every month, the ISM surveys purchasing and supply executives at hundreds of companies across the country who are involved in manufacturing in some form. The resulting index is watched closely by academics, economists and investors because manufacturing accounts for about 12% of U.S. Gross Domestic Product (GDP).

The PMI is a reliable barometer of U.S. manufacturing: A PMI above 50% implies that U.S. manufacturing expanded during the month specified, while a reading below 50% implies that the made-in-the-USA sector contracted.

=========

From Today's Report:

"...Economic activity in the manufacturing sector grew in March, with the overall economy achieving a 22nd consecutive month of growth, say the nation's supply executives in the latest Manufacturing ISM® Report On Business®..."

=========

The Following Is A Sampling Of Quotes
From A Diverse Pool Of U.S. Manufacturers:

  • "...'No letup yet in supply chain challenges, especially electronic components. Relying more and more on the broker market.'
     [Computer + Electronic Products]


  • 'Customer orders are brisk in the face of significant price increases, while we continue to struggle with inbound supplier service and raw material availability issues.'
     [Chemical Products]


  • 'Generally speaking, the business environment is slowly improving for aerospace component manufacturers. Supply chain disruptions and still-extending lead times continue to keep purchasing busy. This further causes reevaluation of the current year’s business plan and cost assumptions.'
     [Transportation Equipment]


  • 'Overall business conditions are challenging in both domestic and international transportation. The Russian invasion of Ukraine has created uncertainty in the grain markets, causing upward pricing pressure. In addition, inflationary pressures across all categories have made it challenging to manage cost and profitability.'
     [Food, Beverage + Tobacco Products]


  • 'Prices are increasing on steel and steel products after a slight decrease from highs last month. Transportation costs are going up significantly with the increase in fuel prices.'
     [Machinery]


  • 'Backlog continues to be strong as we ship delinquent orders resulting from COVID-19 slowdowns.' [Fabricated Metal Products]
    'Demand continues to be strong. Backlog is still increasing -- currently at about three months of production. Availability of purchased material continues to constrain production, causing the increased backlog.'
     [Electrical Equipment, Appliances + Components]


  • 'Business continues to be strong, with incoming sales higher but still combating labor and material issues like availability and inflation. Still determining impact of the Russian invasion of Ukraine.'
     [Furniture + Related Products]


  • 'The supply situation is getting worse, with lead times extending over 12 months, material not available, and suppliers not quoting or taking orders. Prices on the rise daily.'
     [Miscellaneous Manufacturing]


  • 'Supply chain is still unstable. While we have seen improvements, there are still a lot of issues that have yet to be resolved.'
     [Primary Metals]..."


==========


CHART: ISM Manufacturing Index - March 2022 Update

CHART: ISM Manufacturing Index
March 2022 Update

Labels: , , , , , , , , , , , ,


--> www.FedPrimeRate.com Privacy Policy <--

CLICK HERE to JUMP to the TOP of THIS PAGE

>  SITEMAP  <

Tuesday, March 01, 2022

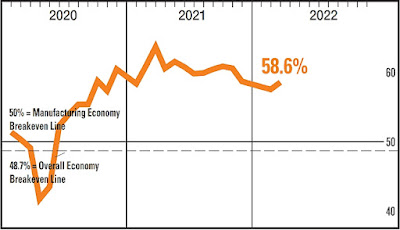
ISM Manufacturing Index for February 2022

Earlier today, the Institute for Supply Management® (ISM®) released their Manufacturing Purchasing Manager's Index (PMI®) for February 2022:

=========

Predicted: 58.0%

  • Actual: 58.6% (+1.0 point month-on-month change)

=========

Previous month (revised): 57.6%

=========

Every month, the ISM surveys purchasing and supply executives at hundreds of companies across the country who are involved in manufacturing in some form. The resulting index is watched closely by academics, economists and investors because manufacturing accounts for about 12% of U.S. Gross Domestic Product (GDP).

The PMI is a reliable barometer of U.S. manufacturing: A PMI above 50% implies that U.S. manufacturing expanded during the month specified, while a reading below 50% implies that the made-in-the-USA sector contracted.

=========

From Today's Report:

"...Economic activity in the manufacturing sector grew in February, with the overall economy achieving a 21st consecutive month of growth, say the nation's supply executives in the latest Manufacturing ISM® Report On Business®..."

=========

The Following Is A Sampling Of Quotes
From A Diverse Pool Of U.S. Manufacturers:

  • "...'Electronic supply chain is still a mess.'
     [Computer + Electronic Products]


  • 'Strong sales growth as retail continues to return.'
     [Chemical Products]


  • 'Demand for transportation equipment remains strong. Supply of transportation services continues to be a major issue for the supply chain.'
     [Transportation Equipment]


  • 'Strong demand has continued beyond our traditional seasonality curves. Coupled with the continuing difficulties in procurement of ocean freight, operational planning and managing costs are our biggest challenges.'
     [Food, Beverage + Tobacco Products]


  • 'We have seen year-over-year revenue growth of about 10 percent due to markets coming back. However, in the automotive area, the microchip shortage is causing slowness in growth.'
     [Machinery]


  • 'Demand for steel products has increased to historic levels, driven by the automotive and energy industries.'
     [Fabricated Metal Products]


  • 'We are expecting a year of strong demand, higher prices and continued supply chain challenges.'
     [Textile Mills]


  • 'Demand continues to be strong, increasing our backlog. Production has been more consistent due to availability of parts, but we are not able to increase builds to cut into the backlog.'
     [Electrical Equipment, Appliances + Components]


  • 'Business conditions are good, demand remains strong, and we continue to be challenged to keep up with demand.'
     [Miscellaneous Manufacturing]


  • 'Business is still strong. Facing logistics and raw material supply chain issues with some products.'
    [Plastics + Rubber Products]..."

 =========

CHART: ISM Manufacturing Index - February 2022 Update

CHART: ISM Manufacturing Index
February 2022 Update

Labels: , , , , , , , , , , , ,


--> www.FedPrimeRate.com Privacy Policy <--

CLICK HERE to JUMP to the TOP of THIS PAGE

>  SITEMAP  <

Wednesday, February 02, 2022

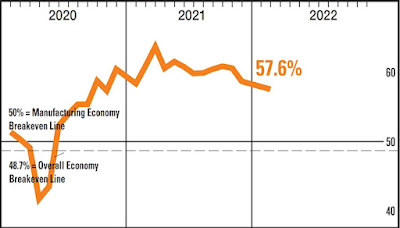
ISM Manufacturing Index for January 2022

Earlier today, the Institute for Supply Management® (ISM®) released their Manufacturing Purchasing Manager's Index (PMI®) for January 2022:

=========

Predicted: 58.0%

  • Actual: 57.6% (-1.2 points month-on-month change)

=========

Previous month (revised): 58.8%

=========

Every month, the ISM surveys purchasing and supply executives at hundreds of companies across the country who are involved in manufacturing in some form. The resulting index is watched closely by academics, economists and investors because manufacturing accounts for about 12% of U.S. Gross Domestic Product (GDP).

The PMI is a reliable barometer of U.S. manufacturing: A PMI above 50% implies that U.S. manufacturing expanded during the month specified, while a reading below 50% implies that the made-in-the-USA sector contracted.

=========

From Today's Report:

"...Economic activity in the manufacturing sector grew in January, with the overall economy achieving a 20th consecutive month of growth, say the nation's supply executives in the latest Manufacturing ISM® Report On Business®..."

 =========


The following is a sampling of quotes from a diverse pool of U.S. manufacturers:


  • "...'We are experiencing massive interruptions to our production due to supplier COVID-19 problems limiting their manufacturing of key raw (materials) like steel cans and chemicals.'
     [Chemical Products]


  •  'While there has been some improvement in materials making it to our factories and logistics centers, we are still constrained by (a lack of) qualified labor. Orders so far are not being cancelled, but we are concerned that customers may be losing patience.'
     [Computer + Electronic Products]


  •  'Transportation, labor and inflation issues continue to hamper our supply chain and ability to service our customers. Fortunately, it’s also hampering our competition as well. Ultimately, the biggest impact is at the consumer level, as (price increases) continue to get passed through.'
     [Transportation Equipment]


  •  'Our suppliers are having difficulty meeting scheduled releases as their suppliers experience delays and shortages, so lead times and inventories are struggling, resulting in lost production.'
     [Food, Beverage + Tobacco Products]


  •  'Lack of skilled production personnel, either from missing work due to (COVID-19) variants or leaving for better opportunities, making it more difficult to complete work. Working off a backlog.'
     [Fabricated Metal Products]


  •  'Strong backlog of orders coming into the new year. Potential to beat target revenue, depending on availability of purchased product.'
     [Electrical Equipment, Appliances + Components]


  •  'Bookings continue to increase as we are still dealing with a shortage of labor and supply chain issues.'
     [Furniture + Related Products]


  •  'Transportation restrictions and a lack of supplier manpower continue to create significant shortages that limit our production. This, in turn, limits what we can supply to customers, as well as on-time delivery.'
     [Machinery]


  •  'Integrated circuit availability is really causing issues. Shortages of raw materials and other electronic materials continue to hamper deliveries to our customers.'
     [Miscellaneous Manufacturing]


  •  'The supply chain crunch may be loosening a bit; however, specific original equipment manufacturer (OEM) parts and equipment now have lead times that we have not experienced before.'
     [Nonmetallic Mineral Products]..."


 =========

 CHART: ISM Manufacturing Index - January 2022 Update
 CHART: ISM Manufacturing Index
January 2022 Update


Labels: , , , , , , , ,


--> www.FedPrimeRate.com Privacy Policy <--

CLICK HERE to JUMP to the TOP of THIS PAGE

>  SITEMAP  <

bing

bing


SCAMS!

FedPrimeRate.com
Entire Website © 1999 - 2025 FedPrimeRate.comSM


This website is neither affiliated nor associated with The United States Federal Reserve
in any way. Information in this website is provided for educational purposes only. The owners
of this website make no warranties with respect to any and all content contained within this
website. Consult a financial professional before making important decisions related to any
investment or loan product, including, but not limited to, business loans, personal loans,
education loans, first or second mortgages, credit cards, car loans or any type of insurance.