.comment-link {margin-left:.6em;}

Economy

Economic Data (USA)

Thursday, January 31, 2019

New Home Sales During November 2018

The November 2018 New Home Sales report was released by the Commerce Department this morning:

Predicted: 560,000
Actual New Home Sales: 657,000

------------------------------------------------------

Change from One Month Previous: +16.9%

Change from One Year Previous: -7.7%

------------------------------------------------------

Median Price for a New Home during November 2018: $302,400

========

Average Price for a New Home during November 2018: $362,400


------------------------------------------------------

Inventory: 330,000 (6.0 months supply at current sales rate.)

------------------------------------------------------

================================


================================

Chart: New Home Sales - November 2018 Update

================================


Compiled jointly by the U.S. Commerce Department and the U.S. Department of Housing and Urban Development, the yellow-highlighted figure above is the seasonally adjusted and annualized number of newly-built homes with committed buyers for the indicated month.

The "predicted" figure is what economists were expecting, while the "actual" is the true or real figure.

The New Home Sales report is watched by economists and investors because it offers insight into the state of the U.S. housing market, and also provides data that can be used to predict sales of large household furniture and appliances like refrigerators, air conditioners, microwave ovens, etc.


================================

================================


Labels: , , ,


--> www.FedPrimeRate.com Privacy Policy <--

>  SITEMAP  <

Employment Cost Index for Q4, 2018

The Employment Cost Index (ECI) for the fourth quarter of 2018 was released by The Labor Department's Bureau of Labor Statistics this morning:

Predicted: +0.7%
Actual: +0.7%


  • Reading from previous quarter: +0.8%
     
  • Change from 12 months previous (Y/Y): +2.9%


The yellow-highlighter figure represents the seasonally adjusted, quarter-to-quarter change for the ECI, which is the Labor Department's broadest measure of employee-compensation costs, and includes wages, salaries and benefits.

==================

  • Wages and Salaries: +0.6%

  • Change from 12 months previous (Y/Y): +3.1% 

==================

  • Benefits: +0.7%

  • Change from 12 months previous (Y/Y): +2.8% 

==================


From the Labor Department website:


"...The Employment Cost Index (ECI) measures the change in the cost of labor, free from the influence of employment shifts among occupations and industries..."

==================

Employment Cost Index - Q4, 2018 Update

==================

  • The ECI report for the fourth quarter of 2018 is scheduled for release on April 30, 2019.


==================


Labels: , , , , , , , ,


--> www.FedPrimeRate.com Privacy Policy <--

>  SITEMAP  <

Wednesday, January 30, 2019

Crude Oil Inventories Report for Week of January 25, 2019

The U.S. Crude Oil Inventories report for the week that ended on January 25, 2019 was released this morning: 

-- Change from Last Week: +900,000

-- Change from Last Year (Y/Y): +27,600,000 Barrels

-- Current U.S. Crude Oil Stocks: 445,900,000 Barrels

Diminishing crude oil inventories often translate to higher crude oil prices (and vice versa), but not always.

The report is produced by the U.S. Energy Information Administration (EIA).

Labels: , , , ,


--> www.FedPrimeRate.com Privacy Policy <--

>  SITEMAP  <

Tuesday, January 29, 2019

Consumer Confidence Index (CCI) for January 2019

The Consumer Confidence Index® (CCI) for this month (January 2019) was released by The Conference Board® this morning:

Actual: 120.2

================

Previous Month (revised): 126.6
 
==========

The "predicted" figure is what economists were expecting, while the "actual" is the true or real figure.

From Today's Report:

"...'Consumer Confidence declined in January, following a decrease in December,' said Lynn Franco, Senior Director of Economic Indicators at The Conference Board. 'The Present Situation Index was virtually unchanged, suggesting economic conditions remain favorable. Expectations, however, declined sharply as financial market volatility and the government shutdown appear to have impacted consumers. Shock events such as government shutdowns (i.e. 2013) tend to have sharp, but temporary, impacts on consumer confidence. Thus, it appears that this month’s decline is more the result of a temporary shock than a precursor to a significant slowdown in the coming months.'

Consumers’ appraisal of current conditions was little changed in January. The percentage of consumers claiming business conditions are 'good' was virtually unchanged at 37.4 percent, while those saying business conditions are 'bad' decreased from 11.6 percent to 11.1 percent. Consumers’ assessment of the labor market was mixed. Those stating jobs are 'plentiful' increased from 45.5 percent to 46.6 percent, while those claiming jobs are 'hard to get' also increased, from 12.2 percent to 12.9 percent.

Consumers’ optimism about the short-term future was more pessimistic in January. The percentage of consumers expecting business conditions will improve over the next six months decreased from 18.1 percent to 16.0 percent, while those expecting business conditions will worsen increased from 10.6 percent to 14.8 percent.

Consumers’ outlook for the labor market was also less favorable. The proportion expecting more jobs in the months ahead decreased from 16.6 percent to 14.7 percent, while those anticipating fewer jobs increased, from 14.6 percent to 16.5 percent. Regarding their short-term income prospects, the percentage of consumers expecting an improvement declined from 22.4 percent to 18.2 percent, but the proportion expecting a decrease also declined, from 7.6 percent to 7.1 percent..
."

Every month, The Conference Board sends a questionnaire to 5,000 U.S. households. Survey participants are polled about their feelings regarding the U.S. economy, current and future, and about their own fiscal circumstances. On average, 3,500 participants complete and return the 5-question survey.

  • The baseline "100" score for the CCI is associated with 1985 survey data.

When consumers feel good about the economy, they tend to do more spending, and vice versa.

Based in New York City, The Conference Board is a private, not-for-profit organization with a mission to, "create and disseminate knowledge about management and the marketplace to help businesses strengthen their performance and better serve society."

The CCI is usually released on the last Tuesday of the month.

=====================

=====================

Labels: , , ,


--> www.FedPrimeRate.com Privacy Policy <--

>  SITEMAP  <

Saturday, January 26, 2019

The S&P 500 Index Lost 0.223% On The Week

Summary of U.S. Markets for the Week Ending January 25, 2019:

===================================

Dow Jones Industrial Average (DJIA) closed @ 24,737.20:

- added 30.85 points (+0.125%) on the week.
- lost 2,091.19 points (-7.795%) since the October 3, 2018 record-high close (26,828.39.)

---------------------------

S and P 500 Index closed @ 2,664.76:

- gave up 5.95 points (-0.223%) on the week.
- lost 265.99 points (-9.076%) since the September 20, 2018 record-high close (2,930.75.)

--------------------------- 

NASDAQ Composite Index closed @ 7,164.86:

- gained 7.63 points (+0.107%) on the week.
- lost 944.83 points (-11.651%) since the August 29, 2018 record-high close (8,109.69.)

===================================

- NYMEX Crude Oil for Future Delivery closed @ $53.69 per barrel

- Comex Gold for April 2019 delivery closed @ $1,304.20 per troy ounce

- In New York, a U.S. dollar buys 0.8766 euros

- In New York, a Euro buys 1.1412 U.S. dollars

- The United States Prime Rate is 5.50%

- The Target Range for the Fed Funds Rate is 2.25% - 2.50%

- The yield on the 10-Year Treasury Note is currently @ 2.76%

===================================


Labels: , , , , , , , , , , ,


--> www.FedPrimeRate.com Privacy Policy <--

>  SITEMAP  <

Thursday, January 24, 2019

Crude Oil Inventories Report for Week of January 18, 2019

The U.S. Crude Oil Inventories report for the week that ended on  January 18, 2019 was released this morning: 

-- Change from Last Week: +8,000,000

-- Change from Last Year (Y/Y): +33,400,000 Barrels

-- Current U.S. Crude Oil Stocks: 445,000,000 Barrels

Diminishing crude oil inventories often translate to higher crude oil prices (and vice versa), but not always.

The report is produced by the U.S. Energy Information Administration (EIA).


Labels: , , , ,


--> www.FedPrimeRate.com Privacy Policy <--

>  SITEMAP  <

Leading Economic Index for December 2018

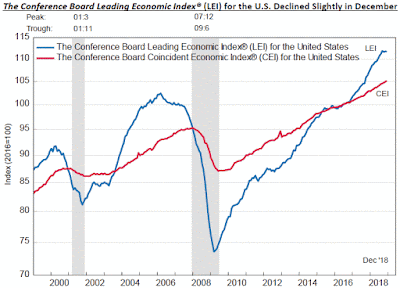
The Conference Board® released its Leading Economic Index® (LEI) for December 2018 this morning:

==============

Index for December: 111.7 (The baseline 100 score is associated with 2016 data.)

Predicted: -0.1%
Actual: -0.0894% (-0.1 point)

==============

  • Index for November 2018: 111.8 

  • Index for October 2018: 111.6

==============

The yellow-highlighted percentage is the month-to-month change for the index.  The "predicted" figure is what economists were expecting, while the "actual" is the true or real figure.

The LEI is a composite of 10 of the nation's economic data releases that's put together by The Conference Board. Statistically, the components listed below have shown a significant increase or decrease before national economic upturns or downturns:

  1. The Standard + Poor's 500 Index

  2. Average weekly claims for unemployment insurance

  3. Building permits for new private housing

  4. The interest rate spread between the yield on the benchmark 10-Year Treasury Note and Federal Funds

  5. ISM® Index of New Orders

  6. Manufacturer's new orders for consumer goods or materials

  7. Manufacturers' new orders, nondefense capital goods excluding aircraft orders

  8. Average weekly manufacturing hours

  9. Average consumer expectations for business conditions

  10. Leading Credit Index™

==============

Chart: Leading Economic Index - December 2018 Update

==============

 
From Today's Report:

"...'The US LEI declined slightly in December and the recent moderation in the LEI suggests that the US economic growth rate may slow down this year,' said Ataman Ozyildirim, Director of Economic Research at The Conference Board. 'While the effects of the government shutdown are not yet reflected here, the LEI suggests that the economy could decelerate towards 2 percent growth by the end of 2019.'..."

==============


Labels: , , ,


--> www.FedPrimeRate.com Privacy Policy <--

>  SITEMAP  <

New Unemployment Insurance Claims for The Week of January 19, 2019

Earlier today, the Labor Department released its weekly report on New Jobless Insurance Claims for the week that ended on January 19, 2019:

Predicted: 218,000
Actual: 199,000

The yellow-highlighted figure represents the number of first-time claims for unemployment benefits for the entire United States. The "predicted" figure is what economists were expecting, while the "actual" is the true or real figure.

  • Previous Week (revised): 212,000
  • 4-Week Moving Average: 215,000
====================

 From Today's Report:

"...This is the lowest level for initial claims since November 15, 1969 when it was 197,000...."

====================


====================


Labels: , , , ,


--> www.FedPrimeRate.com Privacy Policy <--

>  SITEMAP  <

Tuesday, January 22, 2019

Existing Home Sales During December 2018

The Existing Home Sales report for December 2018 was released by The National Association of Realtors® (NAR) this morning:

Predicted: 5,225,000
Actual: 4,990,000

  •  Change from Previous Month: -6.4%

  •  Change from One Year Previous: -10.3%
==========

Inventory: 1,550,000 (3.7 months supply)

==========

The yellow-highlighted, "actual" figure above represents the preliminary, seasonally adjusted annualized sales count of existing homes, co-ops and condominiums for the indicated month. The "predicted" figure is what economists were expecting, while the "actual" is the true or real figure.

------------------------------------------------------

Median Price for A Used Home During December: $253,600

Change from One Year Previous: +2.9%

---------

Average Price for A Used Home During December: $292,800

Change from One Year Previous: +1.6%

------------------------------------------------------  

+-+-+-+-+-+-+-+-+-+-+-+-+-+-+-+-+-+-+-+-+-+-+-+

  • Median Price for A Used Home During 2018: $259,100
  • Change from 2017: +4.814%

+-+-+-+-+-+-+-+-+-+-+-+-+-+-+-+-+-+-+-+-+-+-+-+

==========


==========

From Today's Report:


"...Lawrence Yun, NAR’s chief economist, says current housing numbers are partly a result of higher interest rates during much of 2018. 'The housing market is obviously very sensitive to mortgage rates. Softer sales in December reflected consumer search processes and contract signing activity in previous months when mortgage rates were higher than today. Now, with mortgage rates lower, some revival in home sales is expected going into spring.'

'Several consecutive months of rising inventory is a positive development for consumers and could lead to slower home price appreciation,' says Yun. 'But there is still a lack of adequate inventory on the lower-priced points and too many in upper-priced points.'

'The partial shutdown of the federal government has not had a significant effect on December closings, but the uncertainty of a shutdown has the potential to harm the market,' said NAR President
John Smaby, a second-generation Realtor® from Edina, Minnesota and broker at Edina Realty. 'Once the government is fully reopened, I am hopeful that housing transactions will increase.'..."


==================


==================


Labels: , , , , , ,


--> www.FedPrimeRate.com Privacy Policy <--

>  SITEMAP  <

Friday, January 18, 2019

Industrial Production + Manufacturing + Capacity Utilization During December 2018

The Industrial Production, Manufacturing and Capacity Utilization numbers for December 2018 were released by the Federal Reserve this morning:

Industrial Production:
Predicted: +0.3%
Actual: +0.3%

Manufacturing:
Predicted: +0.1%
Actual: +1.1%

The yellow-highlighted percentages represent the month-to-month change in manufacturing, and physical output from mining operations, utility plants and factories for the entire United States.

Capacity Utilization Rate:
Predicted: 78.4%
Actual: 78.7

The Capacity Utilization Rate represents the use of available resources at mining operations, utility plants and factories for the entire United States last month.

The "predicted" figures are what economists were expecting, while the "actual" is the true or real figure.

From today's report:

"...Industrial production increased 0.3 percent in December after rising 0.4 percent in November. For the fourth quarter as a whole, total industrial production moved up at an annual rate of 3.8 percent. In December, manufacturing output increased 1.1 percent, its largest gain since February 2018. The output of mines rose 1.5 percent, but the index for utilities fell 6.3 percent, as warmer-than-usual temperatures lowered the demand for heating. At 109.9 percent of its 2012 average, total industrial production was 4.0 percent higher in December than it was a year earlier. Capacity utilization for the industrial sector rose 0.1 percentage point in December to 78.7 percent, a rate that is 1.1 percentage points below its long-run (1972–2017) average..."

===============


===============


Labels: , , ,


--> www.FedPrimeRate.com Privacy Policy <--

>  SITEMAP  <

Thursday, January 17, 2019

New Unemployment Insurance Claims for The Week of January 12, 2019

Earlier today, the Labor Department released its weekly report on New Jobless Insurance Claims for the week that ended on January 12, 2019:

Predicted: 221,000
Actual: 213,000

The yellow-highlighted figure represents the number of first-time claims for unemployment benefits for the entire United States. The "predicted" figure is what economists were expecting, while the "actual" is the true or real figure.

  • Previous Week (unrevised): 216,000
  • 4-Week Moving Average: 220,750
====================


====================


Labels: , , , ,


--> www.FedPrimeRate.com Privacy Policy <--

>  SITEMAP  <

Wednesday, January 16, 2019

Import and Export Price Indexes for December 2018

The Labor Department's Bureau of Labor Statistics this morning released its report on U.S. Import and Export Price Indexes for December 2018:

Import Prices
Predicted: -1.2%
Actual: -1.0%

Change From 12 Months Previous: -0.6%

===============

Export Prices
Predicted: -0.3%
Actual: -0.6%

Change From 12 Months Previous: +1.1%

===============
 
The above percentages, highlighted in yellow, represent the month-to-month change in prices for:

  • Imports: the cost of goods produced in other countries and sold in the United States.
  • Exports: the cost of goods produced in the USA and sold in other countries.

Together, these indexes offer insight into the status of inflation in the United States, and for the global economy as well. The "predicted" figure is what economists were expecting, while the "actual" is the true or real figure.


===============


===============


Labels: , , , ,


--> www.FedPrimeRate.com Privacy Policy <--

>  SITEMAP  <

Tuesday, January 15, 2019

Producer Price Index - Final Demand (PPI-FD) for December 2018

The Producer Price Index - Final Demand (PPI-FD) for December 2018 was released this morning:

Predicted: No change
Actual: -0.2%

For all of 2018: +2.5%

=============

Below is the PPI-FD when food, energy and trade services are removed:

Predicted: +0.2%
Actual: unchanged

For all of 2018: +2.8%

=============

The above, yellow-highlighted percentages represent the month-to-month change in prices received by domestic producers of goods and services, for goods, services and construction in the United States, for final demand.

Final Demand = personal consumption (consumers), exports, government purchases and capital investment.

The PPI-FD is released by the Labor Department's Bureau of Labor Statistics.

The "predicted" figure is what economists were expecting, while the "actual" is the true or real figure.


==============


==============


Labels: , , , , , ,


--> www.FedPrimeRate.com Privacy Policy <--

>  SITEMAP  <

Friday, January 11, 2019

Consumer Price Index (CPI) for December 2018

Earlier this morning, the Labor Department's Bureau of Labor Statistics released the Consumer Price Index (CPI) for December 2018:

=========================================

Predicted: -0.1
Actual: -0.1 

(Change from 12 months previous: +1.9%)

=========================================

Below is the CPI when food and energy are removed, also known as core CPI:

Predicted: +0.2%
Actual: +0.2%

(Change from 12 months previous: +2.2%)

=========================================

The above, yellow-highlighted figures represent the seasonally adjusted, month-to-month change in prices for a specific group of goods and services that consumers buy, and is, therefore, a very important part of the overall inflation picture for the country.

The "predicted" figure is what economists were expecting, while the "actual" is the true or real figure.

General categories that constitute the CPI are:

  • Healthcare
  • Housing
  • Clothing
  • Communications
  • Education
  • Transportation
  • Food and Beverages
  • Recreation
  • Miscellaneous Goods and Services (grooming expenses, etc.)

========================================= 


=========================================


Labels: , , , ,


--> www.FedPrimeRate.com Privacy Policy <--

>  SITEMAP  <

Wednesday, January 09, 2019

Crude Oil Inventories Report for Week of January 4, 2019

The U.S. Crude Oil Inventories report for the week that ended on  January 4, 2019 was released this morning: 

-- Change from Last Week: -1,700,000

-- Change from Last Year (Y/Y): +20,200,000 Barrels

-- Current U.S. Crude Oil Stocks: 439,700,000 Barrels

Diminishing crude oil inventories often translate to higher crude oil prices (and vice versa), but not always.

The report is produced by the U.S. Energy Information Administration (EIA).


Labels: , , , ,


--> www.FedPrimeRate.com Privacy Policy <--

>  SITEMAP  <

Friday, January 04, 2019

Crude Oil Inventories Report for Week of December 28, 2018

The U.S. Crude Oil Inventories report for the week that ended on December 28, 2018 was released this morning: 

-- Change from Last Week: No Change

-- Change from Last Year (Y/Y): +17,000,000 Barrels

-- Current U.S. Crude Oil Stocks: 441,400,000 Barrels

Diminishing crude oil inventories often translate to higher crude oil prices (and vice versa), but not always.

The report is produced by the U.S. Energy Information Administration (EIA).


Labels: , , , ,


--> www.FedPrimeRate.com Privacy Policy <--

>  SITEMAP  <

Employment Situation Report for December 2018

The Employment Situation Report for December 2018 was released by The Department of Labor's Bureau of Labor Statistics this morning:

Nonfarm Payrolls (month-to-month change)
Predicted: +180,000
Actual: +312,000


U-3 Unemployment Rate (Headline)
Actual: 3.9%
Previous Month: 3.7%
12 Months Previous: 4.1%

U-6 Unemployment Rate*
Actual: 7.6%
Previous Month: 7.6%
12 Months Previous: 8.1%

Average Hourly Earnings (month-to-month change)
Predicted: +0.3%
Actual: +0.402% (+$0.11)

Average Hourly Earnings (year-on-year change)
Predicted: +3.0%
Actual: +3.153% (+$0.84)

Average Weekly Earnings (month-to-month change)
Actual: +0.694% (+$6.53)


Average Weekly Earnings (year-on-year change)
Actual: +3.153% (+$28.98)

Civilian Labor Force Participation Rate: 63.1%
Previous Month: 62.9%
12 Months Previous: 62.7%

Average Workweek
Predicted: 34.5 hours
Actual: 34.5 hours

Economist, academics, central bankers and investors pay very close attention to the monthly Employment Situation report as it offers penetrating insight as to the current and near-future state of the overall U.S. economy. If a) Americans are earning more money and b) the economy is creating new jobs, this typically translates to more money being pumped into the economy (and vice versa.)

The "predicted" figure is what economists were expecting, while the "actual" is the true or real figure.

From today's report:

"...
In December, average hourly earnings for all employees on private nonfarm payrolls rose 11 cents to $27.48 [+0.402%]. Over the year, average hourly earnings have increased by 84 cents, or [+3.153%]. Average hourly earnings of private-sector production and nonsupervisory employees increased by 9 cents to $23.05 [+0.392%] in December.

The change in total nonfarm payroll employment for November was revised up from +155,000 to +176,000, and the change for October was revised up from +237,000 to +274,000. With these revisions, employment gains in October and November combined were 58,000 more than previously reported. (Monthly revisions result from additional reports received from businesses and government agencies since the last published estimates and from the recalculation of seasonal factors.)
After revisions, job gains have averaged 254,000 per month over the last 3 months..." [Establishment Survey Data]
======

 * =  The U-6 Unemployment Rate is defined as:

"Total unemployed, plus all persons marginally attached to the labor force, plus total employed part time for economic reasons, as a percent of the civilian labor force plus all persons marginally attached to the labor force."


===================


 ===================


Labels: , , , , , ,


--> www.FedPrimeRate.com Privacy Policy <--

>  SITEMAP  <

Thursday, January 03, 2019

ISM Manufacturing Index for December 2018

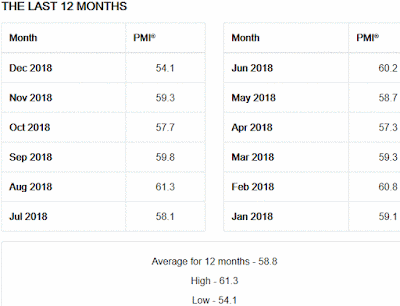
Earlier today, the Institute for Supply Management® (ISM®) released their Manufacturing Purchasing Manager's Index (PMI®) for December 2018:

Predicted: 57.9%
Actual: 54.1% (-5.2 points month-on-month change)

=========

Previous month: 59.3%

=========

Every month, the ISM surveys purchasing and supply executives at hundreds of companies across the country who are involved in manufacturing in some form. The resulting index is watched closely by academics, economists and investors because manufacturing accounts for about 12% of U.S. Gross Domestic Product (GDP).

The PMI is a reliable barometer of U.S. manufacturing: A PMI above 50% implies that U.S. manufacturing expanded during the month specified, while a reading below 50% implies that the made-in-the-USA sector contracted.

=========

From Today's Report:

"...Economic activity in the manufacturing sector expanded in December, and the overall economy grew for the 116th consecutive month, say the nation’s supply executives in the latest Manufacturing ISM® Report On Business®..."
=========

The following is a sampling of quotes from a diverse pool of U.S. manufacturers:


  •     “Growth appears to have stopped. Resources still focused on re-sourcing for U.S. tariff mitigation out of China.”
     (Computer + Electronic Products)

  •     “Brexit has become a problem due to labeling changes.”
     (Chemical Products)

  •     “Customer demand continues to decrease [due to] concerns about the economy and tariffs.”
     (Transportation Equipment)

  •     “Starting to see more and more inflationary increases for raw materials. Also, suppliers [are] forcing price increases due to tariffs.”
    (Food, Beverage + Tobacco Products)

  •     “The ongoing open issues with tariffs between U.S. and China are causing longer-term concerns about costs and sourcing strategies for our manufacturing operations. We were anticipating more clarity [regarding] tariffs at the end of 2018.”
     (Machinery)

  •     “Business is steady, but pace of incoming orders are slowing.”
     (Furniture + Related Products)

  •     “Business is robust for certain sectors [aerospace] and flat to downward for others [energy]. Tariffs continue to impact business direction and profit.”
     (Miscellaneous Manufacturing)

  •     “Caution seems to be the outlook. Are we in a correction, or is the market getting ready to slow over time?”
     (Fabricated Metal Products)

  •     “No major change in business operations towards the end of 2018; however, we are carefully monitoring oil prices and outside influence from market conditions to better understand our 2019 outlook and capital plans.”
     (Petroleum + Coal Products)

  •     “Customers are hedge buying in December as a result of announced price increases starting in January.”
     (Textile Mills)


=========

ISM Manufacturing Index - 12 Month History - December 2018 Update
ISM Manufacturing Index - 12 Month History
December 2018 Update

=========


=========


Labels: , , , ,


--> www.FedPrimeRate.com Privacy Policy <--

>  SITEMAP  <

New Unemployment Insurance Claims for The Week of December 29, 2018

Earlier today, the Labor Department released its weekly report on New Jobless Insurance Claims for the week that ended on December 29, 2018:

Predicted: 217,000
Actual: 231,000

The yellow-highlighted figure represents the number of first-time claims for unemployment benefits for the entire United States. The "predicted" figure is what economists were expecting, while the "actual" is the true or real figure.

  • Previous Week (revised): 221,000
  • 4-Week Moving Average: 218,750
====================


====================


Labels: , , , ,


--> www.FedPrimeRate.com Privacy Policy <--

>  SITEMAP  <

bing

bing


SCAMS!

FedPrimeRate.com
Entire Website © 1999 - 2025 FedPrimeRate.comSM


This website is neither affiliated nor associated with The United States Federal Reserve
in any way. Information in this website is provided for educational purposes only. The owners
of this website make no warranties with respect to any and all content contained within this
website. Consult a financial professional before making important decisions related to any
investment or loan product, including, but not limited to, business loans, personal loans,
education loans, first or second mortgages, credit cards, car loans or any type of insurance.